Estimated redshift from machine learning (Ukwatta et al. 2016) - may take a few minute to calcaulte
Image
Pre-slew 15.0-350.0 keV image (Event data)

#   RAcent    DECcent   POSerr    Theta     Phi              Peak Cts       SNR   Name
   33.2144    38.1112   0.0065    32.6971    75.0753         9.7042926     29.238 TRIG_00882747

Foreground time interval of the image:
  5.868 105.701 (delta_t =  99.833 [sec])
Background time interval of the image:
-239.000   5.868 (delta_t = 244.868 [sec])
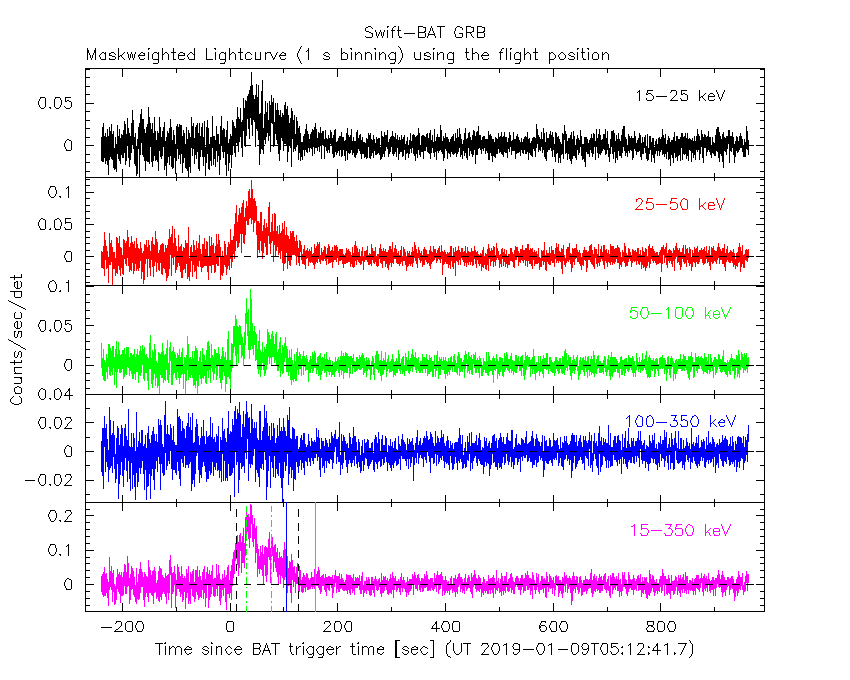
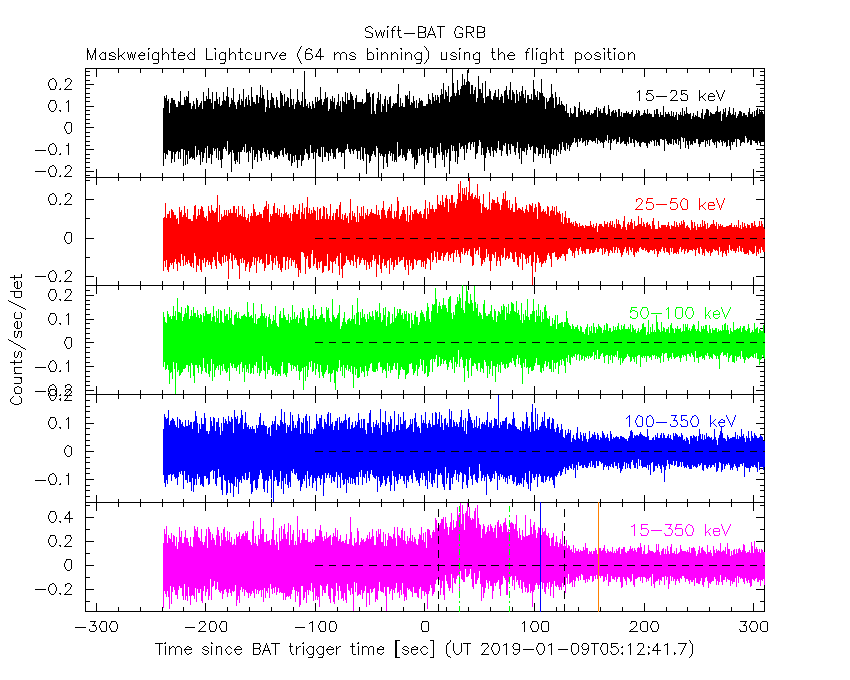
Lightcurves
Notes:
- 1) The mask-weighted light curves are using the flight position.
- 2) Multiple plots of different time binning/intervals are shown to cover all scenarios of short/long GRBs, rate/image triggers, and real/false positives.
- 3) For all the mask-weighted lightcurves, the y-axis units are counts/sec/det where a det is 0.4 x 0.4 = 0.16 sq cm.
- 4) The verticle lines correspond to following: green dotted lines are T50 interval, black dotted lines are T90 interval, blue solid line(s) is a spacecraft slew start time, and orange solid line(s) is a spacecraft slew end time.
- 5) Time of each bin is in the middle of the bin.
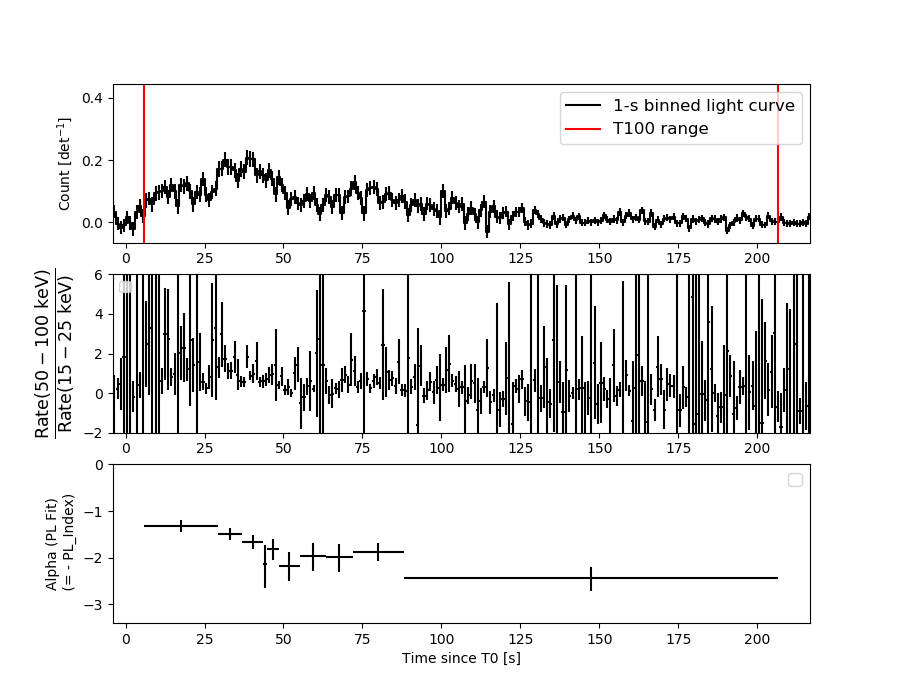
1 s binning
From T0-310 s to T0+310 s

From T100_start - 20 s to T100_end + 30 s

Full time interval
64 ms binning
Full time interval
From T100_start to T100_end

From T0-5 sec to T0+5 sec

16 ms binning
From T100_start-5 s to T100_start+5 s

8 ms binning
From T100_start-3 s to T100_start+3 s

2 ms binning
From T100_start-1 s to T100_start+1 s

SN=5 or 10 sec. binning (whichever binning is satisfied first)
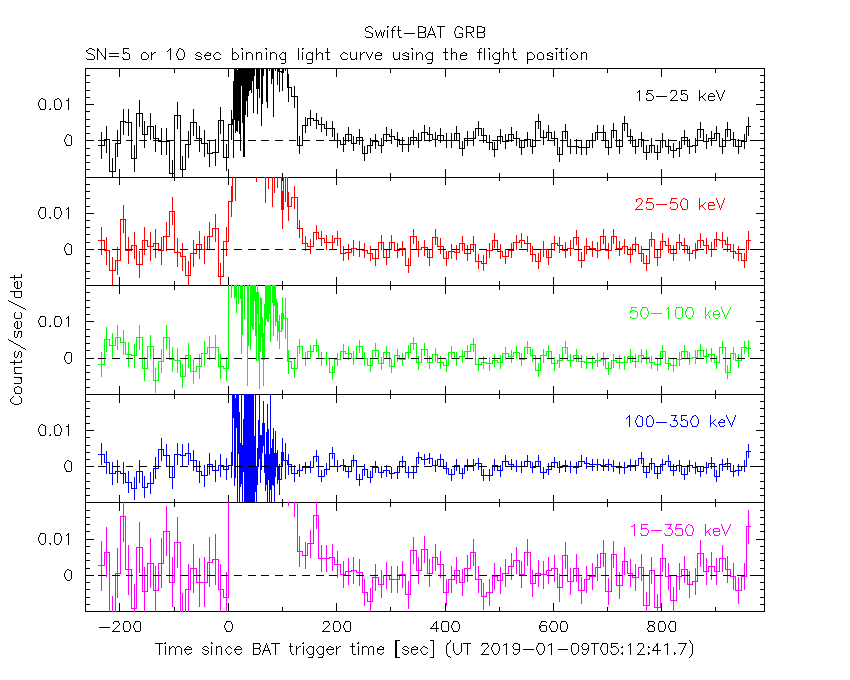
SN=5 or 10 sec. binning (T < 200 sec)

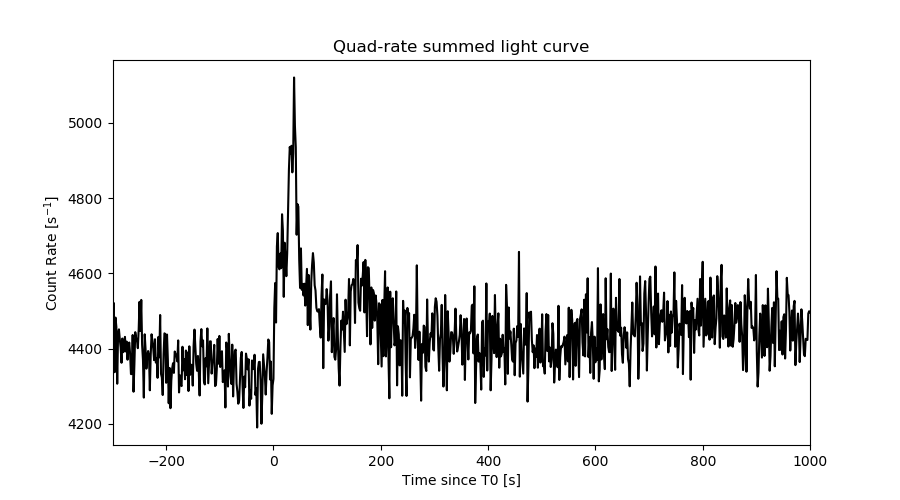
Quad-rate summed light curves (from T0-300s to T0+1000s)
Spectral Evolution
Spectra
Notes:
- 1) The fitting includes the systematic errors.
- 2) When the burst includes telescope slew time periods, the fitting uses an average response file made from multiple 5-s response files through out the slew time plus single time preiod for the non-slew times, and weighted by the total counts in the corresponding time period using addrmf. An average response file is needed becuase a spectral fit using the pre-slew DRM will introduce some errors in both a spectral shape and a normalization if the PHA file contains a lot of the slew/post-slew time interval.
- 3) For fits to more complicated models (e.g. a power-law over a cutoff power-law), the BAT team has decided to require a chi-square improvement of more than 6 for each extra dof.
Time averaged spectrum fit using the average DRM
Power-law model

Time interval is from    5.868 sec. to  206.680 sec.

Spectral model in power-law:
------------------------------------------------------------
Parameters  : value       lower 90%   higher 90%
Photon index: 1.86377     ( -0.0777441   0.0789212 )
Norm@50keV  : 3.33414E-03    ( -0.000160588   0.000159786 )
------------------------------------------------------------
#Fit statistic : Chi-Squared =          88.84 using 59 PHA bins.
# Reduced chi-squared =          1.559 for     57 degrees of freedom
# Null hypothesis probability =   4.421823e-03

Photon flux (15-150 keV)    in 200.8 sec: 0.471319 ( -0.021483  0.021519 ) ph/cm2/s
Energy fluence (15-150 keV)             : 6.15607e-06 ( -2.96389e-07  2.97857e-07 ) ergs/cm2
Cutoff power-law model

Time interval is from    5.868 sec. to  206.680 sec.
Spectral model in the cutoff power-law:
------------------------------------------------------------
Parameters  : value       lower 90%   higher 90%
Photon index: 0.329152     ( -0.501856   0.451168 )
Epeak [keV] : 49.5010      ( -3.45164 4.3706 )
Norm@50keV  : 2.19279E-02    ( -0.0092747   0.0187229 )
------------------------------------------------------------
#Fit statistic : Chi-Squared =          46.11 using 59 PHA bins.
# Reduced chi-squared =         0.8234 for     56 degrees of freedom
# Null hypothesis probability =   8.243563e-01

Photon flux (15-150 keV)    in 200.8 sec: 0.435178 ( -0.023269  0.023359 ) ph/cm2/s
Energy fluence (15-150 keV)             : 5.45272e-06 ( -3.30675e-07  3.38944e-07 ) ergs/cm2
Band function

Time interval is from    5.868 sec. to  206.680 sec.


Spectral model in the Band function:
------------------------------------------------------------
Parameters  : value       lower 90%   higher 90%
alpha       :    (     )
beta        :     (     )
Epeak [keV] :       (   )
Norm@50keV   :     (     )
------------------------------------------------------------

Photon flux (15-150 keV)    in  sec:  (    ) ph/cm2/s
Energy fluence (15-150 keV)             : 0 ( 0  0 ) ergs/cm2
Single BB

Spectral model blackbody:
------------------------------------------------------------
Parameters  : value    Lower 90%  Upper 90%
kT [keV]    : 11.8437  (-0.529047  0.555814)
R^2/D10^2   : 0.119359  (-0.0192333   0.0227509)
(R is the radius in km and D10 is the distance to the source in units of 10 kpc)
------------------------------------------------------------
#Fit statistic : Chi-Squared =          75.43 using 59 PHA bins.
# Reduced chi-squared =          1.323 for     57 degrees of freedom
# Null hypothesis probability =   5.153661e-02

Energy  Fluence     90% Error
[keV]   [erg/cm2]   [erg/cm2]
15- 25  7.102e-07   5.271e-08
25- 50  2.201e-06   1.014e-07
50-150  1.840e-06   2.011e-07
15-150  4.751e-06   2.309e-07
Thermal bremsstrahlung (OTTB)

Spectral model: thermal bremsstrahlung
------------------------------------------------------------
Parameters  : value         Lower 90%    Upper 90%
kT [keV]    : 86.0631       (-11.5476      14.6537)
Norm        : 2.16956       (-0.143345     0.155199)
------------------------------------------------------------
#Fit statistic : Chi-Squared =          60.23 using 59 PHA bins.
# Reduced chi-squared =          1.057 for     57 degrees of freedom
# Null hypothesis probability =   3.596638e-01

Energy  Fluence     90% Error
[keV]   [erg/cm2]   [erg/cm2]
15- 25  1.135e-06   8.032e-08
25- 50  1.900e-06   8.564e-08
50-150  2.814e-06   3.012e-07
15-150  5.849e-06   5.371e-07
Double BB

Spectral model: bbodyrad<1> + bbodyrad<2>
------------------------------------------------------------
Parameters  : value         Lower 90%    Upper 90%
kT1 [keV]   : 9.24100        (-2.16526      1.34305)
R1^2/D10^2  : 0.229869        (-0.0660862      0.172582)
kT2 [keV]   : 24.5951        (-9.14761      34.3291)
R2^2/D10^2  : 3.37056E-03    (-0.00264408   0.0199925)
------------------------------------------------------------
#Fit statistic : Chi-Squared =          46.64 using 59 PHA bins.
# Reduced chi-squared =         0.8479 for     55 degrees of freedom
# Null hypothesis probability =   7.815662e-01

Energy  Fluence     90% Error
[keV]   [erg/cm2]   [erg/cm2]
15- 25  8.493e-07   1.195e-07
25- 50  2.125e-06   3.179e-07
50-150  2.526e-06   9.102e-07
15-150  5.500e-06   1.223e-06
Peak spectrum fit
Power-law model

Time interval is from   38.828 sec. to   39.828 sec.

Spectral model in power-law:
------------------------------------------------------------
Parameters  : value       lower 90%   higher 90%
Photon index: 1.66823     ( -0.299432   0.316979 )
Norm@50keV  : 1.41677E-02    ( -0.00285587   0.00279874 )
------------------------------------------------------------
#Fit statistic : Chi-Squared =          65.63 using 59 PHA bins.
# Reduced chi-squared =          1.151 for     57 degrees of freedom
# Null hypothesis probability =   2.026216e-01

Photon flux (15-150 keV)    in 1 sec: 1.86130 ( -0.35172  0.35208 ) ph/cm2/s
Energy fluence (15-150 keV)             : 1.31553e-07 ( -2.75035e-08  2.77926e-08 ) ergs/cm2
Cutoff power-law model

Time interval is from   38.828 sec. to   39.828 sec.
Spectral model in the cutoff power-law:
------------------------------------------------------------
Parameters  : value       lower 90%   higher 90%
Photon index: 0.912667     ( -1.57242   1.29019 )
Epeak [keV] : 72.6505      ( -46.5543 -72.6503 )
Norm@50keV  : 3.44005E-02    ( -0.0344017   0.165804 )
------------------------------------------------------------
#Fit statistic : Chi-Squared =          64.50 using 59 PHA bins.
# Reduced chi-squared =          1.152 for     56 degrees of freedom
# Null hypothesis probability =   2.036946e-01

Photon flux (15-150 keV)    in 1 sec: 1.82764 ( -0.36021  0.35795 ) ph/cm2/s
Energy fluence (15-150 keV)             : 9.43865e-08 ( -3.1676e-08  2.08075e-08 ) ergs/cm2
Band function

Time interval is from   38.828 sec. to   39.828 sec.


Spectral model in the Band function:
------------------------------------------------------------
Parameters  : value       lower 90%   higher 90%
alpha       :    (     )
beta        :     (     )
Epeak [keV] :       (   )
Norm@50keV   :     (     )
------------------------------------------------------------

Photon flux (15-150 keV)    in  sec:  (    ) ph/cm2/s
Energy fluence (15-150 keV)             : 0 ( 0  0 ) ergs/cm2
Single BB

Spectral model blackbody:
------------------------------------------------------------
Parameters  : value    Lower 90%  Upper 90%
kT [keV]    : 14.7130  (-2.84503  3.49294)
R^2/D10^2   : 0.230715  (-0.124628   0.266214)
(R is the radius in km and D10 is the distance to the source in units of 10 kpc)
------------------------------------------------------------
#Fit statistic : Chi-Squared =          69.58 using 59 PHA bins.
# Reduced chi-squared =          1.221 for     57 degrees of freedom
# Null hypothesis probability =   1.224821e-01

Energy  Fluence     90% Error
[keV]   [erg/cm2]   [erg/cm2]
15- 25  1.049e-08   3.991e-09
25- 50  4.093e-08   1.307e-08
50-150  5.977e-08   2.312e-08
15-150  1.112e-07   3.506e-08
Thermal bremsstrahlung (OTTB)

Spectral model: thermal bremsstrahlung
------------------------------------------------------------
Parameters  : value         Lower 90%    Upper 90%
kT [keV]    : 151.488       (-76.4519      -149.209)
Norm        : 7.75252       (-1.54934     2.07587)
------------------------------------------------------------
#Fit statistic : Chi-Squared =          64.78 using 59 PHA bins.
# Reduced chi-squared =          1.136 for     57 degrees of freedom
# Null hypothesis probability =   2.237244e-01

Energy  Fluence     90% Error
[keV]   [erg/cm2]   [erg/cm2]
15- 25  1.990e-08   1.145e-08
25- 50  3.693e-08   2.074e-08
50-150  7.319e-08   4.436e-08
15-150  1.300e-07   7.615e-08
Double BB

Spectral model: bbodyrad<1> + bbodyrad<2>
------------------------------------------------------------
Parameters  : value         Lower 90%    Upper 90%
kT1 [keV]   : 3.51313        (-1.73257      3.42655)
R1^2/D10^2  : 29.5053        (-27.9774      2073.44)
kT2 [keV]   : 17.7924        (-3.86832      6.05245)
R2^2/D10^2  : 0.104875    (-0.0715777   0.161051)
------------------------------------------------------------
#Fit statistic : Chi-Squared =          62.42 using 59 PHA bins.
# Reduced chi-squared =          1.135 for     55 degrees of freedom
# Null hypothesis probability =   2.292816e-01

Energy  Fluence     90% Error
[keV]   [erg/cm2]   [erg/cm2]
15- 25  2.047e-08   1.203e-08
25- 50  3.397e-08   1.774e-08
50-150  7.009e-08   4.290e-08
15-150  1.245e-07   5.712e-08
Pre-slew spectrum (Pre-slew PHA with pre-slew DRM)
Power-law model

Spectral model in power-law:
------------------------------------------------------------
Parameters  : value       lower 90%   higher 90%
Photon index: 1.74202     ( -0.0724203   0.0731255 )
Norm@50keV  : 6.25821E-03    ( -0.00027474   0.000273893 )
------------------------------------------------------------
#Fit statistic : Chi-Squared =          92.05 using 59 PHA bins.
# Reduced chi-squared =          1.615 for     57 degrees of freedom
# Null hypothesis probability =   2.254798e-03

Photon flux (15-150 keV)    in 99.83 sec: 0.843742 ( -0.0367813  0.0368478 ) ph/cm2/s
Energy fluence (15-150 keV)             : 5.76757e-06 ( -2.61321e-07  2.62262e-07 ) ergs/cm2
Cutoff power-law model

Spectral model in the cutoff power-law:
------------------------------------------------------------
Parameters  : value       lower 90%   higher 90%
Photon index: 0.387002     ( -0.445159   0.404246 )
Epeak [keV] : 56.3565      ( -4.32116 6.02523 )
Norm@50keV  : 3.15649E-02    ( -0.011976   0.0220461 )
------------------------------------------------------------
#Fit statistic : Chi-Squared =          51.87 using 59 PHA bins.
# Reduced chi-squared =         0.9263 for     56 degrees of freedom
# Null hypothesis probability =   6.318452e-01

Photon flux (15-150 keV)    in 99.83 sec: 0.786513 ( -0.03964  0.03976 ) ph/cm2/s
Energy fluence (15-150 keV)             : 5.20437e-06 ( -2.96176e-07  3.00748e-07 ) ergs/cm2
Band function

Spectral model in the Band function:
------------------------------------------------------------
Parameters  : value       lower 90%   higher 90%
alpha       :    (     )
beta        :     (     )
Epeak [keV] :       (   )
Norm@50keV   :     (     )
------------------------------------------------------------

Photon flux (15-150 keV)    in  sec:  (    ) ph/cm2/s
Energy fluence (15-150 keV)             : 0 ( 0  0 ) ergs/cm2
S(25-50 keV) vs. S(50-100 keV) plot

S(25-50 keV)  = 1.77e-06
S(50-100 keV) = 1.95e-06
T90 vs. Hardness ratio plot

T90                                   = 115.007999897003 sec.
Hardness ratio (energy fluence ratio) = 1.10169
Color vs. Color plot

Count Ratio  (25-50 keV) / (15-25 keV) = 1.45881
Count Ratio (50-100 keV) / (15-25 keV) = 0.748845
Mask shadow pattern

IMX = 1.653252734593688E-01, IMY = -6.202629123611765E-01
TIME vs. PHA plot around the trigger time

TIME vs. DetID plot around the trigger time

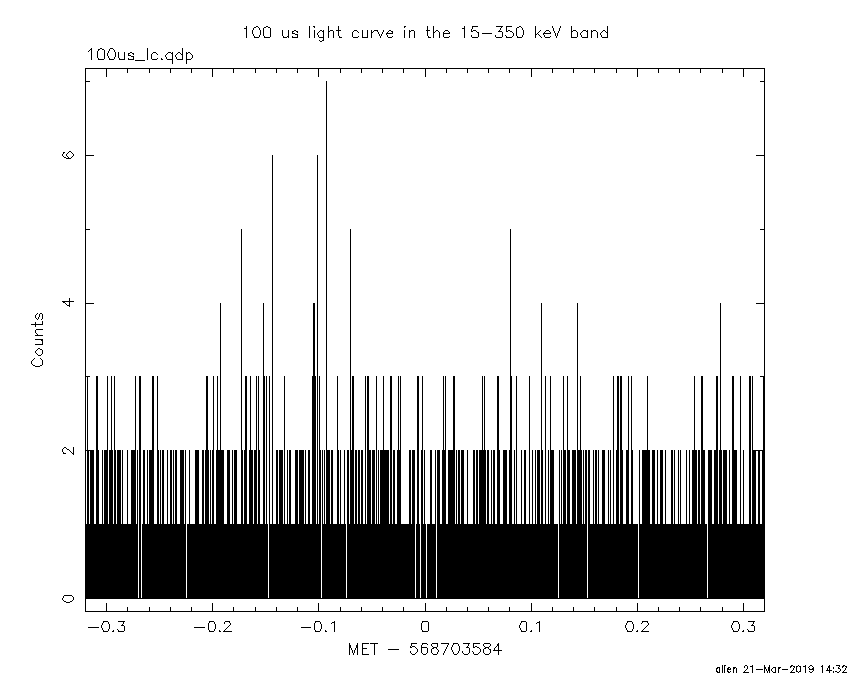
100 us light curve (15-350 keV)
Spacecraft aspect plot

Bright source in the pre-burst/pre-slew/post-slew images
Pre-burst image of 15-350 keV band
Time interval of the image:
-239.000000 5.868000

# RAcent  DECcent POSerr Theta    Phi  PeakCts   SNR AngSep     Name
#  [deg]    [deg]    ['] [deg]  [deg]                   [']
308.0959  40.9137    3.2  49.6  -27.7   2.0539   3.6    2.4	Cyg X-3
326.3993  38.3017    0.0  35.3  -26.3   0.4438   1.4   10.8	Cyg X-2
 30.0973  15.8777    2.4  27.5  119.5   1.5027   4.8 ------	UNKNOWN
 13.4795  36.2126    2.5  19.1   55.8   1.1385   4.6 ------	UNKNOWN
 28.4048 -24.3842    2.7  51.7  173.5   3.1030   4.2 ------	UNKNOWN
327.0795  50.4806    2.7  40.6   -8.4   1.4210   4.2 ------	UNKNOWN
Pre-slew background subtracted image of 15-350 keV band
Time interval of the image:
5.868000 105.700600

# RAcent  DECcent POSerr Theta    Phi  PeakCts   SNR AngSep     Name
#  [deg]    [deg]    ['] [deg]  [deg]                   [']
308.0456  40.8425    6.7  49.6  -27.8  -0.5601  -1.7    7.2	Cyg X-3
326.1583  38.1848    6.6  35.4  -26.6   0.3478   1.7    8.2	Cyg X-2
 33.2144  38.1113    0.4  32.7   75.1   9.7035  29.2 ------	UNKNOWN
345.2162  63.8784    2.1  45.0   15.1   1.6219   5.5 ------	UNKNOWN
 18.5578  18.1042    2.4  16.2  119.7   0.8024   4.8 ------	UNKNOWN
 15.6440 -26.9911    2.4  49.1 -171.5   1.6885   4.8 ------	UNKNOWN
  6.6721 -16.1770    2.1  36.7 -163.1   1.0400   5.4 ------	UNKNOWN
295.2937  50.0896    2.0  59.5  -17.8   5.2771   5.8 ------	UNKNOWN
307.8753  32.8062    3.1  49.1  -38.4   1.6334   3.8 ------	UNKNOWN
310.7987  21.7621    2.3  47.2  -53.4   3.3137   5.0 ------	UNKNOWN
Post-slew image of 15-350 keV band
Time interval of the image:
158.300590 963.082300

# RAcent  DECcent POSerr Theta    Phi  PeakCts   SNR AngSep     Name
#  [deg]    [deg]    ['] [deg]  [deg]                   [']
212.0899  86.0079    4.1  55.9   10.8   8.0669   2.8 ------	UNKNOWN
 40.9445  61.4402    0.4  23.8   19.9  19.1308  30.3 ------	UNKNOWN
357.9866  67.6430    2.8  35.4  -11.5   2.9164   4.1 ------	UNKNOWN
309.9905  72.4478    2.8  51.9  -11.6   5.5958   4.1 ------	UNKNOWN
Plot creation:
Thu Mar 21 14:32:21 EDT 2019