Estimated redshift from machine learning (Ukwatta et al. 2016) - may take a few minute to calcaulte
Image
Pre-slew 15.0-350.0 keV image (Event data)
#   RAcent    DECcent   POSerr    Theta     Phi              Peak Cts       SNR   Name
   65.5427     2.1955   0.0130    23.1849    34.3301         1.4600142     14.794 TRIG_00883600

Foreground time interval of the image:
126.400 185.101 (delta_t =  58.701 [sec])
Background time interval of the image:
-239.000 126.400 (delta_t = 365.400 [sec])
Lightcurves
Notes:
- 1) The mask-weighted light curves are using the flight position.
- 2) Multiple plots of different time binning/intervals are shown to cover all scenarios of short/long GRBs, rate/image triggers, and real/false positives.
- 3) For all the mask-weighted lightcurves, the y-axis units are counts/sec/det where a det is 0.4 x 0.4 = 0.16 sq cm.
- 4) The verticle lines correspond to following: green dotted lines are T50 interval, black dotted lines are T90 interval, blue solid line(s) is a spacecraft slew start time, and orange solid line(s) is a spacecraft slew end time.
- 5) Time of each bin is in the middle of the bin.
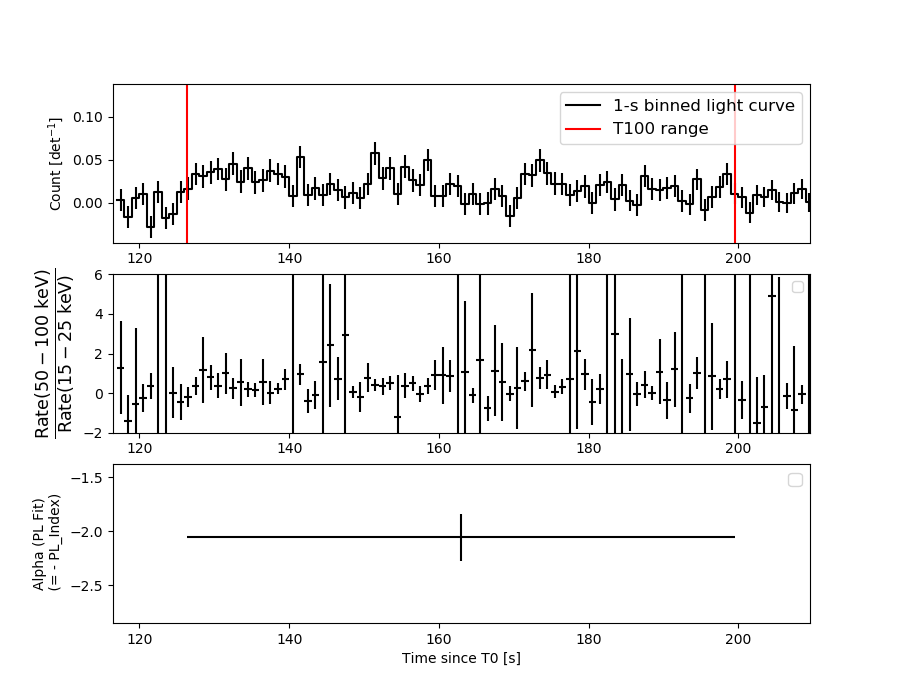
1 s binning
From T0-310 s to T0+310 s

From T100_start - 20 s to T100_end + 30 s

Full time interval

64 ms binning
Full time interval

From T100_start to T100_end

From T0-5 sec to T0+5 sec

16 ms binning
From T100_start-5 s to T100_start+5 s

8 ms binning
From T100_start-3 s to T100_start+3 s

2 ms binning
From T100_start-1 s to T100_start+1 s

SN=5 or 10 sec. binning (whichever binning is satisfied first)

SN=5 or 10 sec. binning (T < 200 sec)
Quad-rate summed light curves (from T0-300s to T0+1000s)

Spectral Evolution
Spectra
Notes:
- 1) The fitting includes the systematic errors.
- 2) When the burst includes telescope slew time periods, the fitting uses an average response file made from multiple 5-s response files through out the slew time plus single time preiod for the non-slew times, and weighted by the total counts in the corresponding time period using addrmf. An average response file is needed becuase a spectral fit using the pre-slew DRM will introduce some errors in both a spectral shape and a normalization if the PHA file contains a lot of the slew/post-slew time interval.
- 3) For fits to more complicated models (e.g. a power-law over a cutoff power-law), the BAT team has decided to require a chi-square improvement of more than 6 for each extra dof.
Time averaged spectrum fit using the average DRM
Power-law model

Time interval is from  126.400 sec. to  199.580 sec.

Spectral model in power-law:
------------------------------------------------------------
Parameters  : value       lower 90%   higher 90%
Photon index: 2.05550     ( -0.210763   0.225798 )
Norm@50keV  : 1.18608E-03    ( -0.000185557   0.000181408 )
------------------------------------------------------------
#Fit statistic : Chi-Squared =          48.29 using 59 PHA bins.
# Reduced chi-squared =         0.8472 for     57 degrees of freedom
# Null hypothesis probability =   7.875519e-01

Photon flux (15-150 keV)    in 73.18 sec: 0.182622 ( -0.020737  0.020738 ) ph/cm2/s
Energy fluence (15-150 keV)             : 8.03472e-07 ( -1.13785e-07  1.1713e-07 ) ergs/cm2
Cutoff power-law model

Time interval is from  126.400 sec. to  199.580 sec.
Spectral model in the cutoff power-law:
------------------------------------------------------------
Parameters  : value       lower 90%   higher 90%
Photon index: 1.38802     ( -0.963758   0.722075 )
Epeak [keV] : 36.5311      ( -30.0131 -36.5311 )
Norm@50keV  : 2.97046E-03    ( -0.00297044   0.00832533 )
------------------------------------------------------------
#Fit statistic : Chi-Squared =          46.23 using 59 PHA bins.
# Reduced chi-squared =         0.8255 for     56 degrees of freedom
# Null hypothesis probability =   8.209707e-01

Photon flux (15-150 keV)    in 73.18 sec: 0.178868 ( -0.021039  0.021116 ) ph/cm2/s
Energy fluence (15-150 keV)             : 7.49173e-07 ( -1.20967e-07  1.3103e-07 ) ergs/cm2
Band function

Time interval is from  126.400 sec. to  199.580 sec.


Spectral model in the Band function:
------------------------------------------------------------
Parameters  : value       lower 90%   higher 90%
alpha       :    (     )
beta        :     (     )
Epeak [keV] :       (   )
Norm@50keV   :     (     )
------------------------------------------------------------

Photon flux (15-150 keV)    in  sec:  (    ) ph/cm2/s
Energy fluence (15-150 keV)             : 0 ( 0  0 ) ergs/cm2
Single BB

Spectral model blackbody:
------------------------------------------------------------
Parameters  : value    Lower 90%  Upper 90%
kT [keV]    : 9.18172  (-1.3373  1.5625)
R^2/D10^2   : 0.116913  (-0.0526449   0.0980127)
(R is the radius in km and D10 is the distance to the source in units of 10 kpc)
------------------------------------------------------------
#Fit statistic : Chi-Squared =          63.06 using 59 PHA bins.
# Reduced chi-squared =          1.106 for     57 degrees of freedom
# Null hypothesis probability =   2.707423e-01

Energy  Fluence     90% Error
[keV]   [erg/cm2]   [erg/cm2]
15- 25  1.418e-07   2.715e-08
25- 50  3.110e-07   4.749e-08
50-150  1.261e-07   4.076e-08
15-150  5.789e-07   1.001e-07
Thermal bremsstrahlung (OTTB)

Spectral model: thermal bremsstrahlung
------------------------------------------------------------
Parameters  : value         Lower 90%    Upper 90%
kT [keV]    : 58.1761       (-16.7879      27.7269)
Norm        : 0.974618       (-0.173538     0.211412)
------------------------------------------------------------
#Fit statistic : Chi-Squared =          46.25 using 59 PHA bins.
# Reduced chi-squared =         0.8114 for     57 degrees of freedom
# Null hypothesis probability =   8.448159e-01

Energy  Fluence     90% Error
[keV]   [erg/cm2]   [erg/cm2]
15- 25  1.783e-07   2.671e-08
25- 50  2.688e-07   3.304e-08
50-150  2.980e-07   1.032e-07
15-150  7.452e-07   1.131e-07
Double BB

Spectral model: bbodyrad<1> + bbodyrad<2>
------------------------------------------------------------
Parameters  : value         Lower 90%    Upper 90%
kT1 [keV]   : 4.85274        (-1.1728      1.41718)
R1^2/D10^2  : 0.961150        (-0.596875      1.73131)
kT2 [keV]   : 16.4401        (-3.78983      6.24325)
R2^2/D10^2  : 9.13591E-03    (-0.00662102   0.017648)
------------------------------------------------------------
#Fit statistic : Chi-Squared =          43.44 using 59 PHA bins.
# Reduced chi-squared =         0.7897 for     55 degrees of freedom
# Null hypothesis probability =   8.699628e-01

Energy  Fluence     90% Error
[keV]   [erg/cm2]   [erg/cm2]
15- 25  1.887e-07   1.019e-07
25- 50  2.517e-07   1.220e-07
50-150  3.082e-07   1.841e-07
15-150  7.486e-07   3.750e-07
Peak spectrum fit
Power-law model

Time interval is from  151.076 sec. to  152.076 sec.

Spectral model in power-law:
------------------------------------------------------------
Parameters  : value       lower 90%   higher 90%
Photon index: 1.50802     ( -0.647681   0.671833 )
Norm@50keV  : 4.34450E-03    ( -0.00155799   0.00146642 )
------------------------------------------------------------
#Fit statistic : Chi-Squared =          39.61 using 59 PHA bins.
# Reduced chi-squared =         0.6950 for     57 degrees of freedom
# Null hypothesis probability =   9.614146e-01

Photon flux (15-150 keV)    in 1 sec: 0.543557 ( -0.179698  0.179947 ) ph/cm2/s
Energy fluence (15-150 keV)             : 4.11652e-08 ( -1.55227e-08  1.59353e-08 ) ergs/cm2
Cutoff power-law model

Time interval is from  151.076 sec. to  152.076 sec.
Spectral model in the cutoff power-law:
------------------------------------------------------------
Parameters  : value       lower 90%   higher 90%
Photon index: 2.20719     ( -0.677248   0.651457 )
Epeak [keV] : 76.3959      ( -9999.36 -9999.36 )
Norm@50keV  : 1.85165E-03    (     )
------------------------------------------------------------
#Fit statistic : Chi-Squared =          39.17 using 59 PHA bins.
# Reduced chi-squared =         0.6994 for     56 degrees of freedom
# Null hypothesis probability =   9.573356e-01

Photon flux (15-150 keV)    in 1 sec: 0.545585 ( -0.184032  0.179953 ) ph/cm2/s
Energy fluence (15-150 keV)             : 2.30877e-08 ( -1.82104e-08  1.21218e-08 ) ergs/cm2
Band function

Time interval is from  151.076 sec. to  152.076 sec.


Spectral model in the Band function:
------------------------------------------------------------
Parameters  : value       lower 90%   higher 90%
alpha       :    (     )
beta        :     (     )
Epeak [keV] :       (   )
Norm@50keV   :     (     )
------------------------------------------------------------

Photon flux (15-150 keV)    in  sec:  (    ) ph/cm2/s
Energy fluence (15-150 keV)             : 0 ( 0  0 ) ergs/cm2
Single BB

Spectral model blackbody:
------------------------------------------------------------
Parameters  : value    Lower 90%  Upper 90%
kT [keV]    : 12.2448  (-5.81166  21.071)
R^2/D10^2   : 0.115653  (-0.110707   1.07228)
(R is the radius in km and D10 is the distance to the source in units of 10 kpc)
------------------------------------------------------------
#Fit statistic : Chi-Squared =          45.34 using 59 PHA bins.
# Reduced chi-squared =         0.7955 for     57 degrees of freedom
# Null hypothesis probability =   8.671657e-01

Energy  Fluence     90% Error
[keV]   [erg/cm2]   [erg/cm2]
15- 25  3.673e-09   2.425e-09
25- 50  1.183e-08   7.355e-09
50-150  1.081e-08   7.745e-09
15-150  2.632e-08   1.661e-08
Thermal bremsstrahlung (OTTB)

Spectral model: thermal bremsstrahlung
------------------------------------------------------------
Parameters  : value         Lower 90%    Upper 90%
kT [keV]    : 199.355       (-199.363      -199.363)
Norm        : 2.20603       (-0.724037     0.724834)
------------------------------------------------------------
#Fit statistic : Chi-Squared =          40.11 using 59 PHA bins.
# Reduced chi-squared =         0.7037 for     57 degrees of freedom
# Null hypothesis probability =   9.561755e-01

Energy  Fluence     90% Error
[keV]   [erg/cm2]   [erg/cm2]
15- 25  5.493e-09   3.338e-09
25- 50  1.057e-08   6.705e-09
50-150  2.318e-08   1.403e-08
15-150  3.924e-08   2.395e-08
Double BB

Spectral model: bbodyrad<1> + bbodyrad<2>
------------------------------------------------------------
Parameters  : value         Lower 90%    Upper 90%
kT1 [keV]   : 6.37522        (-3.23126      5.798)
R1^2/D10^2  : 1.04449        (-0.94556      20.5406)
kT2 [keV]   : 49.0754        (-45.9167      -49.0608)
R2^2/D10^2  : 1.23448E-03    (-0.00111795   0.0241905)
------------------------------------------------------------
#Fit statistic : Chi-Squared =          38.62 using 59 PHA bins.
# Reduced chi-squared =         0.7022 for     55 degrees of freedom
# Null hypothesis probability =   9.540431e-01

Energy  Fluence     90% Error
[keV]   [erg/cm2]   [erg/cm2]
15- 25  6.453e-09   3.923e-09
25- 50  9.318e-09   5.950e-09
50-150  2.924e-08   1.759e-08
15-150  4.501e-08   2.648e-08
Pre-slew spectrum (Pre-slew PHA with pre-slew DRM)
Power-law model

Spectral model in power-law:
------------------------------------------------------------
Parameters  : value       lower 90%   higher 90%
Photon index: 2.00873     ( -0.215293   0.230258 )
Norm@50keV  : 1.31885E-03    ( -0.000207873   0.000202817 )
------------------------------------------------------------
#Fit statistic : Chi-Squared =          45.61 using 59 PHA bins.
# Reduced chi-squared =         0.8001 for     57 degrees of freedom
# Null hypothesis probability =   8.608726e-01

Photon flux (15-150 keV)    in 58.7 sec: 0.198626 ( -0.0232653  0.0232653 ) ph/cm2/s
Energy fluence (15-150 keV)             : 7.14267e-07 ( -1.03854e-07  1.06917e-07 ) ergs/cm2
Cutoff power-law model

Spectral model in the cutoff power-law:
------------------------------------------------------------
Parameters  : value       lower 90%   higher 90%
Photon index: 1.38046     ( -0.985726   0.807268 )
Epeak [keV] : 40.1120      ( -32.4259 -40.112 )
Norm@50keV  : 3.09588E-03    ( -0.00309588   0.00871675 )
------------------------------------------------------------
#Fit statistic : Chi-Squared =          43.88 using 59 PHA bins.
# Reduced chi-squared =         0.7835 for     56 degrees of freedom
# Null hypothesis probability =   8.802578e-01

Photon flux (15-150 keV)    in 58.7 sec: 0.194676 ( -0.023661  0.023728 ) ph/cm2/s
Energy fluence (15-150 keV)             : 6.69867e-07 ( -1.10912e-07  1.19672e-07 ) ergs/cm2
Band function

Spectral model in the Band function:
------------------------------------------------------------
Parameters  : value       lower 90%   higher 90%
alpha       :    (     )
beta        :     (     )
Epeak [keV] :       (   )
Norm@50keV   :     (     )
------------------------------------------------------------

Photon flux (15-150 keV)    in  sec:  (    ) ph/cm2/s
Energy fluence (15-150 keV)             : 0 ( 0  0 ) ergs/cm2
S(25-50 keV) vs. S(50-100 keV) plot

S(25-50 keV)  = 2.46e-07
S(50-100 keV) = 2.36e-07
T90 vs. Hardness ratio plot

T90                                   = 67.095999956131 sec.
Hardness ratio (energy fluence ratio) = 0.95935
Color vs. Color plot

Count Ratio  (25-50 keV) / (15-25 keV) = 0.869759
Count Ratio (50-100 keV) / (15-25 keV) = 0.501162
Mask shadow pattern

IMX = 3.536813571934281E-01, IMY = -2.415373204495026E-01
TIME vs. PHA plot around the trigger time

TIME vs. DetID plot around the trigger time

100 us light curve (15-350 keV)

Spacecraft aspect plot

Bright source in the pre-burst/pre-slew/post-slew images
Pre-burst image of 15-350 keV band
Time interval of the image:
-239.000000 126.400000

# RAcent  DECcent POSerr Theta    Phi  PeakCts   SNR AngSep     Name
#  [deg]    [deg]    ['] [deg]  [deg]                   [']
133.0720 -43.2197    3.0  56.8  173.8   6.6132   3.8 ------	UNKNOWN
 27.8846   1.1571    3.9  46.4  -22.2   1.7659   3.0 ------	UNKNOWN
 30.0919 -45.5934    4.2  40.9  -92.1   4.0189   2.8 ------	UNKNOWN
Pre-slew background subtracted image of 15-350 keV band
Time interval of the image:
126.400000 185.100590

# RAcent  DECcent POSerr Theta    Phi  PeakCts   SNR AngSep     Name
#  [deg]    [deg]    ['] [deg]  [deg]                   [']
 65.5428   2.1955    0.8  23.2   34.3   1.4600  14.8 ------	UNKNOWN
118.6291 -41.6408    2.5  46.1  173.5   1.0018   4.6 ------	UNKNOWN
 34.3262 -11.8391    2.4  35.0  -36.1   0.6544   4.9 ------	UNKNOWN
Post-slew image of 15-350 keV band
Time interval of the image:
235.500600 963.123700

# RAcent  DECcent POSerr Theta    Phi  PeakCts   SNR AngSep     Name
#  [deg]    [deg]    ['] [deg]  [deg]                   [']
 83.6329  22.0204    0.3  26.5   65.9  30.7920  35.9    0.4	Crab
 82.0057 -37.6819    3.2  42.7 -173.6   4.5376   3.6 ------	UNKNOWN
 28.1613  -1.1086    4.2  37.5  -68.9   5.0106   2.7 ------	UNKNOWN
 62.1261 -54.4953    3.2  56.7 -151.9  15.4541   3.6 ------	UNKNOWN
Plot creation:
Thu Mar 21 14:27:49 EDT 2019