Estimated redshift from machine learning (Ukwatta et al. 2016) - may take a few minute to calcaulte
Image
Pre-slew 15.0-350.0 keV image (Event data)
#   RAcent    DECcent   POSerr    Theta     Phi              Peak Cts       SNR   Name
   22.6030    55.7366   0.0057    49.3341    13.2805        20.6319892     33.705 TRIG_00887512

Foreground time interval of the image:
-56.472  37.517 (delta_t =  93.989 [sec])
Background time interval of the image:
-239.784 -56.472 (delta_t = 183.312 [sec])
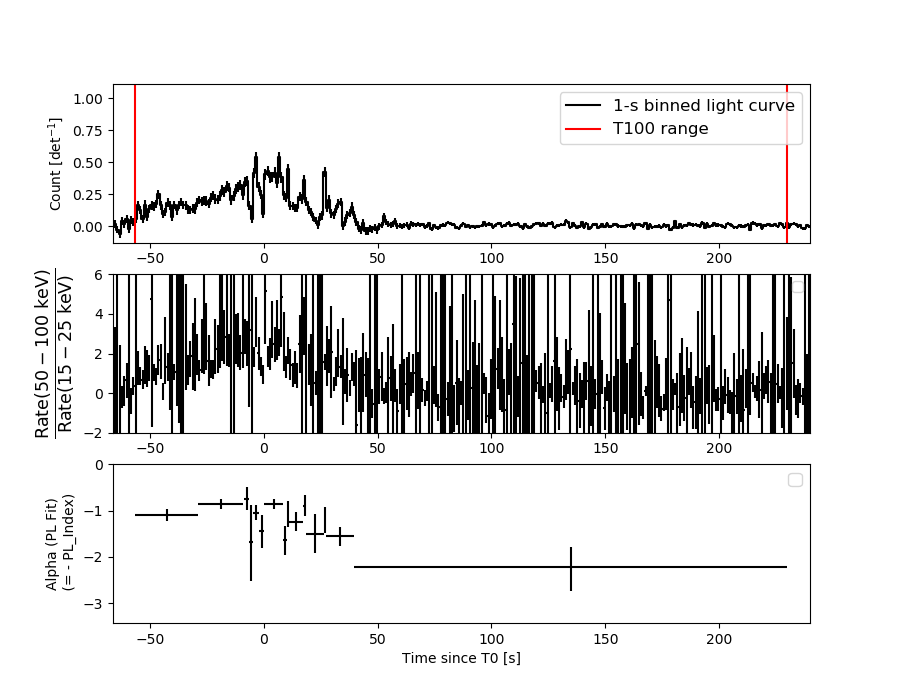
Lightcurves
Notes:
- 1) The mask-weighted light curves are using the flight position.
- 2) Multiple plots of different time binning/intervals are shown to cover all scenarios of short/long GRBs, rate/image triggers, and real/false positives.
- 3) For all the mask-weighted lightcurves, the y-axis units are counts/sec/det where a det is 0.4 x 0.4 = 0.16 sq cm.
- 4) The verticle lines correspond to following: green dotted lines are T50 interval, black dotted lines are T90 interval, blue solid line(s) is a spacecraft slew start time, and orange solid line(s) is a spacecraft slew end time.
- 5) Time of each bin is in the middle of the bin.
1 s binning
From T0-310 s to T0+310 s

From T100_start - 20 s to T100_end + 30 s
Full time interval
64 ms binning
Full time interval

From T100_start to T100_end
From T0-5 sec to T0+5 sec
16 ms binning
From T100_start-5 s to T100_start+5 s

Blue+Cyan dotted lines: Time interval of the scaled map
From 0.000000 to 4.096000
8 ms binning
From T100_start-3 s to T100_start+3 s

Blue+Cyan dotted lines: Time interval of the scaled map
From 0.000000 to 4.096000
2 ms binning
From T100_start-1 s to T100_start+1 s

Blue+Cyan dotted lines: Time interval of the scaled map
From 0.000000 to 4.096000
SN=5 or 10 sec. binning (whichever binning is satisfied first)
SN=5 or 10 sec. binning (T < 200 sec)
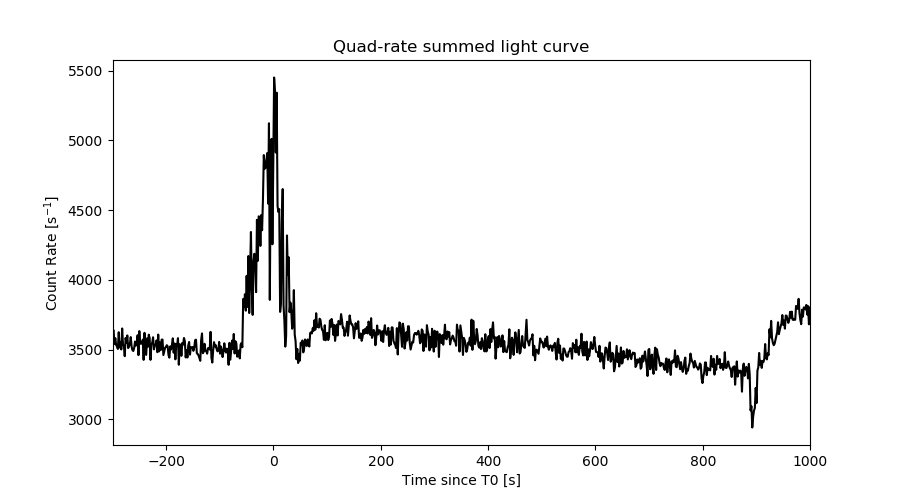
Quad-rate summed light curves (from T0-300s to T0+1000s)
Spectral Evolution
Spectra
Notes:
- 1) The fitting includes the systematic errors.
- 2) When the burst includes telescope slew time periods, the fitting uses an average response file made from multiple 5-s response files through out the slew time plus single time preiod for the non-slew times, and weighted by the total counts in the corresponding time period using addrmf. An average response file is needed becuase a spectral fit using the pre-slew DRM will introduce some errors in both a spectral shape and a normalization if the PHA file contains a lot of the slew/post-slew time interval.
- 3) For fits to more complicated models (e.g. a power-law over a cutoff power-law), the BAT team has decided to require a chi-square improvement of more than 6 for each extra dof.
Time averaged spectrum fit using the average DRM
Power-law model

Time interval is from  -56.472 sec. to  229.960 sec.

Spectral model in power-law:
------------------------------------------------------------
Parameters  : value       lower 90%   higher 90%
Photon index: 1.12509     ( -0.0612853   0.0606083 )
Norm@50keV  : 5.26232E-03    ( -0.000181201   0.000180484 )
------------------------------------------------------------
#Fit statistic : Chi-Squared =          61.15 using 59 PHA bins.
# Reduced chi-squared =          1.073 for     57 degrees of freedom
# Null hypothesis probability =   3.292939e-01

Photon flux (15-150 keV)    in 286.4 sec: 0.611964 ( -0.022606  0.022756 ) ph/cm2/s
Energy fluence (15-150 keV)             : 1.56352e-05 ( -5.19661e-07  5.20048e-07 ) ergs/cm2
Cutoff power-law model
Time interval is from  -56.472 sec. to  229.960 sec.
Spectral model in the cutoff power-law:
------------------------------------------------------------
Parameters  : value       lower 90%   higher 90%
Photon index: 1.12377     ( -0.0676704   0.0580065 )
Epeak [keV] : 9999.36      ( -9999.36 -9999.36 )
Norm@50keV  : 5.28440E-03    ( -0.000172562   0.000646778 )
------------------------------------------------------------
#Fit statistic : Chi-Squared =          61.26 using 59 PHA bins.
# Reduced chi-squared =          1.094 for     56 degrees of freedom
# Null hypothesis probability =   2.929506e-01

Photon flux (15-150 keV)    in 286.4 sec: 0.616790 (    ) ph/cm2/s
Energy fluence (15-150 keV)             : 1.56868e-05 ( -5.74026e-07  4.65864e-07 ) ergs/cm2
Band function

Time interval is from  -56.472 sec. to  229.960 sec.


Spectral model in the Band function:
------------------------------------------------------------
Parameters  : value       lower 90%   higher 90%
alpha       :    (     )
beta        :     (     )
Epeak [keV] :       (   )
Norm@50keV   :     (     )
------------------------------------------------------------

Photon flux (15-150 keV)    in  sec:  (    ) ph/cm2/s
Energy fluence (15-150 keV)             : 0 ( 0  0 ) ergs/cm2
Single BB
Spectral model blackbody:
------------------------------------------------------------
Parameters  : value    Lower 90%  Upper 90%
kT [keV]    : 23.3184  (  )
R^2/D10^2   : 1.71788E-02  (   )
(R is the radius in km and D10 is the distance to the source in units of 10 kpc)
------------------------------------------------------------
#Fit statistic : Chi-Squared =         273.25 using 59 PHA bins.
# Reduced chi-squared =         4.7939 for     57 degrees of freedom
# Null hypothesis probability =   5.360520e-30

Energy  Fluence     90% Error
[keV]   [erg/cm2]   [erg/cm2]
15- 25  4.816e-07   3.451e-08
25- 50  2.633e-06   1.448e-07
50-150  1.069e-05   4.597e-07
15-150  1.380e-05   5.155e-07
Thermal bremsstrahlung (OTTB)
Spectral model: thermal bremsstrahlung
------------------------------------------------------------
Parameters  : value         Lower 90%    Upper 90%
kT [keV]    : 199.363       (      )
Norm        : 2.68136       (     )
------------------------------------------------------------
#Fit statistic : Chi-Squared =         230.83 using 59 PHA bins.
# Reduced chi-squared =         4.0496 for     57 degrees of freedom
# Null hypothesis probability =   8.845222e-23

Energy  Fluence     90% Error
[keV]   [erg/cm2]   [erg/cm2]
15- 25  1.912e-06   7.590e-08
25- 50  3.679e-06   1.432e-07
50-150  8.068e-06   3.007e-07
15-150  1.366e-05   4.912e-07
Double BB
Spectral model: bbodyrad<1> + bbodyrad<2>
------------------------------------------------------------
Parameters  : value         Lower 90%    Upper 90%
kT1 [keV]   : 8.96106        (-1.09826      1.22847)
R1^2/D10^2  : 0.239325        (-0.078906      0.128093)
kT2 [keV]   : 41.5744        (-5.50954      8.67325)
R2^2/D10^2  : 2.43755E-03    (-0.0010169   0.00132939)
------------------------------------------------------------
#Fit statistic : Chi-Squared =          63.19 using 59 PHA bins.
# Reduced chi-squared =          1.149 for     55 degrees of freedom
# Null hypothesis probability =   2.094299e-01

Energy  Fluence     90% Error
[keV]   [erg/cm2]   [erg/cm2]
15- 25  1.221e-06   1.445e-07
25- 50  3.301e-06   2.797e-07
50-150  1.131e-05   1.233e-06
15-150  1.583e-05   1.601e-06
Peak spectrum fit
Power-law model

Time interval is from   -4.084 sec. to   -3.084 sec.

Spectral model in power-law:
------------------------------------------------------------
Parameters  : value       lower 90%   higher 90%
Photon index: 0.933374     ( -0.222595   0.214783 )
Norm@50keV  : 3.86648E-02    ( -0.00519359   0.0051176 )
------------------------------------------------------------
#Fit statistic : Chi-Squared =          38.73 using 59 PHA bins.
# Reduced chi-squared =         0.6794 for     57 degrees of freedom
# Null hypothesis probability =   9.695584e-01

Photon flux (15-150 keV)    in 1 sec: 0.154033 ( -0.01891  0.123661 ) ph/cm2/s
Energy fluence (15-150 keV)             : 4.2847e-07 ( -5.56837e-08  5.57247e-08 ) ergs/cm2
Cutoff power-law model
Time interval is from   -4.084 sec. to   -3.084 sec.
Spectral model in the cutoff power-law:
------------------------------------------------------------
Parameters  : value       lower 90%   higher 90%
Photon index: 0.629182     ( -0.947092   0.488396 )
Epeak [keV] : 291.553      ( -291.553 -291.553 )
Norm@50keV  : 5.10521E-02    ( -0.0167197   0.0635603 )
------------------------------------------------------------
#Fit statistic : Chi-Squared =          38.32 using 59 PHA bins.
# Reduced chi-squared =         0.6843 for     56 degrees of freedom
# Null hypothesis probability =   9.658834e-01

Photon flux (15-150 keV)    in 1 sec: 0.328211 ( -0.328211  -0.302782 ) ph/cm2/s
Energy fluence (15-150 keV)             : 4.28046e-07 ( -5.63225e-08  5.6171e-08 ) ergs/cm2
Band function

Time interval is from   -4.084 sec. to   -3.084 sec.


Spectral model in the Band function:
------------------------------------------------------------
Parameters  : value       lower 90%   higher 90%
alpha       :    (     )
beta        :     (     )
Epeak [keV] :       (   )
Norm@50keV   :     (     )
------------------------------------------------------------

Photon flux (15-150 keV)    in  sec:  (    ) ph/cm2/s
Energy fluence (15-150 keV)             : 0 ( 0  0 ) ergs/cm2
Single BB
Spectral model blackbody:
------------------------------------------------------------
Parameters  : value    Lower 90%  Upper 90%
kT [keV]    : 26.4958  (-4.30404  5.45048)
R^2/D10^2   : 9.31122E-02  (-0.0401389   0.0674168)
(R is the radius in km and D10 is the distance to the source in units of 10 kpc)
------------------------------------------------------------
#Fit statistic : Chi-Squared =          47.52 using 59 PHA bins.
# Reduced chi-squared =         0.8337 for     57 degrees of freedom
# Null hypothesis probability =   8.102972e-01

Energy  Fluence     90% Error
[keV]   [erg/cm2]   [erg/cm2]
15- 25  1.100e-08   3.036e-09
25- 50  6.423e-08   1.426e-08
50-150  3.308e-07   6.685e-08
15-150  4.061e-07   7.010e-08
Thermal bremsstrahlung (OTTB)

Spectral model: thermal bremsstrahlung
------------------------------------------------------------
Parameters  : value         Lower 90%    Upper 90%
kT [keV]    : 200.000       (-25.3201      -200)
Norm        : 18.5430       (-2.48867     2.48867)
------------------------------------------------------------
#Fit statistic : Chi-Squared =          61.64 using 59 PHA bins.
# Reduced chi-squared =          1.081 for     57 degrees of freedom
# Null hypothesis probability =   3.136050e-01

Energy  Fluence     90% Error
[keV]   [erg/cm2]   [erg/cm2]
15- 25  4.619e-08   2.625e-08
25- 50  8.885e-08   4.979e-08
50-150  1.949e-07   1.098e-07
15-150  3.299e-07   1.798e-07
Double BB
Spectral model: bbodyrad<1> + bbodyrad<2>
------------------------------------------------------------
Parameters  : value         Lower 90%    Upper 90%
kT1 [keV]   : 8.78996        (-3.87746      6.21073)
R1^2/D10^2  : 1.38574        (-1.081      8.85248)
kT2 [keV]   : 37.5702        (-9.793      40.6139)
R2^2/D10^2  : 2.82605E-02    (-0.0236314   0.060935)
------------------------------------------------------------
#Fit statistic : Chi-Squared =          37.60 using 59 PHA bins.
# Reduced chi-squared =         0.6836 for     55 degrees of freedom
# Null hypothesis probability =   9.648995e-01

Energy  Fluence     90% Error
[keV]   [erg/cm2]   [erg/cm2]
15- 25  2.596e-08   1.505e-08
25- 50  7.815e-08   4.134e-08
50-150  3.328e-07   1.812e-07
15-150  4.369e-07   2.286e-07
Pre-slew spectrum (Pre-slew PHA with pre-slew DRM)
Power-law model

Spectral model in power-law:
------------------------------------------------------------
Parameters  : value       lower 90%   higher 90%
Photon index: 1.04458     ( -0.0563744   0.0557191 )
Norm@50keV  : 1.48877E-02    ( -0.000486669   0.000484387 )
------------------------------------------------------------
#Fit statistic : Chi-Squared =          64.09 using 59 PHA bins.
# Reduced chi-squared =          1.124 for     57 degrees of freedom
# Null hypothesis probability =   2.418475e-01

Photon flux (15-150 keV)    in 93.99 sec: 1.71878 ( -0.0589824  0.0592812 ) ph/cm2/s
Energy fluence (15-150 keV)             : 1.48991e-05 ( -4.57172e-07  4.57467e-07 ) ergs/cm2
Cutoff power-law model

Spectral model in the cutoff power-law:
------------------------------------------------------------
Parameters  : value       lower 90%   higher 90%
Photon index: 1.03922     ( -0.0572973   0.0556746 )
Epeak [keV] : 9999.36      ( -9999.36 -9999.36 )
Norm@50keV  : 1.49745E-02    ( -0.000460397   0.00310838 )
------------------------------------------------------------
#Fit statistic : Chi-Squared =          64.10 using 59 PHA bins.
# Reduced chi-squared =          1.145 for     56 degrees of freedom
# Null hypothesis probability =   2.137773e-01

Photon flux (15-150 keV)    in 93.99 sec: 1.71860 ( -0.0574  0.05867 ) ph/cm2/s
Energy fluence (15-150 keV)             : 1.49048e-05 ( -4.52092e-07  4.48144e-07 ) ergs/cm2
Band function
Spectral model in the Band function:
------------------------------------------------------------
Parameters  : value       lower 90%   higher 90%
alpha       :    (     )
beta        :     (     )
Epeak [keV] :       (   )
Norm@50keV   :     (     )
------------------------------------------------------------

Photon flux (15-150 keV)    in  sec:  (    ) ph/cm2/s
Energy fluence (15-150 keV)             : 0 ( 0  0 ) ergs/cm2
S(25-50 keV) vs. S(50-100 keV) plot
S(25-50 keV)  = 3.15e-06
S(50-100 keV) = 5.76e-06
T90 vs. Hardness ratio plot
T90                                   = 86.5600000619888 sec.
Hardness ratio (energy fluence ratio) = 1.82857
Color vs. Color plot

Count Ratio  (25-50 keV) / (15-25 keV) = 1.69375
Count Ratio (50-100 keV) / (15-25 keV) = 1.84549
Mask shadow pattern

IMX = 1.132877569568501E+00, IMY = -2.673935363469832E-01
TIME vs. PHA plot around the trigger time
Blue+Cyan dotted lines: Time interval of the scaled map
From 0.000000 to 4.096000
TIME vs. DetID plot around the trigger time
Blue+Cyan dotted lines: Time interval of the scaled map
From 0.000000 to 4.096000
100 us light curve (15-350 keV)
Blue+Cyan dotted lines: Time interval of the scaled map
From 0.000000 to 4.096000
Spacecraft aspect plot

Bright source in the pre-burst/pre-slew/post-slew images
Pre-burst image of 15-350 keV band
Time interval of the image:
-239.784000 -56.472000

# RAcent  DECcent POSerr Theta    Phi  PeakCts   SNR AngSep     Name
#  [deg]    [deg]    ['] [deg]  [deg]                   [']
 50.1428 -43.0455    2.0  53.3  178.6   4.0746   5.7 ------	UNKNOWN
  7.3223  52.8801    2.7  49.5    1.0   1.7468   4.3 ------	UNKNOWN
355.7140  57.3966    3.0  56.9   -2.7   3.1758   3.9 ------	UNKNOWN
Pre-slew background subtracted image of 15-350 keV band
Time interval of the image:
-56.472000 37.516600

# RAcent  DECcent POSerr Theta    Phi  PeakCts   SNR AngSep     Name
#  [deg]    [deg]    ['] [deg]  [deg]                   [']
 68.1471 -24.8741    2.1  49.6  148.9   3.6639   5.5 ------	UNKNOWN
 22.6030  55.7366    0.3  49.3   13.3  20.6319  33.7 ------	UNKNOWN
 33.5522 -51.1261    3.3  57.9 -165.6   3.3548   3.5 ------	UNKNOWN
356.1493 -23.4141    2.4  43.8 -116.4   3.5158   4.8 ------	UNKNOWN
Post-slew image of 15-350 keV band
Time interval of the image:
102.316600 712.876400
720.216000 789.916600

# RAcent  DECcent POSerr Theta    Phi  PeakCts   SNR AngSep     Name
#  [deg]    [deg]    ['] [deg]  [deg]                   [']
307.9163  41.0438   19.7  49.1  -44.9   1.7023   0.6   10.3	Cyg X-3
326.2783  38.3676    9.1  40.7  -61.5   2.1520   1.3    5.7	Cyg X-2
 84.3187  43.0823    3.0  40.6  110.6   8.0812   3.9 ------	UNKNOWN
 40.8925  61.4093    1.2  11.1   81.0   4.7926   9.4 ------	UNKNOWN
 43.8656  17.7400    2.5  41.3  177.7   4.2723   4.6 ------	UNKNOWN
 35.2654   1.8026    3.2  54.9 -166.3   6.4061   3.6 ------	UNKNOWN
335.6743  32.1729    3.3  40.0  -76.7   6.8556   3.5 ------	UNKNOWN
344.2517  25.7622    4.8  40.8  -91.9   6.4061   2.4 ------	UNKNOWN
  6.5231   9.3798    2.7  48.0 -129.2  11.2839   4.2 ------	UNKNOWN
Plot creation:
Thu Mar 21 16:37:01 EDT 2019