Special notes of this burst
Image
Pre-slew 15.0-350.0 keV image (Event data)

#   RAcent    DECcent   POSerr    Theta     Phi              Peak Cts       SNR   Name
  351.4909    54.8841   0.0033    31.2759   145.8693        16.4541058     57.649 TRIG_00887579

Foreground time interval of the image:
 -6.520   9.997 (delta_t =  16.517 [sec])
Background time interval of the image:
-234.104  -6.520 (delta_t = 227.584 [sec])
Lightcurves
Notes:
- 1) The mask-weighted light curves are using the flight position.
- 2) Multiple plots of different time binning/intervals are shown to cover all scenarios of short/long GRBs, rate/image triggers, and real/false positives.
- 3) For all the mask-weighted lightcurves, the y-axis units are counts/sec/det where a det is 0.4 x 0.4 = 0.16 sq cm.
- 4) The verticle lines correspond to following: green dotted lines are T50 interval, black dotted lines are T90 interval, blue solid line(s) is a spacecraft slew start time, and orange solid line(s) is a spacecraft slew end time.
- 5) Time of each bin is in the middle of the bin.
1 s binning
From T0-310 s to T0+310 s
From T100_start - 20 s to T100_end + 30 s
Full time interval

64 ms binning
Full time interval

From T100_start to T100_end

From T0-5 sec to T0+5 sec

16 ms binning
From T100_start-5 s to T100_start+5 s
8 ms binning
From T100_start-3 s to T100_start+3 s
2 ms binning
From T100_start-1 s to T100_start+1 s
SN=5 or 10 sec. binning (whichever binning is satisfied first)

SN=5 or 10 sec. binning (T < 200 sec)

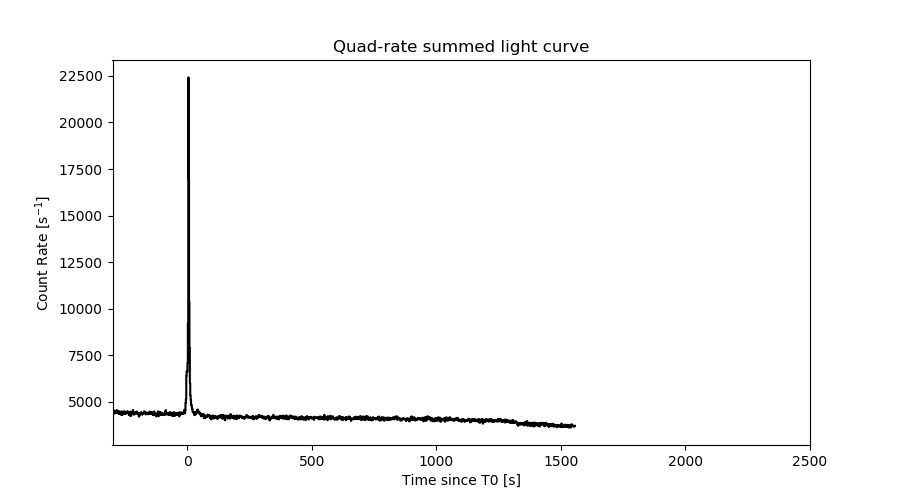
Quad-rate summed light curves (from T0-300s to T0+1000s)
Spectral Evolution

Spectra
Notes:
- 1) The fitting includes the systematic errors.
- 2) When the burst includes telescope slew time periods, the fitting uses an average response file made from multiple 5-s response files through out the slew time plus single time preiod for the non-slew times, and weighted by the total counts in the corresponding time period using addrmf. An average response file is needed becuase a spectral fit using the pre-slew DRM will introduce some errors in both a spectral shape and a normalization if the PHA file contains a lot of the slew/post-slew time interval.
- 3) For fits to more complicated models (e.g. a power-law over a cutoff power-law), the BAT team has decided to require a chi-square improvement of more than 6 for each extra dof.
Time averaged spectrum fit using the average DRM
Power-law model
Time interval is from   -6.520 sec. to   54.128 sec.

Spectral model in power-law:
------------------------------------------------------------
Parameters  : value       lower 90%   higher 90%
Photon index: 1.28654     ( -0.0382842   0.0381907 )
Norm@50keV  : 2.07190E-02    ( -0.000419367   0.000418838 )
------------------------------------------------------------
#Fit statistic : Chi-Squared =          48.72 using 59 PHA bins.
# Reduced chi-squared =         0.8547 for     57 degrees of freedom
# Null hypothesis probability =   7.744700e-01

Photon flux (15-150 keV)    in 60.65 sec: 2.46583 ( -0.05557  0.05573 ) ph/cm2/s
Energy fluence (15-150 keV)             : 1.24604e-05 ( -2.56681e-07  2.56819e-07 ) ergs/cm2
Cutoff power-law model
Time interval is from   -6.520 sec. to   54.128 sec.
Spectral model in the cutoff power-law:
------------------------------------------------------------
Parameters  : value       lower 90%   higher 90%
Photon index: 1.16630     ( -0.155335   0.123463 )
Epeak [keV] : 414.106      ( -197.924 -414.106 )
Norm@50keV  : 2.32831E-02    ( -0.0027235   0.00368067 )
------------------------------------------------------------
#Fit statistic : Chi-Squared =          46.87 using 59 PHA bins.
# Reduced chi-squared =         0.8370 for     56 degrees of freedom
# Null hypothesis probability =   8.024540e-01

Photon flux (15-150 keV)    in 60.65 sec: 2.44312 ( -0.06176  0.06203 ) ph/cm2/s
Energy fluence (15-150 keV)             : 1.23849e-05 ( -2.73829e-07  2.73315e-07 ) ergs/cm2
Band function

Time interval is from   -6.520 sec. to   54.128 sec.


Spectral model in the Band function:
------------------------------------------------------------
Parameters  : value       lower 90%   higher 90%
alpha       :    (     )
beta        :     (     )
Epeak [keV] :       (   )
Norm@50keV   :     (     )
------------------------------------------------------------

Photon flux (15-150 keV)    in  sec:  (    ) ph/cm2/s
Energy fluence (15-150 keV)             : 0 ( 0  0 ) ergs/cm2
Single BB
Spectral model blackbody:
------------------------------------------------------------
Parameters  : value    Lower 90%  Upper 90%
kT [keV]    : 20.1413  (  )
R^2/D10^2   : 0.105144  (   )
(R is the radius in km and D10 is the distance to the source in units of 10 kpc)
------------------------------------------------------------
#Fit statistic : Chi-Squared =         502.90 using 59 PHA bins.
# Reduced chi-squared =         8.8228 for     57 degrees of freedom
# Null hypothesis probability =   1.261256e-72

Energy  Fluence     90% Error
[keV]   [erg/cm2]   [erg/cm2]
15- 25  4.973e-07   2.208e-08
25- 50  2.489e-06   8.461e-08
50-150  7.491e-06   2.214e-07
15-150  1.048e-05   2.547e-07
Thermal bremsstrahlung (OTTB)
Spectral model: thermal bremsstrahlung
------------------------------------------------------------
Parameters  : value         Lower 90%    Upper 90%
kT [keV]    : 199.363       (      )
Norm        : 10.5731       (     )
------------------------------------------------------------
#Fit statistic : Chi-Squared =         226.87 using 59 PHA bins.
# Reduced chi-squared =         3.9803 for     57 degrees of freedom
# Null hypothesis probability =   3.989641e-22

Energy  Fluence     90% Error
[keV]   [erg/cm2]   [erg/cm2]
15- 25  1.597e-06   3.487e-08
25- 50  3.072e-06   6.975e-08
50-150  6.737e-06   1.456e-07
15-150  1.141e-05   2.547e-07
Double BB

Spectral model: bbodyrad<1> + bbodyrad<2>
------------------------------------------------------------
Parameters  : value         Lower 90%    Upper 90%
kT1 [keV]   : 8.46404        (-0.729935      0.7736)
R1^2/D10^2  : 1.13901        (-0.275531      0.396118)
kT2 [keV]   : 33.3740        (-2.6306      3.3609)
R2^2/D10^2  : 1.65368E-02    (-0.00450017   0.00534468)
------------------------------------------------------------
#Fit statistic : Chi-Squared =          56.11 using 59 PHA bins.
# Reduced chi-squared =          1.020 for     55 degrees of freedom
# Null hypothesis probability =   4.329504e-01

Energy  Fluence     90% Error
[keV]   [erg/cm2]   [erg/cm2]
15- 25  1.094e-06   8.946e-08
25- 50  2.841e-06   1.186e-07
50-150  8.426e-06   4.458e-07
15-150  1.236e-05   4.458e-07
Peak spectrum fit
Power-law model
Time interval is from    4.864 sec. to    5.864 sec.

Spectral model in power-law:
------------------------------------------------------------
Parameters  : value       lower 90%   higher 90%
Photon index: 1.10251     ( -0.0504505   0.0503219 )
Norm@50keV  : 0.259034    ( -0.00741892   0.00741594 )
------------------------------------------------------------
#Fit statistic : Chi-Squared =          63.37 using 59 PHA bins.
# Reduced chi-squared =          1.112 for     57 degrees of freedom
# Null hypothesis probability =   2.619619e-01

Photon flux (15-150 keV)    in 1 sec: 1.16024 (    ) ph/cm2/s
Energy fluence (15-150 keV)             : 2.70639e-06 ( -8.41647e-08  8.42897e-08 ) ergs/cm2
Cutoff power-law model
Time interval is from    4.864 sec. to    5.864 sec.
Spectral model in the cutoff power-law:
------------------------------------------------------------
Parameters  : value       lower 90%   higher 90%
Photon index: 0.758025     ( -0.210817   0.201403 )
Epeak [keV] : 210.390      ( -57.869 199.937 )
Norm@50keV  : 0.366799    ( -0.0659268   0.0842303 )
------------------------------------------------------------
#Fit statistic : Chi-Squared =          54.58 using 59 PHA bins.
# Reduced chi-squared =         0.9747 for     56 degrees of freedom
# Null hypothesis probability =   5.287088e-01

Photon flux (15-150 keV)    in 1 sec: 29.5863 ( -0.9258  0.9269 ) ph/cm2/s
Energy fluence (15-150 keV)             : 2.66876e-06 ( -8.83424e-08  8.80701e-08 ) ergs/cm2
Band function

Time interval is from    4.864 sec. to    5.864 sec.


Spectral model in the Band function:
------------------------------------------------------------
Parameters  : value       lower 90%   higher 90%
alpha       :    (     )
beta        :     (     )
Epeak [keV] :       (   )
Norm@50keV   :     (     )
------------------------------------------------------------

Photon flux (15-150 keV)    in  sec:  (    ) ph/cm2/s
Energy fluence (15-150 keV)             : 0 ( 0  0 ) ergs/cm2
Single BB
Spectral model blackbody:
------------------------------------------------------------
Parameters  : value    Lower 90%  Upper 90%
kT [keV]    : 21.0208  (  )
R^2/D10^2   : 1.21838  (   )
(R is the radius in km and D10 is the distance to the source in units of 10 kpc)
------------------------------------------------------------
#Fit statistic : Chi-Squared =         239.90 using 59 PHA bins.
# Reduced chi-squared =         4.2088 for     57 degrees of freedom
# Null hypothesis probability =   2.701086e-24

Energy  Fluence     90% Error
[keV]   [erg/cm2]   [erg/cm2]
15- 25  1.017e-07   6.170e-09
25- 50  5.229e-07   2.225e-08
50-150  1.722e-06   7.550e-08
15-150  2.347e-06   7.900e-08
Thermal bremsstrahlung (OTTB)
Spectral model: thermal bremsstrahlung
------------------------------------------------------------
Parameters  : value         Lower 90%    Upper 90%
kT [keV]    : 199.363       (      )
Norm        : 124.462       (     )
------------------------------------------------------------
#Fit statistic : Chi-Squared =         279.05 using 59 PHA bins.
# Reduced chi-squared =         4.8956 for     57 degrees of freedom
# Null hypothesis probability =   5.235570e-31

Energy  Fluence     90% Error
[keV]   [erg/cm2]   [erg/cm2]
15- 25  3.099e-07   9.800e-09
25- 50  5.962e-07   1.945e-08
50-150  1.307e-06   4.150e-08
15-150  2.214e-06   6.550e-08
Double BB
Spectral model: bbodyrad<1> + bbodyrad<2>
------------------------------------------------------------
Parameters  : value         Lower 90%    Upper 90%
kT1 [keV]   : 8.66943        (-1.1297      1.2565)
R1^2/D10^2  : 10.9107        (-3.4899      5.79171)
kT2 [keV]   : 33.2577        (-3.39425      4.8335)
R2^2/D10^2  : 0.235626    (-0.0852677   0.10431)
------------------------------------------------------------
#Fit statistic : Chi-Squared =          54.55 using 59 PHA bins.
# Reduced chi-squared =         0.9919 for     55 degrees of freedom
# Null hypothesis probability =   4.916736e-01

Energy  Fluence     90% Error
[keV]   [erg/cm2]   [erg/cm2]
15- 25  1.946e-07   2.120e-08
25- 50  5.584e-07   4.470e-08
50-150  1.933e-06   1.685e-07
15-150  2.686e-06   2.010e-07
Pre-slew spectrum (Pre-slew PHA with pre-slew DRM)
Power-law model

Spectral model in power-law:
------------------------------------------------------------
Parameters  : value       lower 90%   higher 90%
Photon index: 1.21971     ( -0.0350456   0.0349571 )
Norm@50keV  : 6.51314E-02    ( -0.00123544   0.00123411 )
------------------------------------------------------------
#Fit statistic : Chi-Squared =          46.25 using 59 PHA bins.
# Reduced chi-squared =         0.8114 for     57 degrees of freedom
# Null hypothesis probability =   8.449350e-01

Photon flux (15-150 keV)    in 16.52 sec: 7.66698 ( -0.159452  0.159841 ) ph/cm2/s
Energy fluence (15-150 keV)             : 1.08564e-05 ( -2.07531e-07  2.07584e-07 ) ergs/cm2
Cutoff power-law model

Spectral model in the cutoff power-law:
------------------------------------------------------------
Parameters  : value       lower 90%   higher 90%
Photon index: 1.06057     ( -0.142904   0.138453 )
Epeak [keV] : 360.963      ( -140.387 1607.57 )
Norm@50keV  : 7.57541E-02    ( -0.00812721   0.010713 )
------------------------------------------------------------
#Fit statistic : Chi-Squared =          42.41 using 59 PHA bins.
# Reduced chi-squared =         0.7573 for     56 degrees of freedom
# Null hypothesis probability =   9.100842e-01

Photon flux (15-150 keV)    in 16.52 sec: 7.57871 ( -0.17473  0.17586 ) ph/cm2/s
Energy fluence (15-150 keV)             : 1.07912e-05 ( -2.17519e-07  2.17007e-07 ) ergs/cm2
Band function

Spectral model in the Band function:
------------------------------------------------------------
Parameters  : value       lower 90%   higher 90%
alpha       :    (     )
beta        :     (     )
Epeak [keV] :       (   )
Norm@50keV   :     (     )
------------------------------------------------------------

Photon flux (15-150 keV)    in  sec:  (    ) ph/cm2/s
Energy fluence (15-150 keV)             : 0 ( 0  0 ) ergs/cm2
S(25-50 keV) vs. S(50-100 keV) plot
S(25-50 keV)  = 2.75e-06
S(50-100 keV) = 4.51e-06
T90 vs. Hardness ratio plot
T90                                   = 26.3239998817444 sec.
Hardness ratio (energy fluence ratio) = 1.64
Color vs. Color plot

Count Ratio  (25-50 keV) / (15-25 keV) = 1.54365
Count Ratio (50-100 keV) / (15-25 keV) = 1.40173
Mask shadow pattern

IMX = -5.028088987541257E-01, IMY = -3.408205251257561E-01
TIME vs. PHA plot around the trigger time

TIME vs. DetID plot around the trigger time
100 us light curve (15-350 keV)
Spacecraft aspect plot
Bright source in the pre-burst/pre-slew/post-slew images
Pre-burst image of 15-350 keV band
Time interval of the image:
-234.104000 -6.520000

# RAcent  DECcent POSerr Theta    Phi  PeakCts   SNR AngSep     Name
#  [deg]    [deg]    ['] [deg]  [deg]                   [']
254.4106  35.3527    3.6  41.8   16.0   1.6293   3.2    2.4	Her X-1
268.1581  -1.3831    5.7  56.0  -33.1   3.1148   2.1   13.3	SW J1753.5-0127
288.8638  10.9812    3.2  34.8  -49.4   1.4901   3.6    4.4	GRS 1915+105
299.5850  35.2042    0.4   9.1  -34.5   8.6133  31.7    0.3	Cyg X-1
308.1571  40.9966    3.6   0.5  -93.7   0.7975   3.2    3.4	Cyg X-3
326.2146  38.4649    8.8  14.2 -167.5   0.3430   1.3    8.8	Cyg X-2
 14.6638  44.4317    2.5  47.5  159.0   3.5478   4.6 ------	UNKNOWN
301.0053  61.2830    2.4  20.3   86.4   1.4215   4.7 ------	UNKNOWN
248.4909  25.9489    2.7  50.9    8.2   2.9938   4.3 ------	UNKNOWN
256.9440   8.8691    3.0  55.5  -14.8   3.2303   3.9 ------	UNKNOWN
Pre-slew background subtracted image of 15-350 keV band
Time interval of the image:
-6.520000 9.996600

# RAcent  DECcent POSerr Theta    Phi  PeakCts   SNR AngSep     Name
#  [deg]    [deg]    ['] [deg]  [deg]                   [']
254.3173  35.2856    5.6  41.9   16.0  -0.6687  -2.1    7.7	Her X-1
268.4692  -1.5526    9.8  56.0  -33.6  -0.8675  -1.2    8.5	SW J1753.5-0127
288.6743  10.8856    5.4  35.0  -49.2   0.5496   2.1    8.1	GRS 1915+105
299.7406  35.3449    8.8   8.9  -34.4   0.2561   1.3   11.3	Cyg X-1
308.1783  40.8873   19.4   0.6  -93.4   0.0987   0.6    5.0	Cyg X-3
326.2712  38.3710   22.8  14.3 -167.2   0.0894   0.5    5.5	Cyg X-2
351.4909  54.8841    0.2  31.3  145.9  16.4544  57.7 ------	UNKNOWN
274.9067  16.4047    2.6  37.9  -25.2   1.0653   4.5 ------	UNKNOWN
  3.9349  10.7277    2.9  57.6 -158.3   4.3618   3.9 ------	UNKNOWN
313.5476   1.0216    3.0  40.8  -92.2   2.3834   3.8 ------	UNKNOWN
Post-slew image of 15-350 keV band
Time interval of the image:
63.596600 967.930200

# RAcent  DECcent POSerr Theta    Phi  PeakCts   SNR AngSep     Name
#  [deg]    [deg]    ['] [deg]  [deg]                   [']
299.5597  35.2211    0.5  40.4  -40.3  31.6099  24.2    1.9	Cyg X-1
307.9164  41.0173   14.3  31.7  -40.8   0.8283   0.8    9.6	Cyg X-3
326.1593  38.2916   26.1  23.8  -66.9  -0.4520  -0.4    1.9	Cyg X-2
 63.2936  52.8501    3.6  40.5  118.8  10.3647   3.3 ------	UNKNOWN
 54.3426  33.8826    3.7  47.6  145.9   8.0863   3.1 ------	UNKNOWN
 40.8338  61.4015    1.7  26.2  112.2   7.4540   6.9 ------	UNKNOWN
 40.3918  50.4065    3.0  29.4  135.0   4.3387   3.8 ------	UNKNOWN
264.4833  51.0857    2.5  49.1    0.6   6.8167   4.7 ------	UNKNOWN
258.3714  44.1072    3.0  56.9   -2.1  11.0559   3.8 ------	UNKNOWN
291.0153  48.8435    2.9  36.6  -16.9   3.9289   4.0 ------	UNKNOWN
299.5635  24.5765    2.8  48.5  -50.2  15.9047   4.1 ------	UNKNOWN
Plot creation:
Thu Mar 21 16:35:36 EDT 2019