Estimated redshift from machine learning (Ukwatta et al. 2016) - may take a few minute to calcaulte
Image
Pre-slew 15.0-350.0 keV image (Event data)
#   RAcent    DECcent   POSerr    Theta     Phi              Peak Cts       SNR   Name
  189.6895    76.6071   0.0127    26.9185  -142.9218         3.9692595     15.110 TRIG_00889748

Foreground time interval of the image:
-105.740  35.653 (delta_t = 141.393 [sec])
Background time interval of the image:
-239.448 -105.740 (delta_t = 133.708 [sec])
Lightcurves
Notes:
- 1) The mask-weighted light curves are using the flight position.
- 2) Multiple plots of different time binning/intervals are shown to cover all scenarios of short/long GRBs, rate/image triggers, and real/false positives.
- 3) For all the mask-weighted lightcurves, the y-axis units are counts/sec/det where a det is 0.4 x 0.4 = 0.16 sq cm.
- 4) The verticle lines correspond to following: green dotted lines are T50 interval, black dotted lines are T90 interval, blue solid line(s) is a spacecraft slew start time, and orange solid line(s) is a spacecraft slew end time.
- 5) Time of each bin is in the middle of the bin.
1 s binning
From T0-310 s to T0+310 s
From T100_start - 20 s to T100_end + 30 s

Full time interval

64 ms binning
Full time interval
From T100_start to T100_end

From T0-5 sec to T0+5 sec
16 ms binning
From T100_start-5 s to T100_start+5 s
Blue+Cyan dotted lines: Time interval of the scaled map
From 0.000000 to 4.096000
8 ms binning
From T100_start-3 s to T100_start+3 s

Blue+Cyan dotted lines: Time interval of the scaled map
From 0.000000 to 4.096000
2 ms binning
From T100_start-1 s to T100_start+1 s
Blue+Cyan dotted lines: Time interval of the scaled map
From 0.000000 to 4.096000
SN=5 or 10 sec. binning (whichever binning is satisfied first)

SN=5 or 10 sec. binning (T < 200 sec)

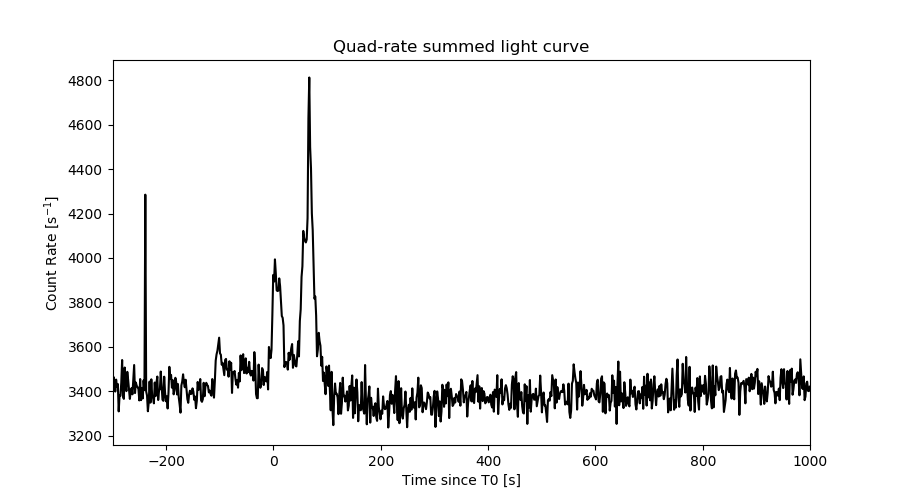
Quad-rate summed light curves (from T0-300s to T0+1000s)
Spectral Evolution

Spectra
Notes:
- 1) The fitting includes the systematic errors.
- 2) When the burst includes telescope slew time periods, the fitting uses an average response file made from multiple 5-s response files through out the slew time plus single time preiod for the non-slew times, and weighted by the total counts in the corresponding time period using addrmf. An average response file is needed becuase a spectral fit using the pre-slew DRM will introduce some errors in both a spectral shape and a normalization if the PHA file contains a lot of the slew/post-slew time interval.
- 3) For fits to more complicated models (e.g. a power-law over a cutoff power-law), the BAT team has decided to require a chi-square improvement of more than 6 for each extra dof.
Time averaged spectrum fit using the average DRM
Power-law model

Time interval is from -105.740 sec. to   88.496 sec.

Spectral model in power-law:
------------------------------------------------------------
Parameters  : value       lower 90%   higher 90%
Photon index: 2.21422     ( -0.101869   0.104605 )
Norm@50keV  : 2.07737E-03    ( -0.000131507   0.000129997 )
------------------------------------------------------------
#Fit statistic : Chi-Squared =          49.04 using 59 PHA bins.
# Reduced chi-squared =         0.8603 for     57 degrees of freedom
# Null hypothesis probability =   7.643119e-01

Photon flux (15-150 keV)    in 194.2 sec: 0.346542 ( -0.017456  0.017498 ) ph/cm2/s
Energy fluence (15-150 keV)             : 3.80154e-06 ( -2.06042e-07  2.08041e-07 ) ergs/cm2
Cutoff power-law model

Time interval is from -105.740 sec. to   88.496 sec.
Spectral model in the cutoff power-law:
------------------------------------------------------------
Parameters  : value       lower 90%   higher 90%
Photon index: 2.21264     ( -0.100277   0.106925 )
Epeak [keV] : 1.00000E+04      ( -10000 -10000 )
Norm@50keV  : 2.07761E-03    ( -0.000100578   0.000128894 )
------------------------------------------------------------
#Fit statistic : Chi-Squared =          49.06 using 59 PHA bins.
# Reduced chi-squared =         0.8760 for     56 degrees of freedom
# Null hypothesis probability =   7.329545e-01

Photon flux (15-150 keV)    in 194.2 sec: 0.337678 ( -0.019312  0.019189 ) ph/cm2/s
Energy fluence (15-150 keV)             : 3.6384e-06 ( -2.5113e-07  2.5393e-07 ) ergs/cm2
Band function

Time interval is from -105.740 sec. to   88.496 sec.


Spectral model in the Band function:
------------------------------------------------------------
Parameters  : value       lower 90%   higher 90%
alpha       :    (     )
beta        :     (     )
Epeak [keV] :       (   )
Norm@50keV   :     (     )
------------------------------------------------------------

Photon flux (15-150 keV)    in  sec:  (    ) ph/cm2/s
Energy fluence (15-150 keV)             : 0 ( 0  0 ) ergs/cm2
Single BB

Spectral model blackbody:
------------------------------------------------------------
Parameters  : value    Lower 90%  Upper 90%
kT [keV]    : 9.39886  (  )
R^2/D10^2   : 0.187136  (   )
(R is the radius in km and D10 is the distance to the source in units of 10 kpc)
------------------------------------------------------------
#Fit statistic : Chi-Squared =         129.44 using 59 PHA bins.
# Reduced chi-squared =         2.2708 for     57 degrees of freedom
# Null hypothesis probability =   1.479126e-07

Energy  Fluence     90% Error
[keV]   [erg/cm2]   [erg/cm2]
15- 25  6.382e-07   5.923e-08
25- 50  1.450e-06   8.467e-08
50-150  6.305e-07   8.720e-08
15-150  2.718e-06   1.447e-07
Thermal bremsstrahlung (OTTB)

Spectral model: thermal bremsstrahlung
------------------------------------------------------------
Parameters  : value         Lower 90%    Upper 90%
kT [keV]    : 50.7989       (-6.7682      8.69373)
Norm        : 1.88842       (-0.16876     0.203732)
------------------------------------------------------------
#Fit statistic : Chi-Squared =          49.12 using 59 PHA bins.
# Reduced chi-squared =         0.8617 for     57 degrees of freedom
# Null hypothesis probability =   7.617532e-01

Energy  Fluence     90% Error
[keV]   [erg/cm2]   [erg/cm2]
15- 25  8.999e-07   5.913e-08
25- 50  1.300e-06   6.205e-08
50-150  1.281e-06   1.663e-07
15-150  3.480e-06   1.952e-07
Double BB

Spectral model: bbodyrad<1> + bbodyrad<2>
------------------------------------------------------------
Parameters  : value         Lower 90%    Upper 90%
kT1 [keV]   : 5.14226        (-0.765417      0.828888)
R1^2/D10^2  : 1.51914        (-0.668295      1.45231)
kT2 [keV]   : 16.8460        (-2.43366      3.38631)
R2^2/D10^2  : 1.33972E-02    (-0.00718263   0.0128442)
------------------------------------------------------------
#Fit statistic : Chi-Squared =          46.02 using 59 PHA bins.
# Reduced chi-squared =         0.8367 for     55 degrees of freedom
# Null hypothesis probability =   8.005619e-01

Energy  Fluence     90% Error
[keV]   [erg/cm2]   [erg/cm2]
15- 25  9.524e-07   1.973e-07
25- 50  1.223e-06   2.068e-07
50-150  1.364e-06   3.455e-07
15-150  3.539e-06   6.816e-07
Peak spectrum fit
Power-law model

Time interval is from   65.524 sec. to   66.524 sec.

Spectral model in power-law:
------------------------------------------------------------
Parameters  : value       lower 90%   higher 90%
Photon index: 2.11879     ( -0.19907   0.212409 )
Norm@50keV  : 1.11586E-02    ( -0.00166147   0.00162228 )
------------------------------------------------------------
#Fit statistic : Chi-Squared =          60.53 using 59 PHA bins.
# Reduced chi-squared =          1.062 for     57 degrees of freedom
# Null hypothesis probability =   3.497084e-01

Photon flux (15-150 keV)    in 1 sec: 1.77215 ( -0.19172  0.19171 ) ph/cm2/s
Energy fluence (15-150 keV)             : 1.03891e-07 ( -1.37069e-08  1.40025e-08 ) ergs/cm2
Cutoff power-law model

Time interval is from   65.524 sec. to   66.524 sec.
Spectral model in the cutoff power-law:
------------------------------------------------------------
Parameters  : value       lower 90%   higher 90%
Photon index: 1.64772     ( -1.16296   0.415662 )
Epeak [keV] : 28.6833      (   )
Norm@50keV  : 2.17512E-02    (     )
------------------------------------------------------------
#Fit statistic : Chi-Squared =          59.74 using 59 PHA bins.
# Reduced chi-squared =          1.067 for     56 degrees of freedom
# Null hypothesis probability =   3.414947e-01

Photon flux (15-150 keV)    in 1 sec: 1.75036 ( -0.19661  0.19624 ) ph/cm2/s
Energy fluence (15-150 keV)             : 0 ( 0  0 ) ergs/cm2
Band function

Time interval is from   65.524 sec. to   66.524 sec.


Spectral model in the Band function:
------------------------------------------------------------
Parameters  : value       lower 90%   higher 90%
alpha       :    (     )
beta        :     (     )
Epeak [keV] :       (   )
Norm@50keV   :     (     )
------------------------------------------------------------

Photon flux (15-150 keV)    in  sec:  (    ) ph/cm2/s
Energy fluence (15-150 keV)             : 0 ( 0  0 ) ergs/cm2
Single BB

Spectral model blackbody:
------------------------------------------------------------
Parameters  : value    Lower 90%  Upper 90%
kT [keV]    : 8.44168  (-1.02844  1.17702)
R^2/D10^2   : 1.59611  (-0.64403   1.07784)
(R is the radius in km and D10 is the distance to the source in units of 10 kpc)
------------------------------------------------------------
#Fit statistic : Chi-Squared =          73.43 using 59 PHA bins.
# Reduced chi-squared =          1.288 for     57 degrees of freedom
# Null hypothesis probability =   7.044517e-02

Energy  Fluence     90% Error
[keV]   [erg/cm2]   [erg/cm2]
15- 25  2.134e-08   4.160e-09
25- 50  4.092e-08   6.075e-09
50-150  1.278e-08   4.359e-09
15-150  7.505e-08   1.204e-08
Thermal bremsstrahlung (OTTB)

Spectral model: thermal bremsstrahlung
------------------------------------------------------------
Parameters  : value         Lower 90%    Upper 90%
kT [keV]    : 51.0485       (-13.514      21.787)
Norm        : 10.0028       (-1.76685     2.30538)
------------------------------------------------------------
#Fit statistic : Chi-Squared =          59.94 using 59 PHA bins.
# Reduced chi-squared =          1.052 for     57 degrees of freedom
# Null hypothesis probability =   3.694725e-01

Energy  Fluence     90% Error
[keV]   [erg/cm2]   [erg/cm2]
15- 25  2.457e-08   3.295e-09
25- 50  3.555e-08   4.330e-09
50-150  3.519e-08   1.115e-08
15-150  9.532e-08   1.438e-08
Double BB

Spectral model: bbodyrad<1> + bbodyrad<2>
------------------------------------------------------------
Parameters  : value         Lower 90%    Upper 90%
kT1 [keV]   : 6.78484        (-2.4157      1.53915)
R1^2/D10^2  : 3.31607        (-1.64627      10.5958)
kT2 [keV]   : 32.7902        (-21.1206      -33.8347)
R2^2/D10^2  : 5.26595E-03    (-0.00460685   0.222114)
------------------------------------------------------------
#Fit statistic : Chi-Squared =          58.79 using 59 PHA bins.
# Reduced chi-squared =          1.069 for     55 degrees of freedom
# Null hypothesis probability =   3.385871e-01

Energy  Fluence     90% Error
[keV]   [erg/cm2]   [erg/cm2]
15- 25  2.455e-08   6.660e-09
25- 50  3.589e-08   1.126e-08
50-150  4.353e-08   2.393e-08
15-150  1.040e-07   3.538e-08
Pre-slew spectrum (Pre-slew PHA with pre-slew DRM)
Power-law model

Spectral model in power-law:
------------------------------------------------------------
Parameters  : value       lower 90%   higher 90%
Photon index: 1.95906     ( -0.158138   0.164741 )
Norm@50keV  : 1.50327E-03    ( -0.00015166   0.000148425 )
------------------------------------------------------------
#Fit statistic : Chi-Squared =          46.09 using 59 PHA bins.
# Reduced chi-squared =         0.8087 for     57 degrees of freedom
# Null hypothesis probability =   8.488510e-01

Photon flux (15-150 keV)    in 141.4 sec: 0.221350 ( -0.0180661  0.0180866 ) ph/cm2/s
Energy fluence (15-150 keV)             : 1.95672e-06 ( -1.87436e-07  1.90295e-07 ) ergs/cm2
Cutoff power-law model

Spectral model in the cutoff power-law:
------------------------------------------------------------
Parameters  : value       lower 90%   higher 90%
Photon index: 1.87093     ( -0.609746   0.372216 )
Epeak [keV] : 65.5378      (   )
Norm@50keV  : 1.68079E-03    (     )
------------------------------------------------------------
#Fit statistic : Chi-Squared =          46.02 using 59 PHA bins.
# Reduced chi-squared =         0.8218 for     56 degrees of freedom
# Null hypothesis probability =   8.267945e-01

Photon flux (15-150 keV)    in 141.4 sec: 0.220330 ( -0.019058  0.018431 ) ph/cm2/s
Energy fluence (15-150 keV)             : 1.94079e-06 ( -2.13231e-07  2.03206e-07 ) ergs/cm2
Band function

Spectral model in the Band function:
------------------------------------------------------------
Parameters  : value       lower 90%   higher 90%
alpha       :    (     )
beta        :     (     )
Epeak [keV] :       (   )
Norm@50keV   :     (     )
------------------------------------------------------------

Photon flux (15-150 keV)    in  sec:  (    ) ph/cm2/s
Energy fluence (15-150 keV)             : 0 ( 0  0 ) ergs/cm2
S(25-50 keV) vs. S(50-100 keV) plot

S(25-50 keV)  = 1.21e-06
S(50-100 keV) = 1.04e-06
T90 vs. Hardness ratio plot

T90                                   = 167.739999890327 sec.
Hardness ratio (energy fluence ratio) = 0.859504
Color vs. Color plot

Count Ratio  (25-50 keV) / (15-25 keV) = 0.931537
Count Ratio (50-100 keV) / (15-25 keV) = 0.401135
Mask shadow pattern

IMX = -4.050769346816848E-01, IMY = 3.061155258480396E-01
TIME vs. PHA plot around the trigger time

Blue+Cyan dotted lines: Time interval of the scaled map
From 0.000000 to 4.096000
TIME vs. DetID plot around the trigger time

Blue+Cyan dotted lines: Time interval of the scaled map
From 0.000000 to 4.096000
100 us light curve (15-350 keV)

Blue+Cyan dotted lines: Time interval of the scaled map
From 0.000000 to 4.096000
Spacecraft aspect plot

Bright source in the pre-burst/pre-slew/post-slew images
Pre-burst image of 15-350 keV band
Time interval of the image:
-239.448000 -105.740000

# RAcent  DECcent POSerr Theta    Phi  PeakCts   SNR AngSep     Name
#  [deg]    [deg]    ['] [deg]  [deg]                   [']
Pre-slew background subtracted image of 15-350 keV band
Time interval of the image:
-105.740000 35.652590

# RAcent  DECcent POSerr Theta    Phi  PeakCts   SNR AngSep     Name
#  [deg]    [deg]    ['] [deg]  [deg]                   [']
189.6895  76.6071    0.8  26.9 -142.9   3.9688  15.1 ------	UNKNOWN
Post-slew image of 15-350 keV band
Time interval of the image:
89.652610 962.711300

# RAcent  DECcent POSerr Theta    Phi  PeakCts   SNR AngSep     Name
#  [deg]    [deg]    ['] [deg]  [deg]                   [']
254.4200  35.3473    5.0  49.9  -23.5   3.4155   2.3    1.9	Her X-1
227.4583  25.8679    2.6  53.9    8.0   8.4344   4.3 ------	UNKNOWN
272.6815  39.5012    3.1  50.2  -43.2  11.8160   3.8 ------	UNKNOWN
Plot creation:
Thu Mar 21 16:32:30 EDT 2019