Estimated redshift from machine learning (Ukwatta et al. 2016) - may take a few minute to calcaulte
Image
Pre-slew 15.0-350.0 keV image (Event data)
#   RAcent    DECcent   POSerr    Theta     Phi              Peak Cts       SNR   Name
  117.8268   -45.8779   0.0158    49.8054     3.7520         3.8570092     12.086 TRIG_00893808

Foreground time interval of the image:
-25.200  44.800 (delta_t =  70.000 [sec])
Background time interval of the image:
-239.200 -25.200 (delta_t = 214.000 [sec])
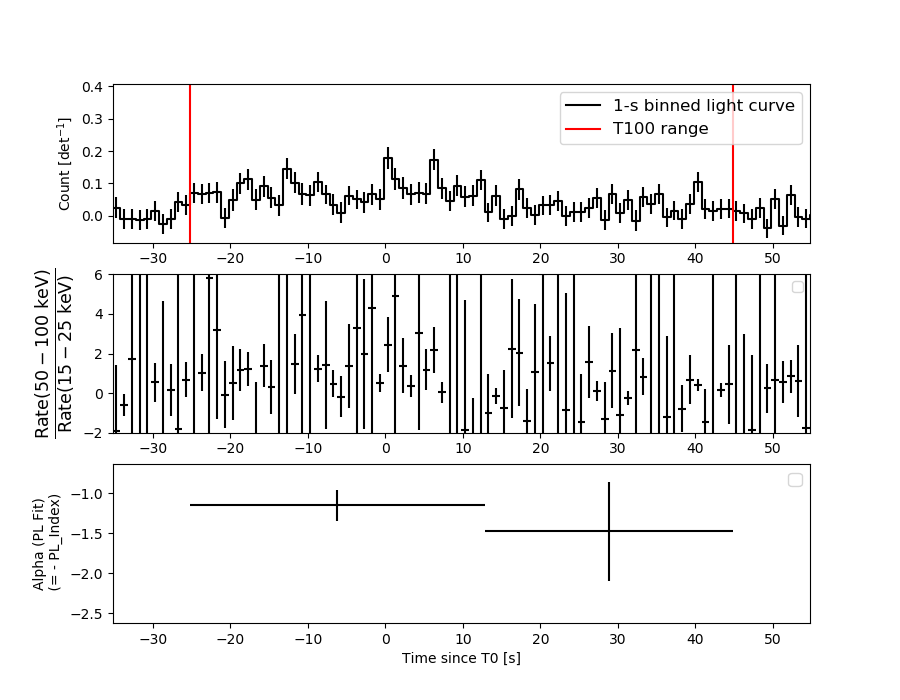
Lightcurves
Notes:
- 1) The mask-weighted light curves are using the flight position.
- 2) Multiple plots of different time binning/intervals are shown to cover all scenarios of short/long GRBs, rate/image triggers, and real/false positives.
- 3) For all the mask-weighted lightcurves, the y-axis units are counts/sec/det where a det is 0.4 x 0.4 = 0.16 sq cm.
- 4) The verticle lines correspond to following: green dotted lines are T50 interval, black dotted lines are T90 interval, blue solid line(s) is a spacecraft slew start time, and orange solid line(s) is a spacecraft slew end time.
- 5) Time of each bin is in the middle of the bin.
1 s binning
From T0-310 s to T0+310 s
From T100_start - 20 s to T100_end + 30 s
Full time interval

64 ms binning
Full time interval
From T100_start to T100_end
From T0-5 sec to T0+5 sec
16 ms binning
From T100_start-5 s to T100_start+5 s

8 ms binning
From T100_start-3 s to T100_start+3 s

2 ms binning
From T100_start-1 s to T100_start+1 s

SN=5 or 10 sec. binning (whichever binning is satisfied first)
SN=5 or 10 sec. binning (T < 200 sec)

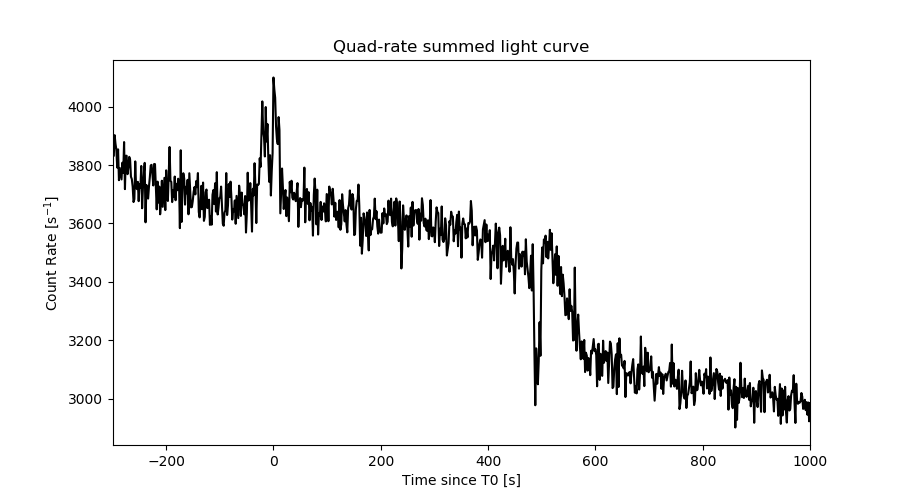
Quad-rate summed light curves (from T0-300s to T0+1000s)
Spectral Evolution
Spectra
Notes:
- 1) The fitting includes the systematic errors.
- 2) When the burst includes telescope slew time periods, the fitting uses an average response file made from multiple 5-s response files through out the slew time plus single time preiod for the non-slew times, and weighted by the total counts in the corresponding time period using addrmf. An average response file is needed becuase a spectral fit using the pre-slew DRM will introduce some errors in both a spectral shape and a normalization if the PHA file contains a lot of the slew/post-slew time interval.
- 3) For fits to more complicated models (e.g. a power-law over a cutoff power-law), the BAT team has decided to require a chi-square improvement of more than 6 for each extra dof.
Time averaged spectrum fit using the average DRM
Power-law model
Time interval is from  -25.200 sec. to   44.800 sec.

Spectral model in power-law:
------------------------------------------------------------
Parameters  : value       lower 90%   higher 90%
Photon index: 1.22042     ( -0.202436   0.196324 )
Norm@50keV  : 3.79671E-03    ( -0.000438344   0.000434765 )
------------------------------------------------------------
#Fit statistic : Chi-Squared =          51.80 using 59 PHA bins.
# Reduced chi-squared =         0.9088 for     57 degrees of freedom
# Null hypothesis probability =   6.698382e-01

Photon flux (15-150 keV)    in 70 sec: 0.446982 ( -0.055991  0.056556 ) ph/cm2/s
Energy fluence (15-150 keV)             : 2.68138e-06 ( -3.0422e-07  3.04473e-07 ) ergs/cm2
Cutoff power-law model

Time interval is from  -25.200 sec. to   44.800 sec.
Spectral model in the cutoff power-law:
------------------------------------------------------------
Parameters  : value       lower 90%   higher 90%
Photon index: 0.917786     ( -0.909618   0.398436 )
Epeak [keV] : 221.131      ( -221.135 -221.135 )
Norm@50keV  : 5.05996E-03    ( -0.00194604   0.00627187 )
------------------------------------------------------------
#Fit statistic : Chi-Squared =          51.36 using 59 PHA bins.
# Reduced chi-squared =         0.9172 for     56 degrees of freedom
# Null hypothesis probability =   6.507826e-01

Photon flux (15-150 keV)    in 70 sec: 0.438935 ( -0.059747  0.059566 ) ph/cm2/s
Energy fluence (15-150 keV)             : 2.66096e-06 ( -3.10958e-07  3.09599e-07 ) ergs/cm2
Band function

Time interval is from  -25.200 sec. to   44.800 sec.


Spectral model in the Band function:
------------------------------------------------------------
Parameters  : value       lower 90%   higher 90%
alpha       :    (     )
beta        :     (     )
Epeak [keV] :       (   )
Norm@50keV   :     (     )
------------------------------------------------------------

Photon flux (15-150 keV)    in  sec:  (    ) ph/cm2/s
Energy fluence (15-150 keV)             : 0 ( 0  0 ) ergs/cm2
Single BB
Spectral model blackbody:
------------------------------------------------------------
Parameters  : value    Lower 90%  Upper 90%
kT [keV]    : 22.4595  (-2.90706  3.57967)
R^2/D10^2   : 1.39666E-02  (-0.00544065   0.00835308)
(R is the radius in km and D10 is the distance to the source in units of 10 kpc)
------------------------------------------------------------
#Fit statistic : Chi-Squared =          63.40 using 59 PHA bins.
# Reduced chi-squared =          1.112 for     57 degrees of freedom
# Null hypothesis probability =   2.609590e-01

Energy  Fluence     90% Error
[keV]   [erg/cm2]   [erg/cm2]
15- 25  9.040e-08   2.030e-08
25- 50  4.838e-07   1.015e-07
50-150  1.824e-06   3.391e-07
15-150  2.398e-06   3.598e-07
Thermal bremsstrahlung (OTTB)

Spectral model: thermal bremsstrahlung
------------------------------------------------------------
Parameters  : value         Lower 90%    Upper 90%
kT [keV]    : 200.000       (-28.7984      -200)
Norm        : 1.94579       (-0.22065     0.22065)
------------------------------------------------------------
#Fit statistic : Chi-Squared =          61.32 using 59 PHA bins.
# Reduced chi-squared =          1.076 for     57 degrees of freedom
# Null hypothesis probability =   3.239033e-01

Energy  Fluence     90% Error
[keV]   [erg/cm2]   [erg/cm2]
15- 25  3.393e-07   1.615e-07
25- 50  6.527e-07   3.581e-07
50-150  1.432e-06   7.213e-07
15-150  2.424e-06   1.178e-06
Double BB
Spectral model: bbodyrad<1> + bbodyrad<2>
------------------------------------------------------------
Parameters  : value         Lower 90%    Upper 90%
kT1 [keV]   : 4.96719        (-1.59138      2.69503)
R1^2/D10^2  : 1.40455        (-1.1704      7.38719)
kT2 [keV]   : 27.0252        (-4.33168      6.6889)
R2^2/D10^2  : 7.04547E-03    (-0.00367441   0.00574873)
------------------------------------------------------------
#Fit statistic : Chi-Squared =          47.99 using 59 PHA bins.
# Reduced chi-squared =         0.8725 for     55 degrees of freedom
# Null hypothesis probability =   7.373072e-01

Energy  Fluence     90% Error
[keV]   [erg/cm2]   [erg/cm2]
15- 25  2.928e-07   1.483e-07
25- 50  5.029e-07   1.515e-07
50-150  1.890e-06   6.083e-07
15-150  2.686e-06   7.473e-07
Peak spectrum fit
Power-law model
Time interval is from   -0.200 sec. to    0.800 sec.

Spectral model in power-law:
------------------------------------------------------------
Parameters  : value       lower 90%   higher 90%
Photon index: 1.42830     ( -0.58604   0.61119 )
Norm@50keV  : 1.06214E-02    ( -0.00373834   0.00373816 )
------------------------------------------------------------
#Fit statistic : Chi-Squared =          68.34 using 59 PHA bins.
# Reduced chi-squared =          1.199 for     57 degrees of freedom
# Null hypothesis probability =   1.443969e-01

Photon flux (15-150 keV)    in 1 sec: 1.30204 ( -0.488792  0.50181 ) ph/cm2/s
Energy fluence (15-150 keV)             : 1.0207e-07 ( -3.70271e-08  3.72778e-08 ) ergs/cm2
Cutoff power-law model

Time interval is from   -0.200 sec. to    0.800 sec.
Spectral model in the cutoff power-law:
------------------------------------------------------------
Parameters  : value       lower 90%   higher 90%
Photon index: -9.99987     ( 9.99996   6.47343 )
Epeak [keV] : 68.6168      ( -8.37877 9.81709 )
Norm@50keV  : 108.389    ( -108.188   307.708 )
------------------------------------------------------------
#Fit statistic : Chi-Squared =          60.91 using 59 PHA bins.
# Reduced chi-squared =          1.088 for     56 degrees of freedom
# Null hypothesis probability =   3.035969e-01

Photon flux (15-150 keV)    in 1 sec: 0.830355 ( -0.229918  0.322865 ) ph/cm2/s
Energy fluence (15-150 keV)             : 3.81075e-08 ( 0  0 ) ergs/cm2
Band function

Time interval is from   -0.200 sec. to    0.800 sec.


Spectral model in the Band function:
------------------------------------------------------------
Parameters  : value       lower 90%   higher 90%
alpha       :    (     )
beta        :     (     )
Epeak [keV] :       (   )
Norm@50keV   :     (     )
------------------------------------------------------------

Photon flux (15-150 keV)    in  sec:  (    ) ph/cm2/s
Energy fluence (15-150 keV)             : 0 ( 0  0 ) ergs/cm2
Single BB

Spectral model blackbody:
------------------------------------------------------------
Parameters  : value    Lower 90%  Upper 90%
kT [keV]    : 19.6959  (-4.61233  6.96659)
R^2/D10^2   : 6.63616E-02  (-0.0672276   0.104204)
(R is the radius in km and D10 is the distance to the source in units of 10 kpc)
------------------------------------------------------------
#Fit statistic : Chi-Squared =          64.89 using 59 PHA bins.
# Reduced chi-squared =          1.138 for     57 degrees of freedom
# Null hypothesis probability =   2.208104e-01

Energy  Fluence     90% Error
[keV]   [erg/cm2]   [erg/cm2]
15- 25  1.584e-08   1.119e-08
25- 50  1.086e-08   8.160e-09
50-150  4.856e-10   6.045e-10
15-150  2.719e-08   1.864e-08
Thermal bremsstrahlung (OTTB)
Spectral model: thermal bremsstrahlung
------------------------------------------------------------
Parameters  : value         Lower 90%    Upper 90%
kT [keV]    : 199.363       (-126.216      -199.363)
Norm        : 5.51814       (-1.93118     2.13174)
------------------------------------------------------------
#Fit statistic : Chi-Squared =          68.12 using 59 PHA bins.
# Reduced chi-squared =          1.195 for     57 degrees of freedom
# Null hypothesis probability =   1.486871e-01

Energy  Fluence     90% Error
[keV]   [erg/cm2]   [erg/cm2]
15- 25  1.374e-08   8.425e-09
25- 50  2.643e-08   1.630e-08
50-150  5.797e-08   3.644e-08
15-150  9.814e-08   6.095e-08
Double BB
Spectral model: bbodyrad<1> + bbodyrad<2>
------------------------------------------------------------
Parameters  : value         Lower 90%    Upper 90%
kT1 [keV]   : 2.53891        (-2.59205      11.595)
R1^2/D10^2  : 171.908        (-170.867      -170.867)
kT2 [keV]   : 20.7181        (-5.05934      8.18784)
R2^2/D10^2  : 5.31061E-02    (-0.0372775   0.0876955)
------------------------------------------------------------
#Fit statistic : Chi-Squared =          62.43 using 59 PHA bins.
# Reduced chi-squared =          1.135 for     55 degrees of freedom
# Null hypothesis probability =   2.291690e-01

Energy  Fluence     90% Error
[keV]   [erg/cm2]   [erg/cm2]
15- 25  1.487e-08   9.660e-09
25- 50  2.290e-08   1.382e-08
50-150  7.054e-08   4.622e-08
15-150  1.083e-07   6.075e-08
Pre-slew spectrum (Pre-slew PHA with pre-slew DRM)
Power-law model

Spectral model in power-law:
------------------------------------------------------------
Parameters  : value       lower 90%   higher 90%
Photon index: 1.22042     ( -0.202436   0.196324 )
Norm@50keV  : 3.79671E-03    ( -0.000438344   0.000434765 )
------------------------------------------------------------
#Fit statistic : Chi-Squared =          51.80 using 59 PHA bins.
# Reduced chi-squared =         0.9088 for     57 degrees of freedom
# Null hypothesis probability =   6.698382e-01

Photon flux (15-150 keV)    in 70 sec: 0.446978 ( -0.0559905  0.0565492 ) ph/cm2/s
Energy fluence (15-150 keV)             : 2.68104e-06 ( -3.04155e-07  3.04687e-07 ) ergs/cm2
Cutoff power-law model

Spectral model in the cutoff power-law:
------------------------------------------------------------
Parameters  : value       lower 90%   higher 90%
Photon index: 0.923366     ( -0.911265   0.397114 )
Epeak [keV] : 222.036      ( -221.169 -221.169 )
Norm@50keV  : 5.03794E-03    ( -0.00188492   0.00627198 )
------------------------------------------------------------
#Fit statistic : Chi-Squared =          51.36 using 59 PHA bins.
# Reduced chi-squared =         0.9172 for     56 degrees of freedom
# Null hypothesis probability =   6.507254e-01

Photon flux (15-150 keV)    in 70 sec: 0.438908 ( -0.059733  0.059808 ) ph/cm2/s
Energy fluence (15-150 keV)             : 2.66215e-06 ( -3.1115e-07  3.09813e-07 ) ergs/cm2
Band function
Spectral model in the Band function:
------------------------------------------------------------
Parameters  : value       lower 90%   higher 90%
alpha       :    (     )
beta        :     (     )
Epeak [keV] :       (   )
Norm@50keV   :     (     )
------------------------------------------------------------

Photon flux (15-150 keV)    in  sec:  (    ) ph/cm2/s
Energy fluence (15-150 keV)             : 0 ( 0  0 ) ergs/cm2
S(25-50 keV) vs. S(50-100 keV) plot

S(25-50 keV)  = 5.70e-07
S(50-100 keV) = 9.80e-07
T90 vs. Hardness ratio plot

T90                                   = 63 sec.
Hardness ratio (energy fluence ratio) = 1.7193
Color vs. Color plot
Count Ratio  (25-50 keV) / (15-25 keV) = 1.53489
Count Ratio (50-100 keV) / (15-25 keV) = 1.94085
Mask shadow pattern

IMX = 1.181030750815701E+00, IMY = -7.745111219418808E-02
TIME vs. PHA plot around the trigger time
TIME vs. DetID plot around the trigger time
100 us light curve (15-350 keV)

Spacecraft aspect plot

Bright source in the pre-burst/pre-slew/post-slew images
Pre-burst image of 15-350 keV band
Time interval of the image:
-239.200000 -25.200000

# RAcent  DECcent POSerr Theta    Phi  PeakCts   SNR AngSep     Name
#  [deg]    [deg]    ['] [deg]  [deg]                   [']
135.5568 -40.5437    2.3  46.4   22.0   3.5083   5.0    1.4	Vela X-1
170.3144 -60.7013    3.3  17.2   19.9   0.9595   3.5    4.7	Cen X-3
186.9241 -62.6378    6.3   9.1   23.0   0.5409   1.8   10.8	GX 301-2
244.9775 -15.6369    1.7  54.4  164.8  11.1588   6.7    0.2	Sco X-1
256.0609 -38.0349    0.0  38.5 -169.2   0.4206   1.0   12.0	4U 1700-377
256.4978 -36.5337    6.4  39.9 -170.0   0.7993   1.8    7.3	GX 349+2
262.9529 -24.5680    8.4  53.1 -171.5  -1.2835  -1.4   11.1	GX 1+4
264.7181 -44.3887    6.0  37.2 -154.5  -0.7901  -1.9    3.8	4U 1735-44
270.3867 -25.0298    4.2  55.9 -164.0   3.1964   2.7    6.3	GX 5-1
270.4039 -25.7734    5.8  55.2 -163.5   2.2376   2.0    5.8	GRS 1758-258
275.9270 -30.3605   16.0  53.8 -155.5   0.7343   0.7    0.4	H1820-303
263.1123 -33.8803   11.7  45.1 -165.3  -0.5851  -1.0    6.7	GX 354-0
232.7855 -15.0450    3.2  51.5  150.5   5.7104   3.6 ------	UNKNOWN
139.0143 -41.3293    2.9  44.3   24.3   2.3199   4.0 ------	UNKNOWN
203.8169 -46.0954    2.6  17.3  110.5   1.4422   4.5 ------	UNKNOWN
207.1200 -63.2568    1.1   0.0 -171.8   2.8726  10.3 ------	UNKNOWN
297.1158 -51.9806    3.6  45.3 -122.0   4.1768   3.2 ------	UNKNOWN
Pre-slew background subtracted image of 15-350 keV band
Time interval of the image:
-25.200000 44.800000

# RAcent  DECcent POSerr Theta    Phi  PeakCts   SNR AngSep     Name
#  [deg]    [deg]    ['] [deg]  [deg]                   [']
135.7064 -40.4924   44.4  46.4   22.1  -0.0833  -0.3    8.9	Vela X-1
170.0055 -60.6457   10.9  17.4   19.9  -0.1503  -1.1    9.2	Cen X-3
186.3447 -62.8253    6.4   9.4   21.5   0.2504   1.8    9.2	GX 301-2
244.8209 -15.6610    6.2  54.3  164.6   1.3416   1.9    9.2	Sco X-1
256.0339 -37.8256    4.8  38.7 -169.4   0.4993   2.4    2.5	4U 1700-377
256.3559 -36.2554    4.5  40.1 -170.4   0.5752   2.6   10.8	GX 349+2
263.0422 -24.7181    6.3  53.0 -171.4   0.8178   1.8    2.4	GX 1+4
264.6633 -44.3696    3.7  37.2 -154.5   0.6451   3.1    5.9	4U 1735-44
270.1828 -25.0979    4.7  55.7 -164.1  -1.4479  -2.5    5.6	GX 5-1
270.3060 -25.7608    6.9  55.2 -163.6  -0.9014  -1.7    1.1	GRS 1758-258
275.8033 -30.3444   11.0  53.7 -155.6  -0.5327  -1.0    6.4	H1820-303
262.9015 -33.6475    0.0  45.2 -165.7  -0.3771  -1.4   12.1	GX 354-0
175.0732 -48.8934    2.1  22.5   52.6   0.9172   5.6 ------	UNKNOWN
117.8268 -45.8779    0.9  49.8    3.8   3.8572  12.1 ------	UNKNOWN
Post-slew image of 15-350 keV band
Time interval of the image:
596.000600 659.489300
660.800000 720.435100
720.800000 962.819100

# RAcent  DECcent POSerr Theta    Phi  PeakCts   SNR AngSep     Name
#  [deg]    [deg]    ['] [deg]  [deg]                   [']
270.1327 -24.9478   75.4  37.1   88.5   0.1460   0.2   11.4	GX 5-1
270.3262 -25.6248    3.0  36.9   87.4   3.4826   3.9    7.2	GRS 1758-258
274.1210 -14.1133    4.9  35.7  107.8   1.9631   2.4    8.1	GX 17+2
276.0473 -30.2510   13.0  31.9   79.1   0.5979   0.9    9.4	H1820-303
285.2020 -25.0140    8.2  23.5   89.3   0.6434   1.4   10.6	HT1900.1-2455
288.7936  10.9807    3.8  39.7  155.7   2.5082   3.0    2.1	GRS 1915+105
285.3477 -65.7251    2.7  46.3   24.8   3.4559   4.3 ------	UNKNOWN
313.8305 -10.6829    2.9  12.1 -154.7   1.2983   4.0 ------	UNKNOWN
Plot creation:
Thu Apr 11 00:54:56 EDT 2019