Estimated redshift from machine learning (Ukwatta et al. 2016) - may take a few minutes to calcaulte
Image
Pre-slew 15-350 keV image (Event data; bkg subtracted)

#   RAcent  DECcent POSerr  Theta    Phi     Peak Cts     SNR  Name
  324.9638 -46.5553 0.0516   34.1 -161.1       0.7339     3.7  TRIG_00897653
------------------------------------------

Foreground time interval of the image:
 -1.236  68.720 (delta_t =  69.956 [sec])
Background time interval of the image:
-60.000  -1.236 (delta_t =  58.764 [sec])
Lightcurves
Notes:
- 1) All plots contain as much data as has been downloaded to date.
- 2) The mask-weighted light curves are using the flight position.
- 3) Multiple plots of different time binning/intervals are shown to cover all scenarios of short/long GRBs, rate/image triggers, and real/false positives.
- 4) For all the mask-weighted lightcurves, the y-axis units are counts/sec/det where a det is 0.4 x 0.4 = 0.16 sq cm.
- 5) The verticle lines correspond to following: green dotted lines are T50 interval, black dotted lines are T90 interval, blue solid line(s) is a spacecraft slew start time, and orange solid line(s) is a spacecraft slew end time.
- 6) Time of each bin is in the middle of the bin.
1 s binning
From T0-310 s to T0+310 s

From T100_start - 20 s to T100_end + 30 s

Full time interval

64 ms binning
Full time interval

From T100_start to T100_end

From T0-5 sec to T0+5 sec

16 ms binning
From T100_start-5 s to T100_start+5 s

Blue+Cyan dotted lines: Time interval of the scaled map
From 0.000000 to 64.000000
8 ms binning
From T100_start-3 s to T100_start+3 s

Blue+Cyan dotted lines: Time interval of the scaled map
From 0.000000 to 64.000000
2 ms binning
From T100_start-1 s to T100_start+1 s

Blue+Cyan dotted lines: Time interval of the scaled map
From 0.000000 to 64.000000
SN=5 or 10 sec. binning (whichever binning is satisfied first)

SN=5 or 10 sec. binning (T < 200 sec)

Spectra
Notes:
- 1) The fitting includes the systematic errors.
- 2) For long bursts, a spectral fit of the pre-slew DRM will introduce some errors in both a spectral shape and a normalization if the PHA file contains a lot of the slew/post-slew time interval.
- 3) For fits to more complicated models (e.g. a power-law over a cutoff power-law), the BAT team has decided to require a chi-square improvement of more than 6 for each extra dof.
- 4) For short bursts (T90<1sec), the specrtum is also fit with Blackbody, OTTB, and Double Blackbody.
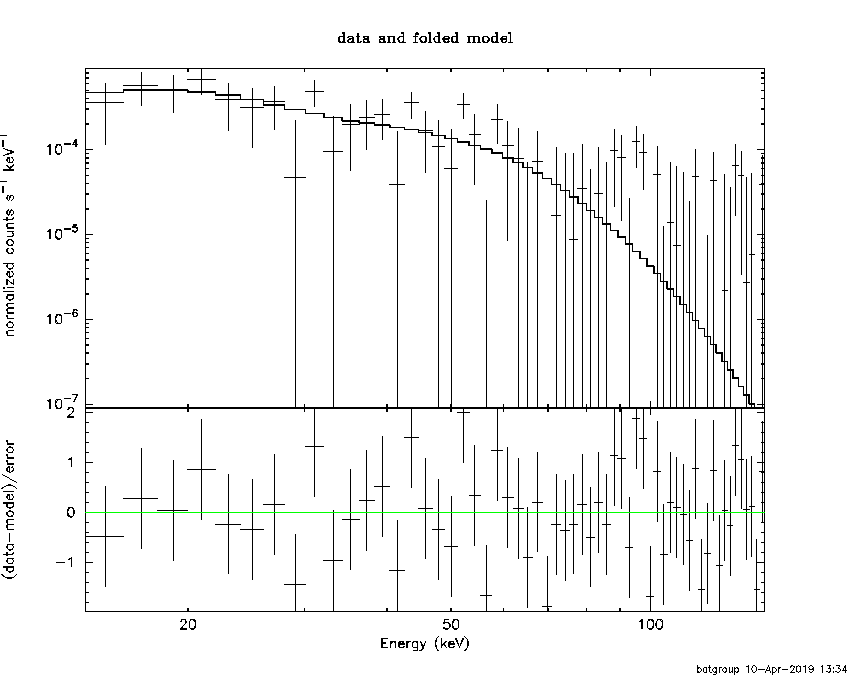
Time averaged spectrum fit using the pre-slew DRM
Power-law model

Time interval is from   -1.236 sec. to   68.720 sec.

Spectral model in power-law:
------------------------------------------------------------
Parameters  : value       lower 90%   higher 90%
Photon index: 2.05875     ( -0.388806   0.446645 )
Norm@50keV  : 7.63650E-04    ( -0.000232482   0.000223806 )
------------------------------------------------------------
#Fit statistic : Chi-Squared =          51.29 using 59 PHA bins.
# Reduced chi-squared =         0.8997 for     57 degrees of freedom
# Null hypothesis probability =   6.883472e-01

Photon flux (15-150 keV)    in 69.96 sec: 0.117754 ( -0.0259196  0.0259223 ) ph/cm2/s
Energy fluence (15-150 keV)             : 4.94591e-07 ( -1.33399e-07  1.40875e-07 ) ergs/cm2
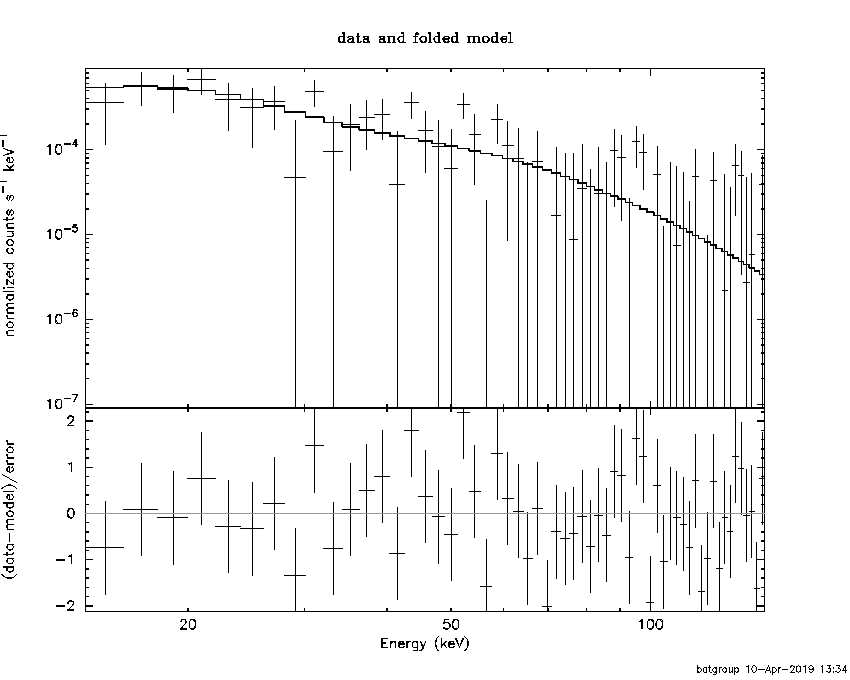
Cutoff power-law model

Time interval is from   -1.236 sec. to   68.720 sec.
Spectral model in the cutoff power-law:
------------------------------------------------------------
Parameters  : value       lower 90%   higher 90%
Photon index: 0.646592     ( -2.83957   1.44869 )
Epeak [keV] : 37.6971      ( -37.6971 -37.6971 )
Norm@50keV  : 5.36278E-03    ( -0.00536272   0.274143 )
------------------------------------------------------------
#Fit statistic : Chi-Squared =          49.66 using 59 PHA bins.
# Reduced chi-squared =         0.8868 for     56 degrees of freedom
# Null hypothesis probability =   7.120362e-01

Photon flux (15-150 keV)    in 69.96 sec: 0.113671 ( -0.0256886  0.026298 ) ph/cm2/s
Energy fluence (15-150 keV)             : 4.39152e-07 ( -1.2252e-07  1.53908e-07 ) ergs/cm2
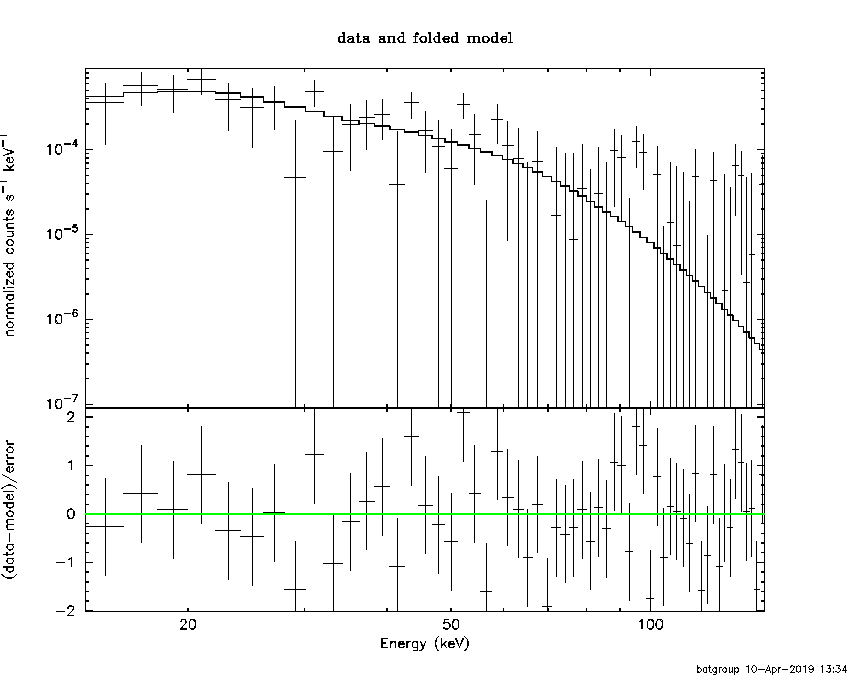
Band function

Time interval is from   -1.236 sec. to   68.720 sec.

Spectral model in the Band function:
------------------------------------------------------------
Parameters  : value       lower 90%   higher 90%
alpha       : -0.656115   ( 0.561258   0.561258 )
beta        : -3.29532    ( 3.37942   4.12482 )
Epeak [keV] : 37.0433      ( -37.0116 75.896 )
Norm@50keV   : 5.38487E-03    ( -0.0061735   126.067 )
------------------------------------------------------------
#Fit statistic : Chi-Squared =          49.68 using 59 PHA bins.
# Reduced chi-squared =         0.9032 for     55 degrees of freedom
# Null hypothesis probability =   6.775136e-01

Photon flux (15-150 keV)    in 69.96 sec:  (    ) ph/cm2/s
Energy fluence (15-150 keV)             : 4.40931e-07 ( 0  0 ) ergs/cm2
Single BB

Spectral model blackbody:
------------------------------------------------------------
Parameters  : value    Lower 90%  Upper 90%
kT [keV]    : 9.70810  (-2.06795  2.53569)
R^2/D10^2   : 6.40284E-02  (-0.0379488   0.0953903)
(R is the radius in km and D10 is the distance to the source in units of 10 kpc)
------------------------------------------------------------
#Fit statistic : Chi-Squared =          51.44 using 59 PHA bins.
# Reduced chi-squared =         0.9025 for     57 degrees of freedom
# Null hypothesis probability =   6.828427e-01

Energy  Fluence     90% Error
[keV]   [erg/cm2]   [erg/cm2]
15- 25  8.506e-08   3.888e-08
25- 50  2.027e-07   8.080e-08
50-150  9.703e-08   5.867e-08
15-150  3.848e-07   1.548e-07
Thermal bremsstrahlung (OTTB)

Spectral model: thermal bremsstrahlung
------------------------------------------------------------
Parameters  : value         Lower 90%    Upper 90%
kT [keV]    : 56.2717       (-24.9665      65.795)
Norm        : 0.644564       (-0.198286     0.294423)
------------------------------------------------------------
#Fit statistic : Chi-Squared =          49.96 using 59 PHA bins.
# Reduced chi-squared =         0.8765 for     57 degrees of freedom
# Null hypothesis probability =   7.341259e-01

Energy  Fluence     90% Error
[keV]   [erg/cm2]   [erg/cm2]
15- 25  1.121e-07   3.674e-08
25- 50  1.672e-07   7.089e-08
50-150  1.801e-07   1.108e-07
15-150  4.593e-07   1.904e-07
Double BB
Spectral model: bbodyrad<1> + bbodyrad<2>
------------------------------------------------------------
Parameters  : value         Lower 90%    Upper 90%
kT1 [keV]   : 3.47223        (-3.40715      93.6436)
R1^2/D10^2  : 1.72351        (-1.76784      -1.76784)
kT2 [keV]   : 11.7660        (-3.14106      -11.7265)
R2^2/D10^2  : 2.62842E-02    (-0.0264805   0.0740468)
------------------------------------------------------------
#Fit statistic : Chi-Squared =          49.10 using 59 PHA bins.
# Reduced chi-squared =         0.8927 for     55 degrees of freedom
# Null hypothesis probability =   6.983595e-01

Energy  Fluence     90% Error
[keV]   [erg/cm2]   [erg/cm2]
15- 25  1.066e-07   5.863e-08
25- 50  1.777e-07   1.022e-07
50-150  1.358e-07   8.937e-08
15-150  4.201e-07   2.240e-07
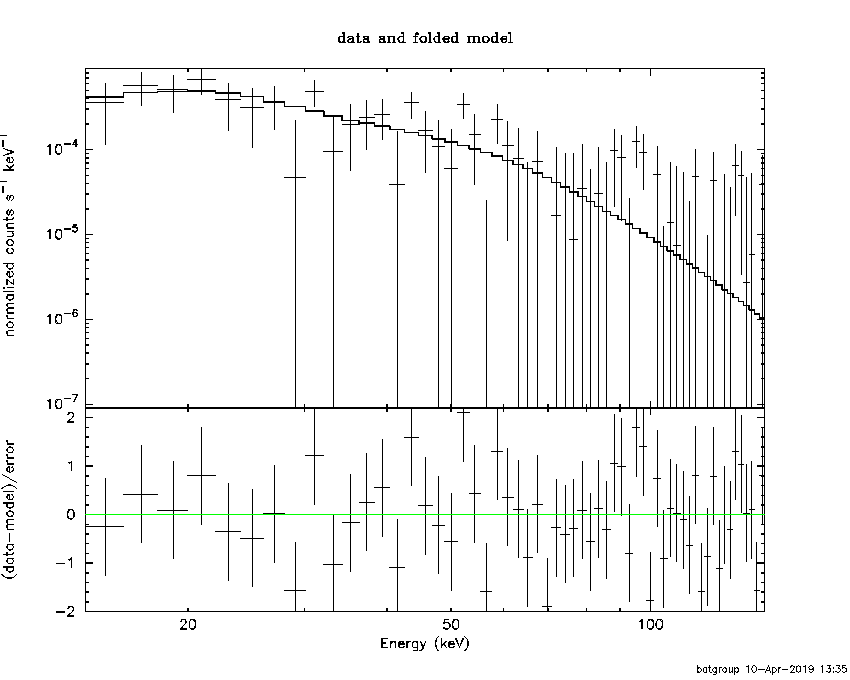
Peak spectrum fit
Power-law model

Time interval is from   61.452 sec. to   62.452 sec.

Spectral model in power-law:
------------------------------------------------------------
Parameters  : value       lower 90%   higher 90%
Photon index: 1.55881     ( -0.563132   0.606621 )
Norm@50keV  : 4.79562E-03    ( -0.00177553   0.00173013 )
------------------------------------------------------------
#Fit statistic : Chi-Squared =          44.02 using 59 PHA bins.
# Reduced chi-squared =         0.7723 for     57 degrees of freedom
# Null hypothesis probability =   8.959850e-01

Photon flux (15-150 keV)    in 1 sec: 0.608655 ( -0.213664  0.214361 ) ph/cm2/s
Energy fluence (15-150 keV)             : 4.50902e-08 ( -1.73057e-08  1.79271e-08 ) ergs/cm2
Cutoff power-law model

Time interval is from   61.452 sec. to   62.452 sec.
Spectral model in the cutoff power-law:
------------------------------------------------------------
Parameters  : value       lower 90%   higher 90%
Photon index: 3.05454E-03     ( -4.94538   2.21319 )
Epeak [keV] : 63.2888      (   )
Norm@50keV  : 2.97961E-02    (     )
------------------------------------------------------------
#Fit statistic : Chi-Squared =          42.88 using 59 PHA bins.
# Reduced chi-squared =         0.7657 for     56 degrees of freedom
# Null hypothesis probability =   9.011473e-01

Photon flux (15-150 keV)    in 1 sec: 0.580375 ( -0.217528  0.219298 ) ph/cm2/s
Energy fluence (15-150 keV)             : 4.15906e-08 ( -1.69472e-08  1.87857e-08 ) ergs/cm2
Band function

Time interval is from   61.452 sec. to   62.452 sec.

Spectral model in the Band function:
------------------------------------------------------------
Parameters  : value       lower 90%   higher 90%
alpha       : 3.02480E-03   ( -1.87606   4.69637 )
beta        : -10.0000    ( 10   0 )
Epeak [keV] : 62.6024      ( -24.3463 214.941 )
Norm@50keV   : 3.04765E-02    ( -0.0304112   6.63614 )
------------------------------------------------------------
#Fit statistic : Chi-Squared =          42.88 using 59 PHA bins.
# Reduced chi-squared =         0.7796 for     55 degrees of freedom
# Null hypothesis probability =   8.826812e-01

Photon flux (15-150 keV)    in 1 sec: 0.595554 (    ) ph/cm2/s
Energy fluence (15-150 keV)             : 4.28213e-08 ( 0  0 ) ergs/cm2
Single BB

Spectral model blackbody:
------------------------------------------------------------
Parameters  : value    Lower 90%  Upper 90%
kT [keV]    : 14.4999  (-4.58235  6.91101)
R^2/D10^2   : 8.28345E-02  (-0.0828344   0.229313)
(R is the radius in km and D10 is the distance to the source in units of 10 kpc)
------------------------------------------------------------
#Fit statistic : Chi-Squared =          43.39 using 59 PHA bins.
# Reduced chi-squared =         0.7612 for     57 degrees of freedom
# Null hypothesis probability =   9.081278e-01

Energy  Fluence     90% Error
[keV]   [erg/cm2]   [erg/cm2]
15- 25  3.664e-09   2.354e-09
25- 50  1.410e-08   8.815e-09
50-150  1.987e-08   1.371e-08
15-150  3.763e-08   2.480e-08
Thermal bremsstrahlung (OTTB)

Spectral model: thermal bremsstrahlung
------------------------------------------------------------
Parameters  : value         Lower 90%    Upper 90%
kT [keV]    : 174.964       (-119.413      -169.587)
Norm        : 2.52208       (-0.888947     1.26614)
------------------------------------------------------------
#Fit statistic : Chi-Squared =          43.55 using 59 PHA bins.
# Reduced chi-squared =         0.7640 for     57 degrees of freedom
# Null hypothesis probability =   9.051898e-01

Energy  Fluence     90% Error
[keV]   [erg/cm2]   [erg/cm2]
15- 25  6.381e-09   3.924e-09
25- 50  1.208e-08   7.525e-09
50-150  2.531e-08   1.566e-08
15-150  4.377e-08   2.735e-08
Double BB

Spectral model: bbodyrad<1> + bbodyrad<2>
------------------------------------------------------------
Parameters  : value         Lower 90%    Upper 90%
kT1 [keV]   : 5.31156        (-5.29979      -5.29979)
R1^2/D10^2  : 0.930475        (-0.943911      -0.943911)
kT2 [keV]   : 17.1169        (-17.0963      -17.0963)
R2^2/D10^2  : 4.06402E-02    (-0.0409218   0.22983)
------------------------------------------------------------
#Fit statistic : Chi-Squared =          42.87 using 59 PHA bins.
# Reduced chi-squared =         0.7794 for     55 degrees of freedom
# Null hypothesis probability =   8.829676e-01

Energy  Fluence     90% Error
[keV]   [erg/cm2]   [erg/cm2]
15- 25  5.285e-09   2.934e-09
25- 50  1.293e-08   7.640e-09
50-150  2.269e-08   1.522e-08
15-150  4.091e-08   2.470e-08
Pre-slew spectrum (Pre-slew PHA with pre-slew DRM)
Power-law model
Spectral model in power-law:
------------------------------------------------------------
Parameters  : value       lower 90%   higher 90%
Photon index: 2.05875     ( -0.388806   0.446645 )
Norm@50keV  : 7.63650E-04    ( -0.000232482   0.000223806 )
------------------------------------------------------------
#Fit statistic : Chi-Squared =          51.29 using 59 PHA bins.
# Reduced chi-squared =         0.8997 for     57 degrees of freedom
# Null hypothesis probability =   6.883472e-01

Photon flux (15-150 keV)    in 69.96 sec: 0.117754 ( -0.0259196  0.0259223 ) ph/cm2/s
Energy fluence (15-150 keV)             : 4.94591e-07 ( -1.33399e-07  1.40875e-07 ) ergs/cm2
Cutoff power-law model
Spectral model in the cutoff power-law:
------------------------------------------------------------
Parameters  : value       lower 90%   higher 90%
Photon index: 0.646592     ( -2.83957   1.46195 )
Epeak [keV] : 37.6971      ( -37.6971 -37.6971 )
Norm@50keV  : 5.36278E-03    ( -0.00536272   0.274143 )
------------------------------------------------------------
#Fit statistic : Chi-Squared =          49.66 using 59 PHA bins.
# Reduced chi-squared =         0.8868 for     56 degrees of freedom
# Null hypothesis probability =   7.120362e-01

Photon flux (15-150 keV)    in 69.96 sec: 0.113671 ( -0.0256886  0.026298 ) ph/cm2/s
Energy fluence (15-150 keV)             : 4.39152e-07 ( -1.2252e-07  1.53908e-07 ) ergs/cm2
Band function
Spectral model in the Band function:
------------------------------------------------------------
Parameters  : value       lower 90%   higher 90%
alpha       : -0.656115   ( 0.561258   0.561258 )
beta        : -3.29532    ( 3.37942   4.12482 )
Epeak [keV] : 37.0433      ( -37.0116 75.896 )
Norm@50keV   : 5.38487E-03    ( -0.0061735   126.067 )
------------------------------------------------------------
#Fit statistic : Chi-Squared =          49.68 using 59 PHA bins.
# Reduced chi-squared =         0.9032 for     55 degrees of freedom
# Null hypothesis probability =   6.775136e-01

Photon flux (15-150 keV)    in 69.96 sec:  (    ) ph/cm2/s
Energy fluence (15-150 keV)             : 4.40931e-07 ( 0  0 ) ergs/cm2
S(25-50 keV) vs. S(50-100 keV) plot

S(25-50 keV)  = 1.51e-07
S(50-100 keV) = 1.45e-07
T90 vs. Hardness ratio plot

T90                                   = 61.055999994278 sec.
Hardness ratio (energy fluence ratio) = 0.960265
Color vs. Color plot

Count Ratio  (25-50 keV) / (15-25 keV) = 0.970625
Count Ratio (50-100 keV) / (15-25 keV) = 0.504193
Mask shadow pattern

IMX = -6.394442282432060E-01, IMY = 2.192258205022964E-01
TIME vs. PHA plot around the trigger time

Blue+Cyan dotted lines: Time interval of the scaled map
From 0.000000 to 64.000000
TIME vs. DetID plot around the trigger time

Blue+Cyan dotted lines: Time interval of the scaled map
From 0.000000 to 64.000000
100 us light curve (15-350 keV)

Blue+Cyan dotted lines: Time interval of the scaled map
From 0.000000 to 64.000000
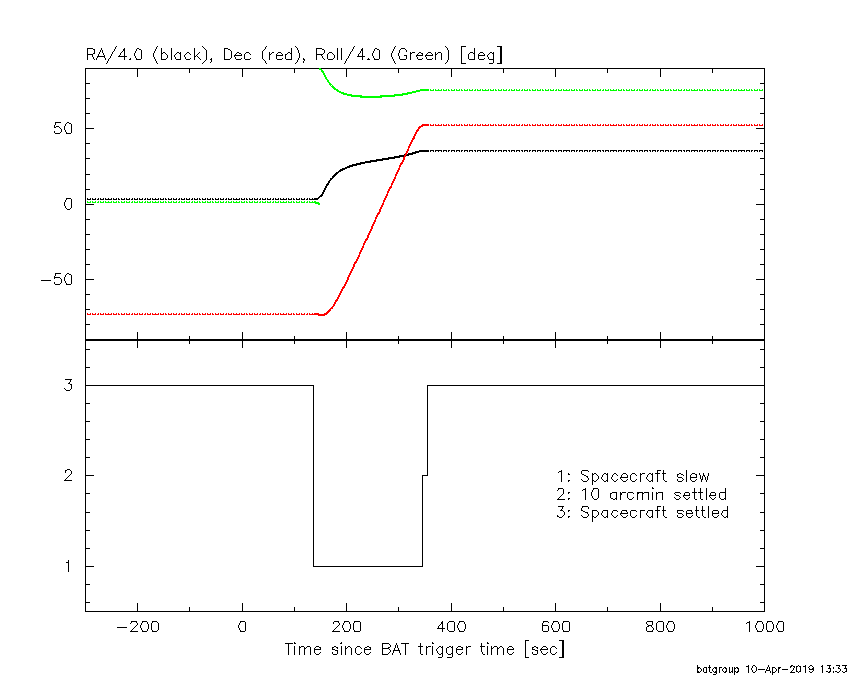
Spacecraft aspect plot
Bright source in the pre-burst/pre-slew/post-slew images
Pre-burst image of 15-350 keV band
Time interval of the image:
-60.000000 -1.236000

# RAcent  DECcent POSerr Theta    Phi  PeakCts   SNR AngSep     Name
#  [deg]    [deg]    ['] [deg]  [deg]                   [']
 96.2908 -32.1747    2.2  57.3   -0.5   2.8770   5.2 ------	UNKNOWN
Pre-slew background subtracted image of 15-350 keV band
Time interval of the image:
-1.236000 68.720000

# RAcent  DECcent POSerr Theta    Phi  PeakCts   SNR AngSep     Name
#  [deg]    [deg]    ['] [deg]  [deg]                   [']
309.4481 -70.6022    2.6  19.2  150.6   0.7515   4.4 ------	UNKNOWN
 50.9860 -54.9562    2.3  23.6  -33.2   0.8387   5.1 ------	UNKNOWN
358.4701 -30.2959    2.1  43.2 -113.3   3.5961   5.5 ------	UNKNOWN
Post-slew image of 15-350 keV band
Time interval of the image:
Plot creation:
Wed Apr 10 13:35:24 EDT 2019