Estimated redshift from machine learning (Ukwatta et al. 2016) - may take a few minute to calcaulte
Image
Pre-slew 15.0-350.0 keV image (Event data)

#   RAcent    DECcent   POSerr    Theta     Phi              Peak Cts       SNR   Name
   98.8334    52.3209   0.0105    25.5514   -87.6260         2.4090997     18.413 TRIG_00903845

Foreground time interval of the image:
-25.544  24.677 (delta_t =  50.221 [sec])
Background time interval of the image:
-162.523 -25.544 (delta_t = 136.979 [sec])
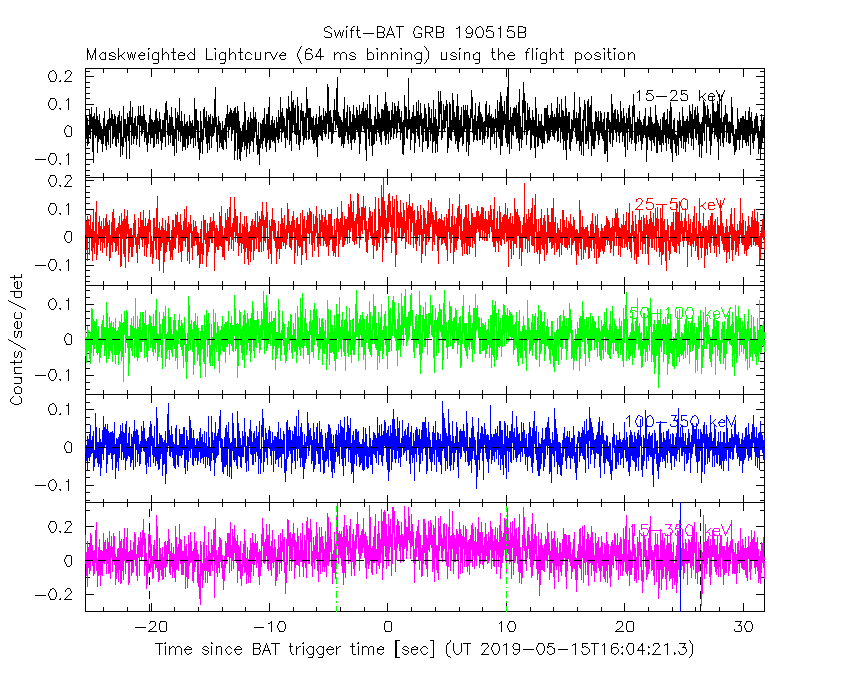
Lightcurves
Notes:
- 1) The mask-weighted light curves are using the flight position.
- 2) Multiple plots of different time binning/intervals are shown to cover all scenarios of short/long GRBs, rate/image triggers, and real/false positives.
- 3) For all the mask-weighted lightcurves, the y-axis units are counts/sec/det where a det is 0.4 x 0.4 = 0.16 sq cm.
- 4) The verticle lines correspond to following: green dotted lines are T50 interval, black dotted lines are T90 interval, blue solid line(s) is a spacecraft slew start time, and orange solid line(s) is a spacecraft slew end time.
- 5) Time of each bin is in the middle of the bin.
1 s binning
From T0-310 s to T0+310 s

From T100_start - 20 s to T100_end + 30 s

Full time interval

64 ms binning
Full time interval

From T100_start to T100_end
From T0-5 sec to T0+5 sec

16 ms binning
From T100_start-5 s to T100_start+5 s

Blue+Cyan dotted lines: Time interval of the scaled map
From 0.000000 to 2.048000
8 ms binning
From T100_start-3 s to T100_start+3 s

Blue+Cyan dotted lines: Time interval of the scaled map
From 0.000000 to 2.048000
2 ms binning
From T100_start-1 s to T100_start+1 s

Blue+Cyan dotted lines: Time interval of the scaled map
From 0.000000 to 2.048000
SN=5 or 10 sec. binning (whichever binning is satisfied first)

SN=5 or 10 sec. binning (T < 200 sec)

Quad-rate summed light curves (from T0-300s to T0+1000s)

Spectral Evolution

Spectra
Notes:
- 1) The fitting includes the systematic errors.
- 2) When the burst includes telescope slew time periods, the fitting uses an average response file made from multiple 5-s response files through out the slew time plus single time preiod for the non-slew times, and weighted by the total counts in the corresponding time period using addrmf. An average response file is needed becuase a spectral fit using the pre-slew DRM will introduce some errors in both a spectral shape and a normalization if the PHA file contains a lot of the slew/post-slew time interval.
- 3) For fits to more complicated models (e.g. a power-law over a cutoff power-law), the BAT team has decided to require a chi-square improvement of more than 6 for each extra dof.
Time averaged spectrum fit using the average DRM
Power-law model

Time interval is from  -25.544 sec. to   31.800 sec.

Spectral model in power-law:
------------------------------------------------------------
Parameters  : value       lower 90%   higher 90%
Photon index: 1.78847     ( -0.151398   0.155141 )
Norm@50keV  : 2.79468E-03    ( -0.000258366   0.00025392 )
------------------------------------------------------------
#Fit statistic : Chi-Squared =          52.77 using 59 PHA bins.
# Reduced chi-squared =         0.9258 for     57 degrees of freedom
# Null hypothesis probability =   6.343175e-01

Photon flux (15-150 keV)    in 57.34 sec: 0.383412 ( -0.031119  0.03116 ) ph/cm2/s
Energy fluence (15-150 keV)             : 1.4761e-06 ( -1.38746e-07  1.4059e-07 ) ergs/cm2
Cutoff power-law model

Time interval is from  -25.544 sec. to   31.800 sec.
Spectral model in the cutoff power-law:
------------------------------------------------------------
Parameters  : value       lower 90%   higher 90%
Photon index: 1.79483     ( -0.347534   0.150979 )
Epeak [keV] : 9999.36      ( -9999.35 -9999.36 )
Norm@50keV  : 2.78477E-03    ( -0.00159807   0.0014235 )
------------------------------------------------------------
#Fit statistic : Chi-Squared =          52.79 using 59 PHA bins.
# Reduced chi-squared =         0.9426 for     56 degrees of freedom
# Null hypothesis probability =   5.972676e-01

Photon flux (15-150 keV)    in 57.34 sec: 0.383829 ( -0.03174  0.03102 ) ph/cm2/s
Energy fluence (15-150 keV)             : 1.4861e-06 ( -1.83268e-07  1.61373e-07 ) ergs/cm2
Band function

Time interval is from  -25.544 sec. to   31.800 sec.


Spectral model in the Band function:
------------------------------------------------------------
Parameters  : value       lower 90%   higher 90%
alpha       :    (     )
beta        :     (     )
Epeak [keV] :       (   )
Norm@50keV   :     (     )
------------------------------------------------------------

Photon flux (15-150 keV)    in  sec:  (    ) ph/cm2/s
Energy fluence (15-150 keV)             : 0 ( 0  0 ) ergs/cm2
Single BB

Spectral model blackbody:
------------------------------------------------------------
Parameters  : value    Lower 90%  Upper 90%
kT [keV]    : 11.1995  (-1.28182  1.48467)
R^2/D10^2   : 0.113318  (-0.0418299   0.0653748)
(R is the radius in km and D10 is the distance to the source in units of 10 kpc)
------------------------------------------------------------
#Fit statistic : Chi-Squared =         109.18 using 59 PHA bins.
# Reduced chi-squared =         1.9155 for     57 degrees of freedom
# Null hypothesis probability =   3.922847e-05

Energy  Fluence     90% Error
[keV]   [erg/cm2]   [erg/cm2]
15- 25  1.709e-07   2.491e-08
25- 50  4.943e-07   4.825e-08
50-150  3.550e-07   7.440e-08
15-150  1.020e-06   1.041e-07
Thermal bremsstrahlung (OTTB)

Spectral model: thermal bremsstrahlung
------------------------------------------------------------
Parameters  : value         Lower 90%    Upper 90%
kT [keV]    : 106.198       (-29.4724      62.5486)
Norm        : 1.66380       (-0.188348     0.206866)
------------------------------------------------------------
#Fit statistic : Chi-Squared =          57.32 using 59 PHA bins.
# Reduced chi-squared =          1.006 for     57 degrees of freedom
# Null hypothesis probability =   4.633041e-01

Energy  Fluence     90% Error
[keV]   [erg/cm2]   [erg/cm2]
15- 25  2.493e-07   3.257e-08
25- 50  4.362e-07   4.140e-08
50-150  7.307e-07   2.527e-07
15-150  1.416e-06   2.933e-07
Double BB

Spectral model: bbodyrad<1> + bbodyrad<2>
------------------------------------------------------------
Parameters  : value         Lower 90%    Upper 90%
kT1 [keV]   : 6.07889        (-1.12664      1.32565)
R1^2/D10^2  : 0.874469        (-0.448548      1.05186)
kT2 [keV]   : 27.8447        (-7.05725      15.374)
R2^2/D10^2  : 3.31973E-03    (-0.00245679   0.00600253)
------------------------------------------------------------
#Fit statistic : Chi-Squared =          52.63 using 59 PHA bins.
# Reduced chi-squared =         0.9570 for     55 degrees of freedom
# Null hypothesis probability =   5.656081e-01

Energy  Fluence     90% Error
[keV]   [erg/cm2]   [erg/cm2]
15- 25  2.749e-07   8.185e-08
25- 50  4.015e-07   9.054e-08
50-150  8.350e-07   3.770e-07
15-150  1.512e-06   4.602e-07
Peak spectrum fit
Power-law model

Time interval is from   -0.388 sec. to    0.612 sec.

Spectral model in power-law:
------------------------------------------------------------
Parameters  : value       lower 90%   higher 90%
Photon index: 1.60393     ( -0.328515   0.34133 )
Norm@50keV  : 8.64114E-03    ( -0.00195108   0.00191694 )
------------------------------------------------------------
#Fit statistic : Chi-Squared =          47.99 using 59 PHA bins.
# Reduced chi-squared =         0.8419 for     57 degrees of freedom
# Null hypothesis probability =   7.967163e-01

Photon flux (15-150 keV)    in 1 sec: 1.11183 ( -0.234474  0.23466 ) ph/cm2/s
Energy fluence (15-150 keV)             : 8.07811e-08 ( -1.91301e-08  1.95094e-08 ) ergs/cm2
Cutoff power-law model

Time interval is from   -0.388 sec. to    0.612 sec.
Spectral model in the cutoff power-law:
------------------------------------------------------------
Parameters  : value       lower 90%   higher 90%
Photon index: 0.148768     ( -2.99748   1.56902 )
Epeak [keV] : 56.1605      ( -15.9804 -56.1457 )
Norm@50keV  : 5.60556E-02    ( -0.0561526   3.034 )
------------------------------------------------------------
#Fit statistic : Chi-Squared =          45.69 using 59 PHA bins.
# Reduced chi-squared =         0.8158 for     56 degrees of freedom
# Null hypothesis probability =   8.358892e-01

Photon flux (15-150 keV)    in 1 sec: 1.07430 ( -0.242485  0.2406 ) ph/cm2/s
Energy fluence (15-150 keV)             : 7.17811e-08 ( -2.05752e-08  2.2293e-08 ) ergs/cm2
Band function

Time interval is from   -0.388 sec. to    0.612 sec.


Spectral model in the Band function:
------------------------------------------------------------
Parameters  : value       lower 90%   higher 90%
alpha       :    (     )
beta        :     (     )
Epeak [keV] :       (   )
Norm@50keV   :     (     )
------------------------------------------------------------

Photon flux (15-150 keV)    in  sec:  (    ) ph/cm2/s
Energy fluence (15-150 keV)             : 0 ( 0  0 ) ergs/cm2
Single BB

Spectral model blackbody:
------------------------------------------------------------
Parameters  : value    Lower 90%  Upper 90%
kT [keV]    : 12.1889  (-2.36358  3.20483)
R^2/D10^2   : 0.277428  (-0.160708   0.331016)
(R is the radius in km and D10 is the distance to the source in units of 10 kpc)
------------------------------------------------------------
#Fit statistic : Chi-Squared =          46.94 using 59 PHA bins.
# Reduced chi-squared =         0.8236 for     57 degrees of freedom
# Null hypothesis probability =   8.264525e-01

Energy  Fluence     90% Error
[keV]   [erg/cm2]   [erg/cm2]
15- 25  8.728e-09   3.574e-09
25- 50  2.797e-08   9.250e-09
50-150  2.525e-08   1.160e-08
15-150  6.195e-08   2.071e-08
Thermal bremsstrahlung (OTTB)

Spectral model: thermal bremsstrahlung
------------------------------------------------------------
Parameters  : value         Lower 90%    Upper 90%
kT [keV]    : 154.097       (-84.8475      -151.59)
Norm        : 4.64868       (-1.02278     1.39526)
------------------------------------------------------------
#Fit statistic : Chi-Squared =          46.85 using 59 PHA bins.
# Reduced chi-squared =         0.8220 for     57 degrees of freedom
# Null hypothesis probability =   8.288922e-01

Energy  Fluence     90% Error
[keV]   [erg/cm2]   [erg/cm2]
15- 25  1.191e-08   6.825e-09
25- 50  2.217e-08   1.250e-08
50-150  4.423e-08   2.725e-08
15-150  7.831e-08   4.562e-08
Double BB

Spectral model: bbodyrad<1> + bbodyrad<2>
------------------------------------------------------------
Parameters  : value         Lower 90%    Upper 90%
kT1 [keV]   : 9.50552        (-10.1616      3.75557)
R1^2/D10^2  : 0.528924        (-0.456275      -0.456275)
kT2 [keV]   : 30.1253        (-46.6896      -46.6896)
R2^2/D10^2  : 5.20996E-03    (-0.00125397   0.370511)
------------------------------------------------------------
#Fit statistic : Chi-Squared =          44.71 using 59 PHA bins.
# Reduced chi-squared =         0.8129 for     55 degrees of freedom
# Null hypothesis probability =   8.378138e-01

Energy  Fluence     90% Error
[keV]   [erg/cm2]   [erg/cm2]
15- 25  1.028e-08   6.510e-09
25- 50  2.661e-08   1.644e-08
50-150  3.910e-08   2.002e-08
15-150  7.600e-08   4.068e-08
Pre-slew spectrum (Pre-slew PHA with pre-slew DRM)
Power-law model

Spectral model in power-law:
------------------------------------------------------------
Parameters  : value       lower 90%   higher 90%
Photon index: 1.74250     ( -0.149669   0.152884 )
Norm@50keV  : 3.02531E-03    ( -0.000273871   0.000269703 )
------------------------------------------------------------
#Fit statistic : Chi-Squared =          52.77 using 59 PHA bins.
# Reduced chi-squared =         0.9257 for     57 degrees of freedom
# Null hypothesis probability =   6.345601e-01

Photon flux (15-150 keV)    in 50.22 sec: 0.407947 ( -0.0331963  0.0332432 ) ph/cm2/s
Energy fluence (15-150 keV)             : 1.40254e-06 ( -1.31386e-07  1.3285e-07 ) ergs/cm2
Cutoff power-law model

Spectral model in the cutoff power-law:
------------------------------------------------------------
Parameters  : value       lower 90%   higher 90%
Photon index: 1.74813     ( -0.259964   0.149278 )
Epeak [keV] : 9999.36      ( -10000 -10000 )
Norm@50keV  : 3.01712E-03    (     )
------------------------------------------------------------
#Fit statistic : Chi-Squared =          52.77 using 59 PHA bins.
# Reduced chi-squared =         0.9424 for     56 degrees of freedom
# Null hypothesis probability =   5.977595e-01

Photon flux (15-150 keV)    in 50.22 sec: 0.408289 ( -0.016837  0.032838 ) ph/cm2/s
Energy fluence (15-150 keV)             : 1.39688e-06 ( -1.26338e-07  1.35956e-07 ) ergs/cm2
Band function

Spectral model in the Band function:
------------------------------------------------------------
Parameters  : value       lower 90%   higher 90%
alpha       :    (     )
beta        :     (     )
Epeak [keV] :       (   )
Norm@50keV   :     (     )
------------------------------------------------------------

Photon flux (15-150 keV)    in  sec:  (    ) ph/cm2/s
Energy fluence (15-150 keV)             : 0 ( 0  0 ) ergs/cm2
S(25-50 keV) vs. S(50-100 keV) plot

S(25-50 keV)  = 4.14e-07
S(50-100 keV) = 4.79e-07
T90 vs. Hardness ratio plot

T90                                   = 46.5119999647141 sec.
Hardness ratio (energy fluence ratio) = 1.157
Color vs. Color plot
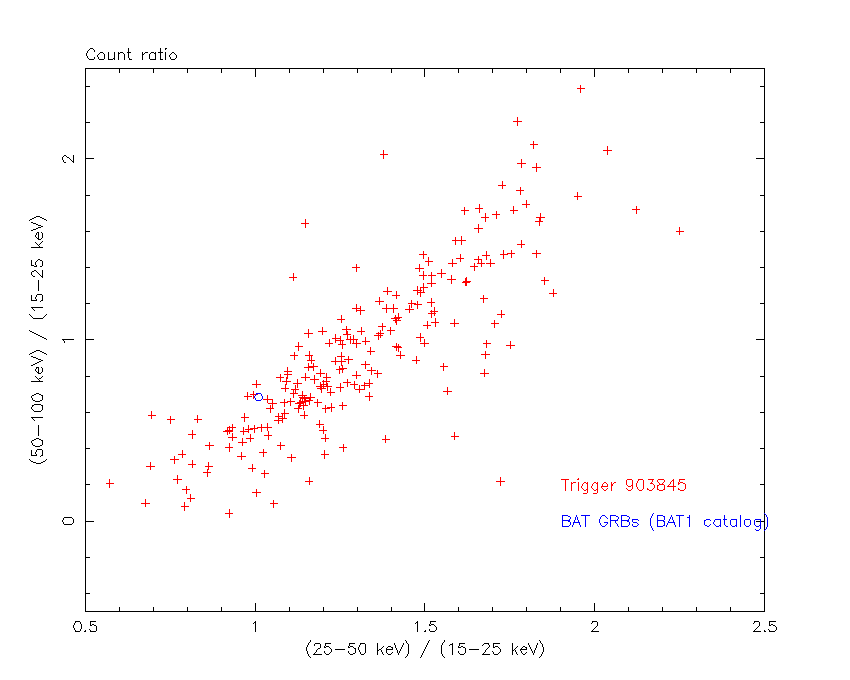
Count Ratio  (25-50 keV) / (15-25 keV) = 1.00995
Count Ratio (50-100 keV) / (15-25 keV) = 0.684643
Mask shadow pattern

IMX = 1.980326264263598E-02, IMY = 4.776668917994986E-01
TIME vs. PHA plot around the trigger time

Blue+Cyan dotted lines: Time interval of the scaled map
From 0.000000 to 2.048000
TIME vs. DetID plot around the trigger time

Blue+Cyan dotted lines: Time interval of the scaled map
From 0.000000 to 2.048000
100 us light curve (15-350 keV)

Blue+Cyan dotted lines: Time interval of the scaled map
From 0.000000 to 2.048000
Spacecraft aspect plot

Bright source in the pre-burst/pre-slew/post-slew images
Pre-burst image of 15-350 keV band
Time interval of the image:
-162.523410 -25.544000

# RAcent  DECcent POSerr Theta    Phi  PeakCts   SNR AngSep     Name
#  [deg]    [deg]    ['] [deg]  [deg]                   [']
267.3893  63.9465    2.6  56.5   10.4   6.7941   4.5 ------	UNKNOWN
123.3264  -1.3397    2.6  55.7 -172.9   6.2197   4.4 ------	UNKNOWN
 90.2546  29.0784    3.4  43.9 -116.2   4.2795   3.4 ------	UNKNOWN
 77.7853  45.7517    2.3  40.8  -87.7   6.1706   4.9 ------	UNKNOWN
Pre-slew background subtracted image of 15-350 keV band
Time interval of the image:
-25.544000 24.676600

# RAcent  DECcent POSerr Theta    Phi  PeakCts   SNR AngSep     Name
#  [deg]    [deg]    ['] [deg]  [deg]                   [']
146.3655  -1.0730    2.3  53.5  158.9   3.2931   5.0 ------	UNKNOWN
328.8048  70.8447    2.8  56.7  -17.7   1.7817   4.1 ------	UNKNOWN
 98.8334  52.3209    0.6  25.6  -87.6   2.4087  18.4 ------	UNKNOWN
Post-slew image of 15-350 keV band
Time interval of the image:
71.676590 710.250400
720.776000 754.276620

# RAcent  DECcent POSerr Theta    Phi  PeakCts   SNR AngSep     Name
#  [deg]    [deg]    ['] [deg]  [deg]                   [']
 83.6450  22.0045    0.8  32.5 -128.2  26.3478  14.3    0.9	Crab
136.5739  11.9313    2.5  50.4  153.9  32.2741   4.7 ------	UNKNOWN
313.3834  68.5382    2.4  56.5   10.4  30.6050   4.9 ------	UNKNOWN
 71.3704  15.0635    2.6  43.2 -114.5  26.2297   4.5 ------	UNKNOWN
 72.2541  13.9919    2.2  43.8 -116.3  31.0534   5.2 ------	UNKNOWN
Plot creation:
Tue Jul 16 15:49:47 EDT 2019