Estimated redshift from machine learning (Ukwatta et al. 2016) - may take a few minute to calcaulte
Image
Pre-slew 15.0-350.0 keV image (Event data)
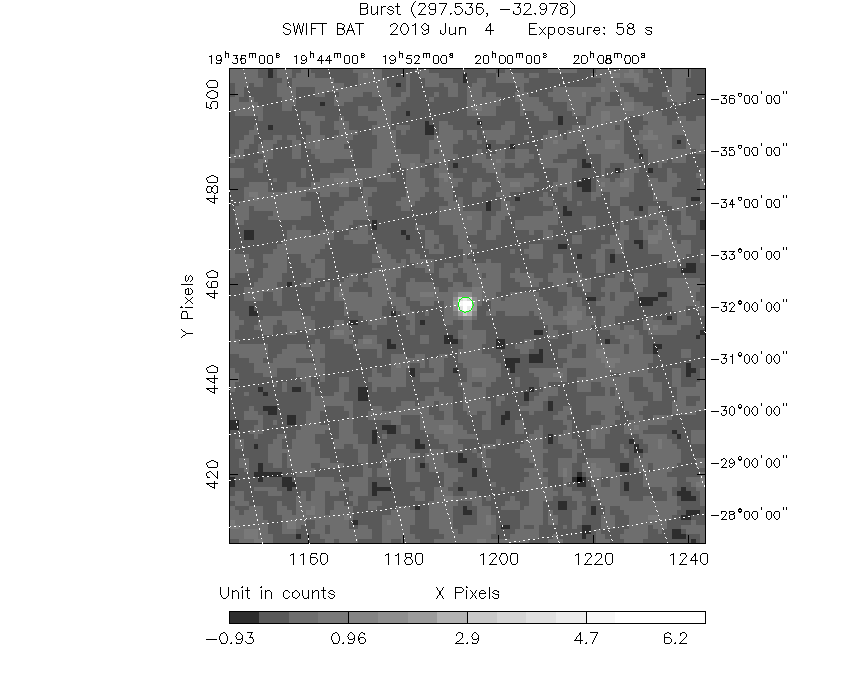
#   RAcent    DECcent   POSerr    Theta     Phi              Peak Cts       SNR   Name
  297.5452   -32.9748   0.0063    33.4275   176.1950         6.7585428     30.379 TRIG_00906654

Foreground time interval of the image:
-39.776  18.685 (delta_t =  58.461 [sec])
Background time interval of the image:
-239.816 -39.776 (delta_t = 200.040 [sec])
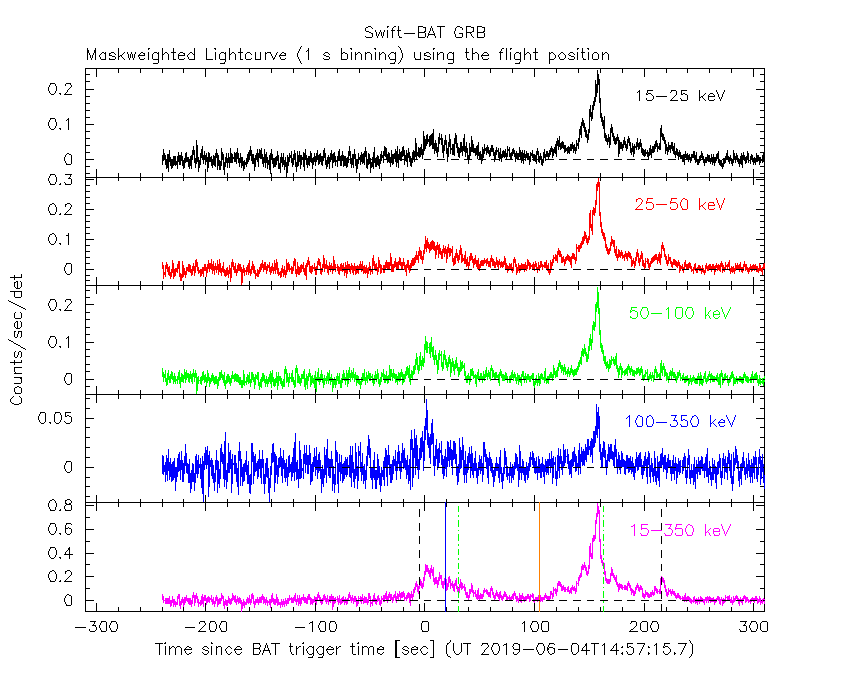
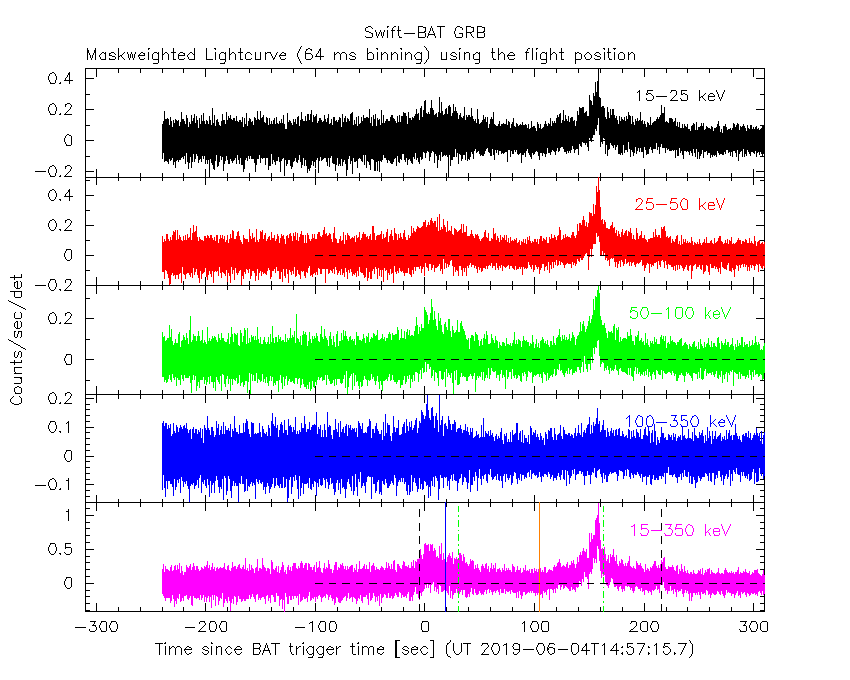
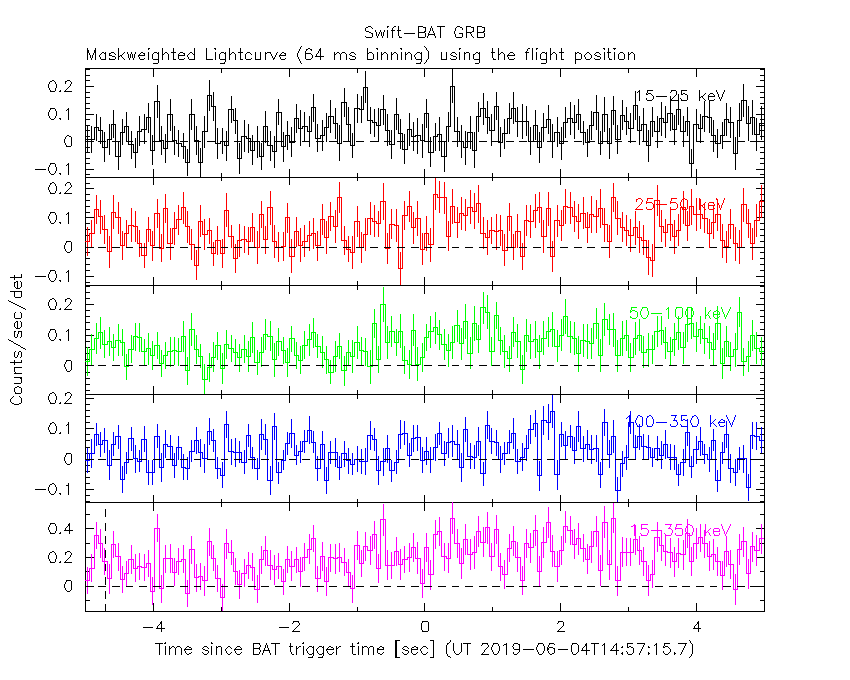
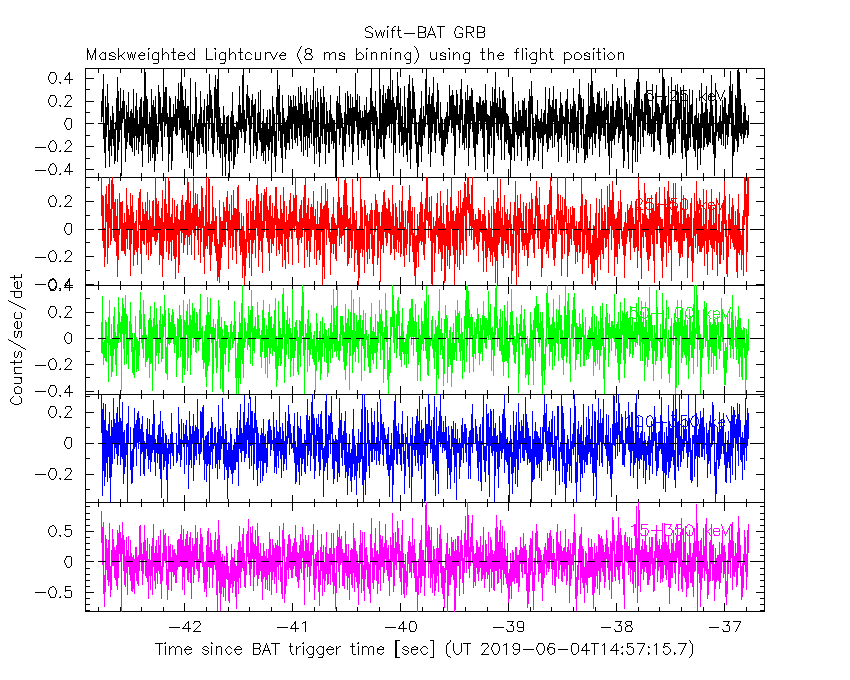
Lightcurves
Notes:
- 1) The mask-weighted light curves are using the flight position.
- 2) Multiple plots of different time binning/intervals are shown to cover all scenarios of short/long GRBs, rate/image triggers, and real/false positives.
- 3) For all the mask-weighted lightcurves, the y-axis units are counts/sec/det where a det is 0.4 x 0.4 = 0.16 sq cm.
- 4) The verticle lines correspond to following: green dotted lines are T50 interval, black dotted lines are T90 interval, blue solid line(s) is a spacecraft slew start time, and orange solid line(s) is a spacecraft slew end time.
- 5) Time of each bin is in the middle of the bin.
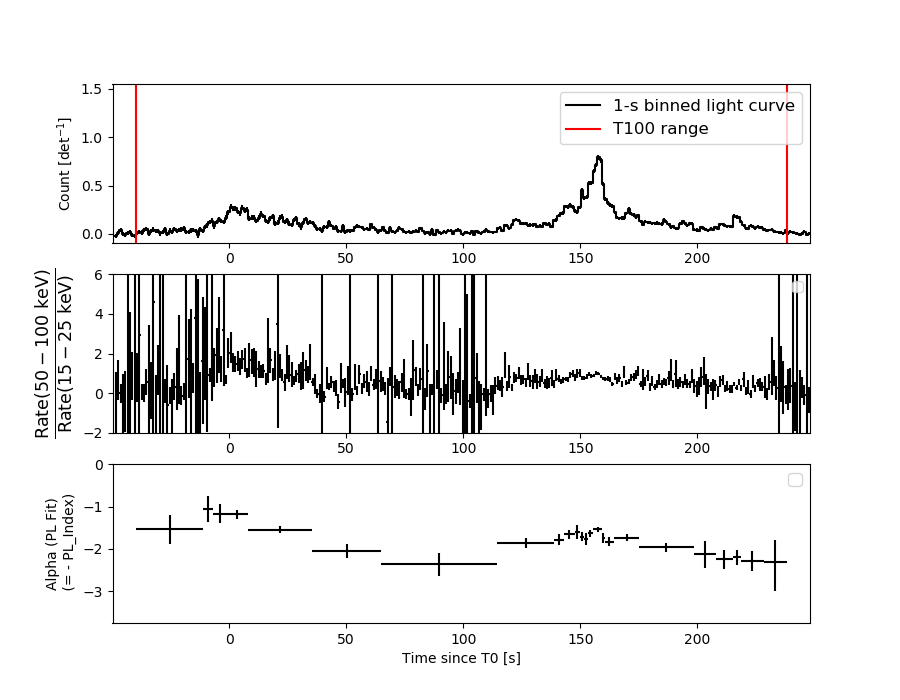
1 s binning
From T0-310 s to T0+310 s
From T100_start - 20 s to T100_end + 30 s
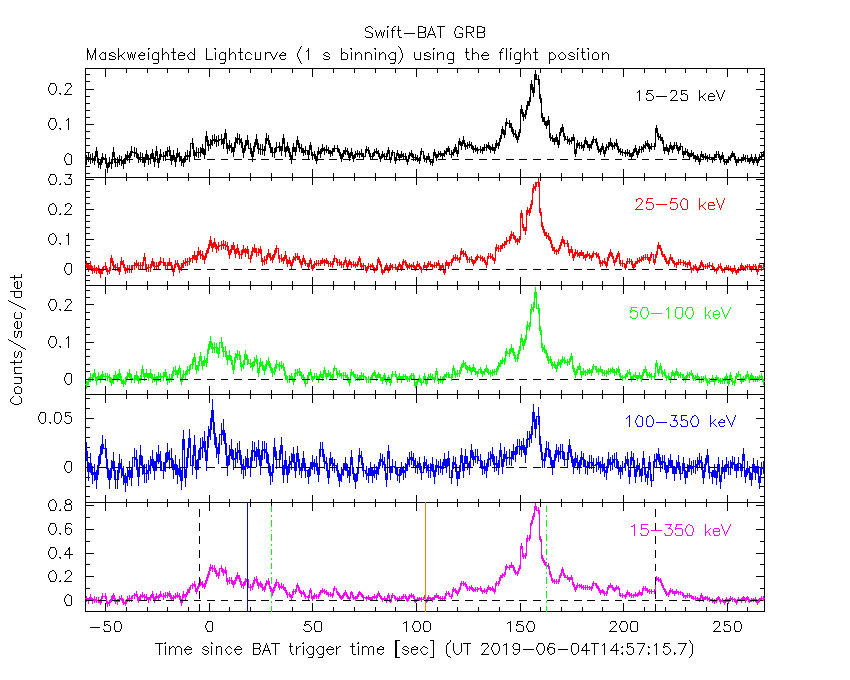
Full time interval

64 ms binning
Full time interval
From T100_start to T100_end

From T0-5 sec to T0+5 sec
16 ms binning
From T100_start-5 s to T100_start+5 s

Blue+Cyan dotted lines: Time interval of the scaled map
From 0.000000 to 1.024000
8 ms binning
From T100_start-3 s to T100_start+3 s
Blue+Cyan dotted lines: Time interval of the scaled map
From 0.000000 to 1.024000
2 ms binning
From T100_start-1 s to T100_start+1 s

Blue+Cyan dotted lines: Time interval of the scaled map
From 0.000000 to 1.024000
SN=5 or 10 sec. binning (whichever binning is satisfied first)
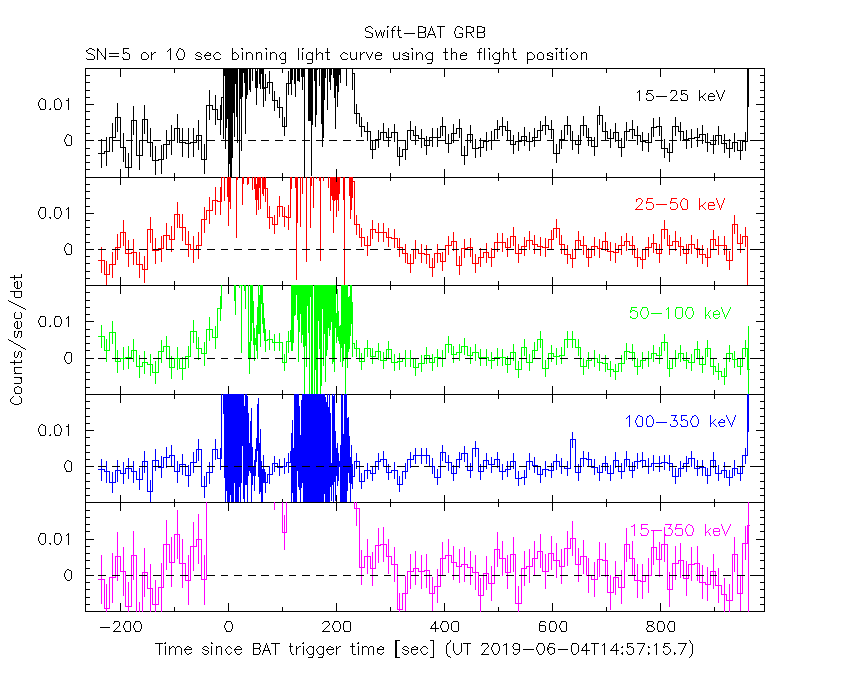
SN=5 or 10 sec. binning (T < 200 sec)

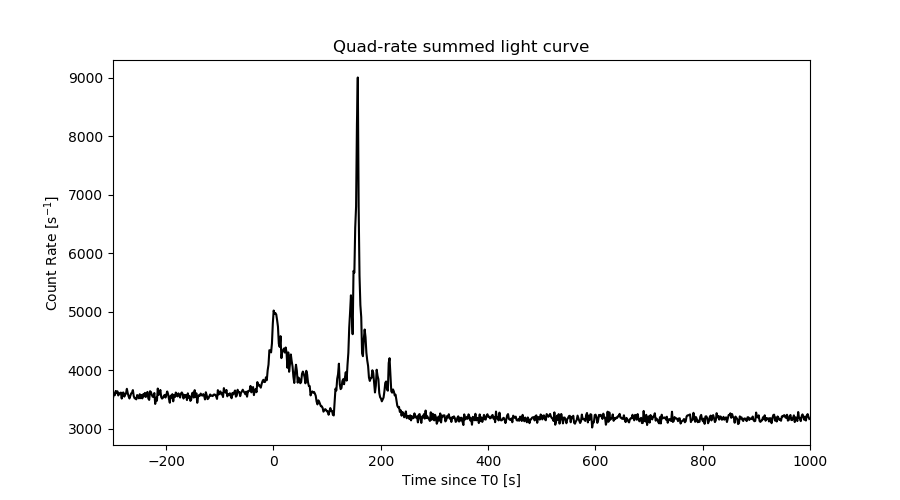
Quad-rate summed light curves (from T0-300s to T0+1000s)
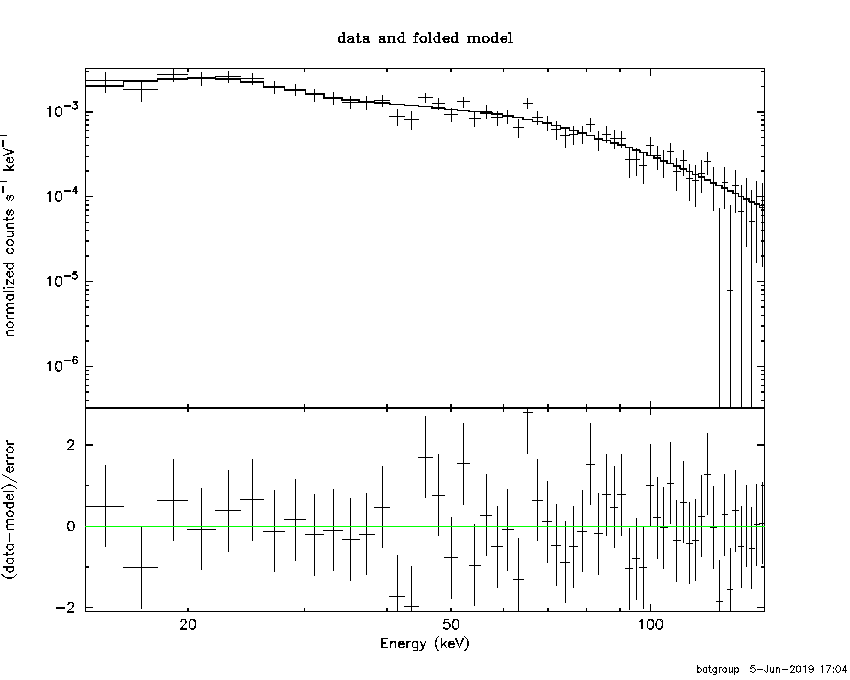
Spectral Evolution
Spectra
Notes:
- 1) The fitting includes the systematic errors.
- 2) When the burst includes telescope slew time periods, the fitting uses an average response file made from multiple 5-s response files through out the slew time plus single time preiod for the non-slew times, and weighted by the total counts in the corresponding time period using addrmf. An average response file is needed becuase a spectral fit using the pre-slew DRM will introduce some errors in both a spectral shape and a normalization if the PHA file contains a lot of the slew/post-slew time interval.
- 3) For fits to more complicated models (e.g. a power-law over a cutoff power-law), the BAT team has decided to require a chi-square improvement of more than 6 for each extra dof.
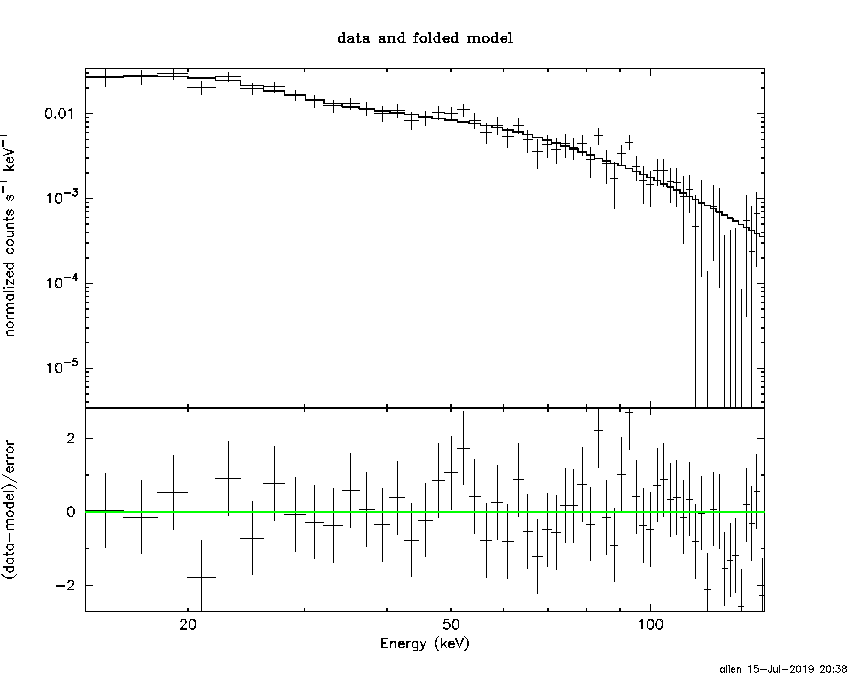
Time averaged spectrum fit using the average DRM
Power-law model
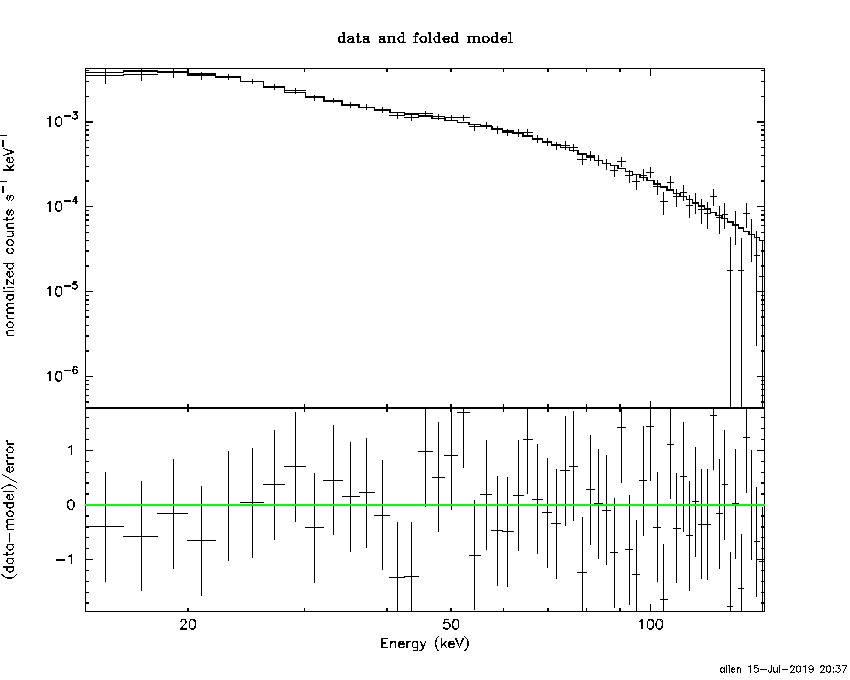
Time interval is from  -39.776 sec. to  238.040 sec.

Spectral model in power-law:
------------------------------------------------------------
Parameters  : value       lower 90%   higher 90%
Photon index: 1.75008     ( -0.0442472   0.0443668 )
Norm@50keV  : 6.66897E-03    ( -0.000145416   0.000145332 )
------------------------------------------------------------
#Fit statistic : Chi-Squared =          40.56 using 59 PHA bins.
# Reduced chi-squared =         0.7115 for     57 degrees of freedom
# Null hypothesis probability =   9.510564e-01

Photon flux (15-150 keV)    in 277.8 sec: 0.901824 ( -0.022981  0.0231 ) ph/cm2/s
Energy fluence (15-150 keV)             : 1.70975e-05 ( -3.80328e-07  3.80542e-07 ) ergs/cm2
Cutoff power-law model

Time interval is from  -39.776 sec. to  238.040 sec.
Spectral model in the cutoff power-law:
------------------------------------------------------------
Parameters  : value       lower 90%   higher 90%
Photon index: 1.64927     ( -0.177514   0.127864 )
Epeak [keV] : 186.252      ( -111.158 -186.252 )
Norm@50keV  : 7.42494E-03    ( -0.000859264   0.00150103 )
------------------------------------------------------------
#Fit statistic : Chi-Squared =          39.56 using 59 PHA bins.
# Reduced chi-squared =         0.7065 for     56 degrees of freedom
# Null hypothesis probability =   9.528741e-01

Photon flux (15-150 keV)    in 277.8 sec: 0.892935 ( -0.027148  0.02734 ) ph/cm2/s
Energy fluence (15-150 keV)             : 1.69521e-05 ( -4.51736e-07  4.4246e-07 ) ergs/cm2
Band function

Time interval is from  -39.776 sec. to  238.040 sec.


Spectral model in the Band function:
------------------------------------------------------------
Parameters  : value       lower 90%   higher 90%
alpha       :    (     )
beta        :     (     )
Epeak [keV] :       (   )
Norm@50keV   :     (     )
------------------------------------------------------------

Photon flux (15-150 keV)    in  sec:  (    ) ph/cm2/s
Energy fluence (15-150 keV)             : 0 ( 0  0 ) ergs/cm2
Single BB
Spectral model blackbody:
------------------------------------------------------------
Parameters  : value    Lower 90%  Upper 90%
kT [keV]    : 14.8198  (  )
R^2/D10^2   : 9.30395E-02  (   )
(R is the radius in km and D10 is the distance to the source in units of 10 kpc)
------------------------------------------------------------
#Fit statistic : Chi-Squared =         503.39 using 59 PHA bins.
# Reduced chi-squared =         8.8314 for     57 degrees of freedom
# Null hypothesis probability =   1.012142e-72

Energy  Fluence     90% Error
[keV]   [erg/cm2]   [erg/cm2]
15- 25  1.191e-06   5.445e-08
25- 50  4.678e-06   1.306e-07
50-150  6.955e-06   2.889e-07
15-150  1.282e-05   3.209e-07
Thermal bremsstrahlung (OTTB)

Spectral model: thermal bremsstrahlung
------------------------------------------------------------
Parameters  : value         Lower 90%    Upper 90%
kT [keV]    : 132.783       (-11.8879      18.6085)
Norm        : 3.67749       (-0.129847     0.11305)
------------------------------------------------------------
#Fit statistic : Chi-Squared =          50.78 using 59 PHA bins.
# Reduced chi-squared =         0.8909 for     57 degrees of freedom
# Null hypothesis probability =   7.061306e-01

Energy  Fluence     90% Error
[keV]   [erg/cm2]   [erg/cm2]
15- 25  2.538e-06   1.324e-07
25- 50  4.671e-06   2.195e-07
50-150  9.038e-06   1.925e-06
15-150  1.625e-05   2.104e-06
Double BB
Spectral model: bbodyrad<1> + bbodyrad<2>
------------------------------------------------------------
Parameters  : value         Lower 90%    Upper 90%
kT1 [keV]   : 6.66889        (-0.534919      0.570952)
R1^2/D10^2  : 1.20518        (-0.317877      0.463322)
kT2 [keV]   : 24.6335        (-1.78212      2.18441)
R2^2/D10^2  : 1.17297E-02    (-0.00321502   0.00392299)
------------------------------------------------------------
#Fit statistic : Chi-Squared =          52.24 using 59 PHA bins.
# Reduced chi-squared =         0.9498 for     55 degrees of freedom
# Null hypothesis probability =   5.808356e-01

Energy  Fluence     90% Error
[keV]   [erg/cm2]   [erg/cm2]
15- 25  2.615e-06   1.928e-07
25- 50  4.772e-06   2.222e-07
50-150  9.179e-06   5.014e-07
15-150  1.656e-05   6.848e-07
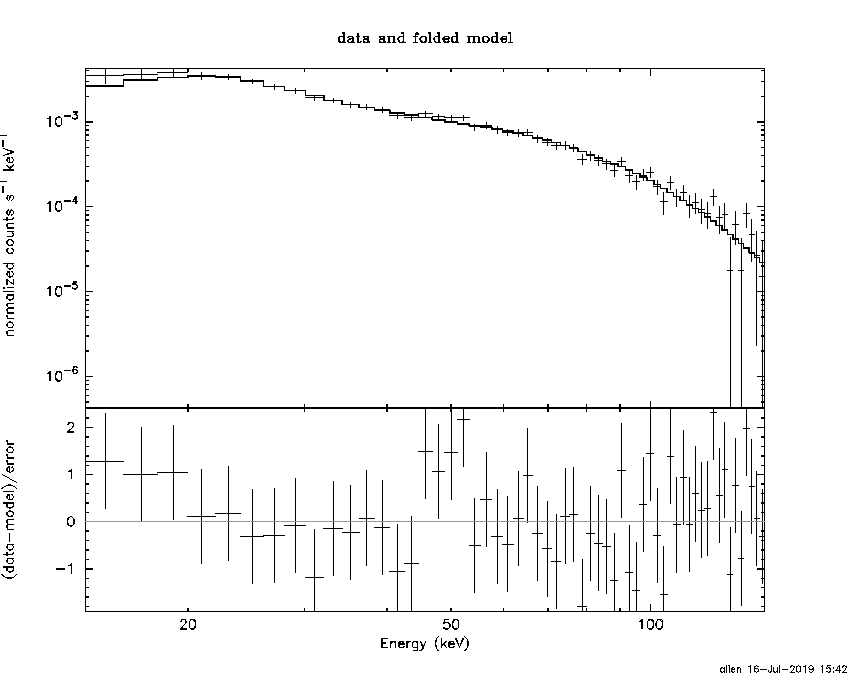
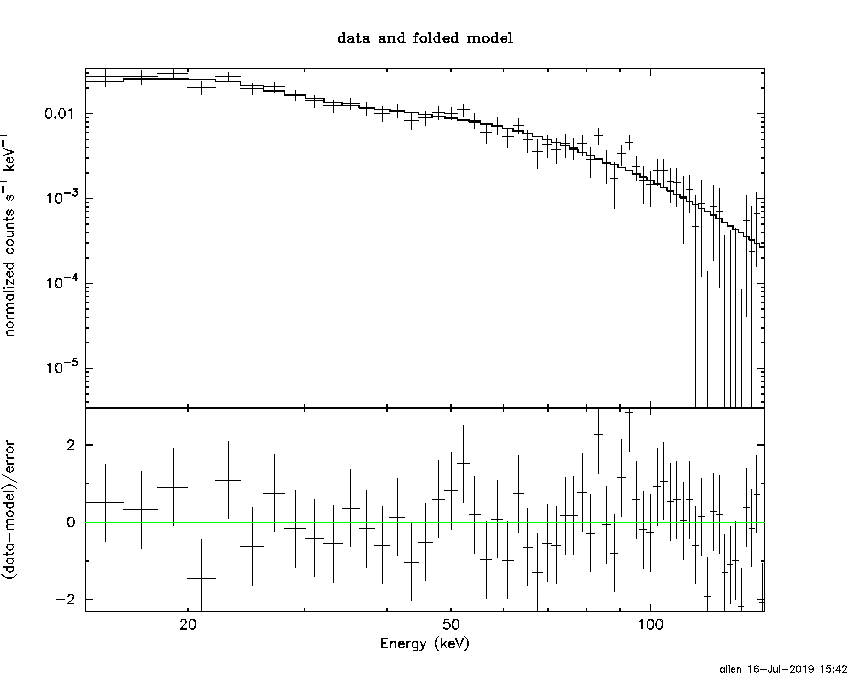
Peak spectrum fit
Power-law model
Time interval is from  157.536 sec. to  158.536 sec.

Spectral model in power-law:
------------------------------------------------------------
Parameters  : value       lower 90%   higher 90%
Photon index: 1.60565     ( -0.0930581   0.0945291 )
Norm@50keV  : 5.21887E-02    ( -0.00286774   0.00285286 )
------------------------------------------------------------
#Fit statistic : Chi-Squared =          56.23 using 59 PHA bins.
# Reduced chi-squared =         0.9865 for     57 degrees of freedom
# Null hypothesis probability =   5.039996e-01

Photon flux (15-150 keV)    in 1 sec: 6.71850 ( -0.35628  0.35662 ) ph/cm2/s
Energy fluence (15-150 keV)             : 4.87809e-07 ( -2.88541e-08  2.90356e-08 ) ergs/cm2
Cutoff power-law model

Time interval is from  157.536 sec. to  158.536 sec.
Spectral model in the cutoff power-law:
------------------------------------------------------------
Parameters  : value       lower 90%   higher 90%
Photon index: 1.27212     ( -0.370188   0.341828 )
Epeak [keV] : 111.075      ( -34.4655 4377.18 )
Norm@50keV  : 7.64873E-02    ( -0.0236904   0.0390779 )
------------------------------------------------------------
#Fit statistic : Chi-Squared =          53.44 using 59 PHA bins.
# Reduced chi-squared =         0.9543 for     56 degrees of freedom
# Null hypothesis probability =   5.722488e-01

Photon flux (15-150 keV)    in 1 sec: 6.60575 ( -0.3734  0.37367 ) ph/cm2/s
Energy fluence (15-150 keV)             : 4.77035e-07 ( -3.10811e-08  3.1101e-08 ) ergs/cm2
Band function

Time interval is from  157.536 sec. to  158.536 sec.


Spectral model in the Band function:
------------------------------------------------------------
Parameters  : value       lower 90%   higher 90%
alpha       :    (     )
beta        :     (     )
Epeak [keV] :       (   )
Norm@50keV   :     (     )
------------------------------------------------------------

Photon flux (15-150 keV)    in  sec:  (    ) ph/cm2/s
Energy fluence (15-150 keV)             : 0 ( 0  0 ) ergs/cm2
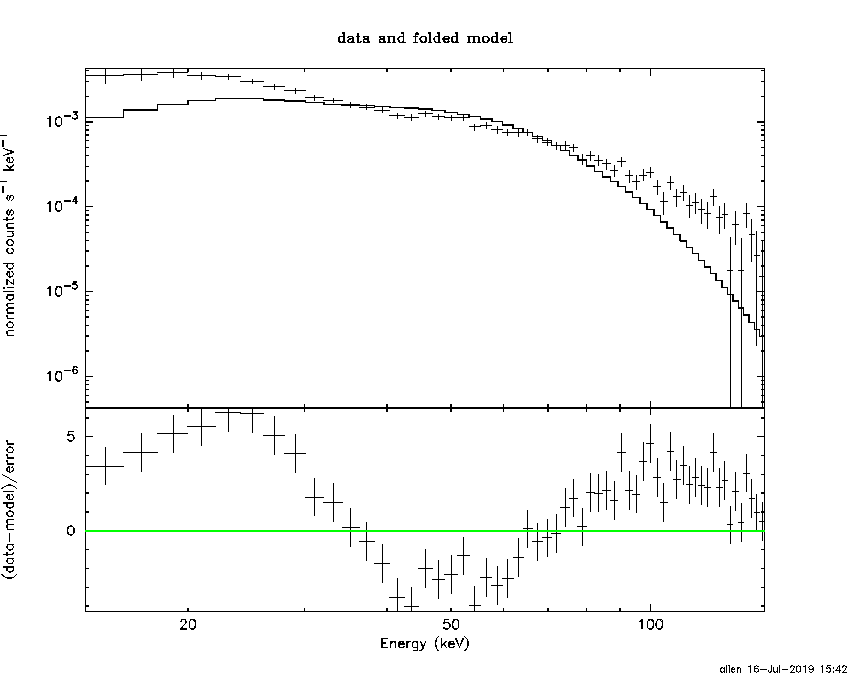
Single BB

Spectral model blackbody:
------------------------------------------------------------
Parameters  : value    Lower 90%  Upper 90%
kT [keV]    : 14.4757  (  )
R^2/D10^2   : 0.836486  (   )
(R is the radius in km and D10 is the distance to the source in units of 10 kpc)
------------------------------------------------------------
#Fit statistic : Chi-Squared =         142.17 using 59 PHA bins.
# Reduced chi-squared =         2.4942 for     57 degrees of freedom
# Null hypothesis probability =   3.161092e-09

Energy  Fluence     90% Error
[keV]   [erg/cm2]   [erg/cm2]
15- 25  3.689e-08   3.510e-09
25- 50  1.418e-07   9.000e-09
50-150  1.989e-07   2.090e-08
15-150  3.775e-07   2.470e-08
Thermal bremsstrahlung (OTTB)
Spectral model: thermal bremsstrahlung
------------------------------------------------------------
Parameters  : value         Lower 90%    Upper 90%
kT [keV]    : 178.768       (-42.5579      -178.507)
Norm        : 27.3524       (-1.52499     1.64029)
------------------------------------------------------------
#Fit statistic : Chi-Squared =          53.60 using 59 PHA bins.
# Reduced chi-squared =         0.9404 for     57 degrees of freedom
# Null hypothesis probability =   6.032815e-01

Energy  Fluence     90% Error
[keV]   [erg/cm2]   [erg/cm2]
15- 25  6.903e-08   5.860e-09
25- 50  1.310e-07   1.769e-08
50-150  2.768e-07   1.043e-07
15-150  4.769e-07   1.183e-07
Double BB
Spectral model: bbodyrad<1> + bbodyrad<2>
------------------------------------------------------------
Parameters  : value         Lower 90%    Upper 90%
kT1 [keV]   : 5.98875        (-1.06312      1.20356)
R1^2/D10^2  : 12.0335        (-5.80448      13.8852)
kT2 [keV]   : 23.1781        (-2.88042      3.90799)
R2^2/D10^2  : 0.129902    (-0.0575192   0.0851425)
------------------------------------------------------------
#Fit statistic : Chi-Squared =          51.76 using 59 PHA bins.
# Reduced chi-squared =         0.9410 for     55 degrees of freedom
# Null hypothesis probability =   5.993398e-01

Energy  Fluence     90% Error
[keV]   [erg/cm2]   [erg/cm2]
15- 25  6.979e-08   1.549e-08
25- 50  1.255e-07   1.829e-08
50-150  2.806e-07   4.830e-08
15-150  4.758e-07   6.620e-08
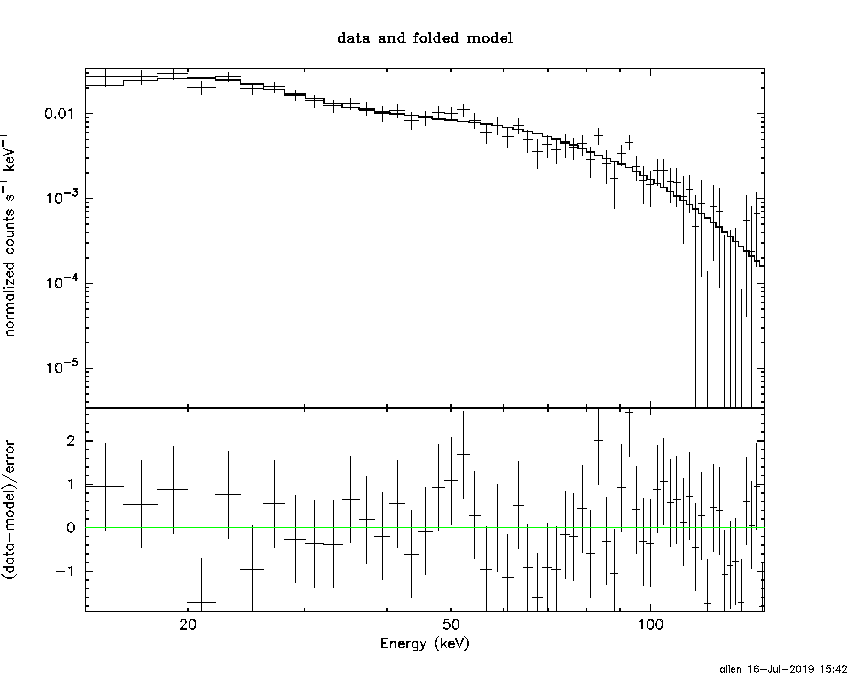
Pre-slew spectrum (Pre-slew PHA with pre-slew DRM)
Power-law model

Spectral model in power-law:
------------------------------------------------------------
Parameters  : value       lower 90%   higher 90%
Photon index: 1.32577     ( -0.0877571   0.0872908 )
Norm@50keV  : 7.10330E-03    ( -0.000332191   0.000332114 )
------------------------------------------------------------
#Fit statistic : Chi-Squared =          45.01 using 59 PHA bins.
# Reduced chi-squared =         0.7896 for     57 degrees of freedom
# Null hypothesis probability =   8.748494e-01

Photon flux (15-150 keV)    in 58.46 sec: 0.851596 ( -0.0429952  0.0432022 ) ph/cm2/s
Energy fluence (15-150 keV)             : 4.07832e-06 ( -2.03991e-07  2.04773e-07 ) ergs/cm2
Cutoff power-law model

Spectral model in the cutoff power-law:
------------------------------------------------------------
Parameters  : value       lower 90%   higher 90%
Photon index: 1.20909     ( -0.352959   0.116158 )
Epeak [keV] : 354.609      ( -437.748 -586.468 )
Norm@50keV  : 8.01323E-03    ( -0.00164116   0.00311778 )
------------------------------------------------------------
#Fit statistic : Chi-Squared =          45.09 using 59 PHA bins.
# Reduced chi-squared =         0.8051 for     56 degrees of freedom
# Null hypothesis probability =   8.514884e-01

Photon flux (15-150 keV)    in 58.46 sec: 0.847671 ( -0.046187  0.045668 ) ph/cm2/s
Energy fluence (15-150 keV)             : 4.06329e-06 ( -2.16799e-07  2.14659e-07 ) ergs/cm2
Band function
Spectral model in the Band function:
------------------------------------------------------------
Parameters  : value       lower 90%   higher 90%
alpha       :    (     )
beta        :     (     )
Epeak [keV] :       (   )
Norm@50keV   :     (     )
------------------------------------------------------------

Photon flux (15-150 keV)    in  sec:  (    ) ph/cm2/s
Energy fluence (15-150 keV)             : 0 ( 0  0 ) ergs/cm2
S(25-50 keV) vs. S(50-100 keV) plot

S(25-50 keV)  = 4.72e-06
S(50-100 keV) = 5.61e-06
T90 vs. Hardness ratio plot

T90                                   = 220.175999879837 sec.
Hardness ratio (energy fluence ratio) = 1.18856
Color vs. Color plot
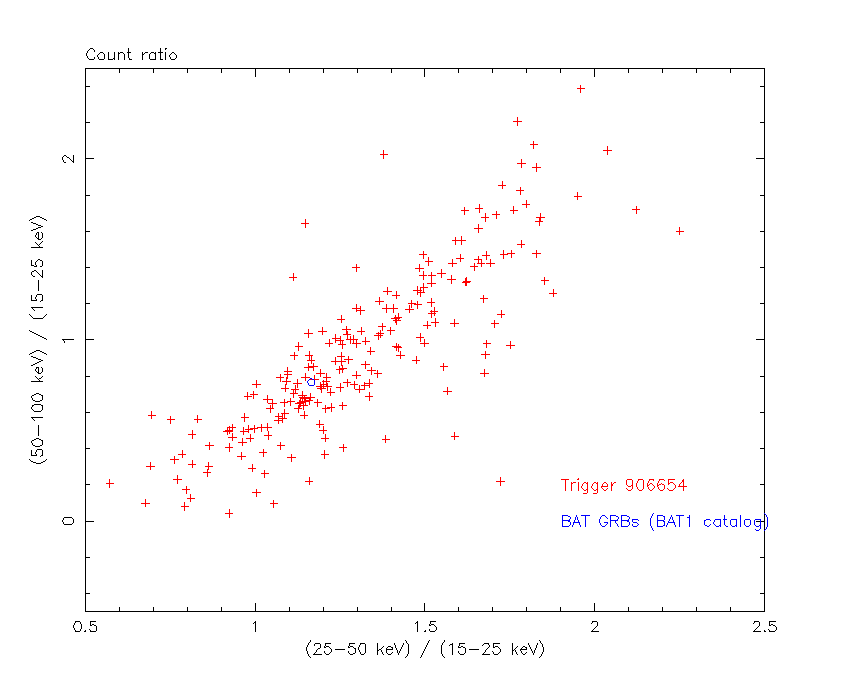
Count Ratio  (25-50 keV) / (15-25 keV) = 1.16486
Count Ratio (50-100 keV) / (15-25 keV) = 0.766754
Mask shadow pattern

IMX = -6.586133664231520E-01, IMY = -4.380263022776738E-02
TIME vs. PHA plot around the trigger time
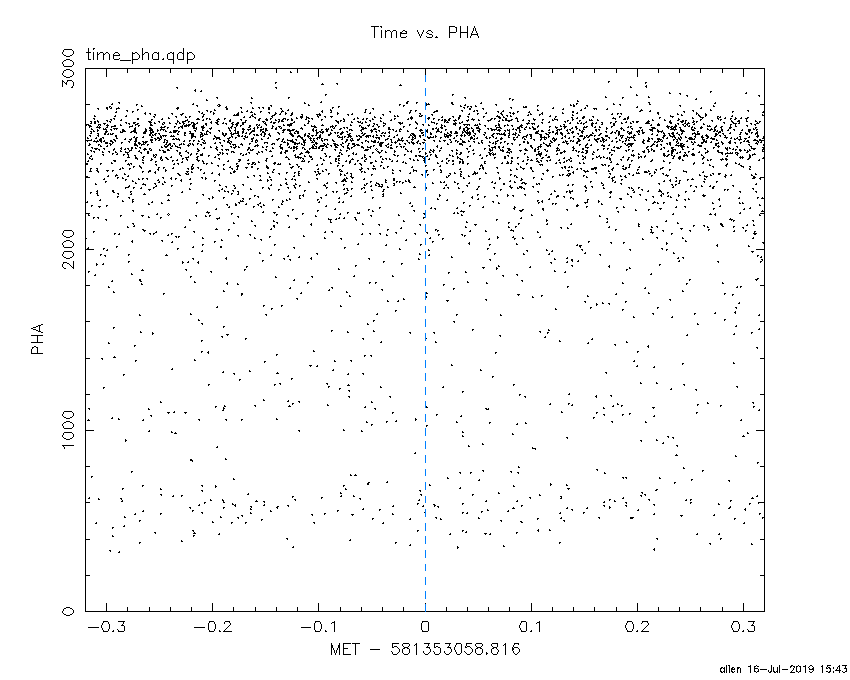
Blue+Cyan dotted lines: Time interval of the scaled map
From 0.000000 to 1.024000
TIME vs. DetID plot around the trigger time
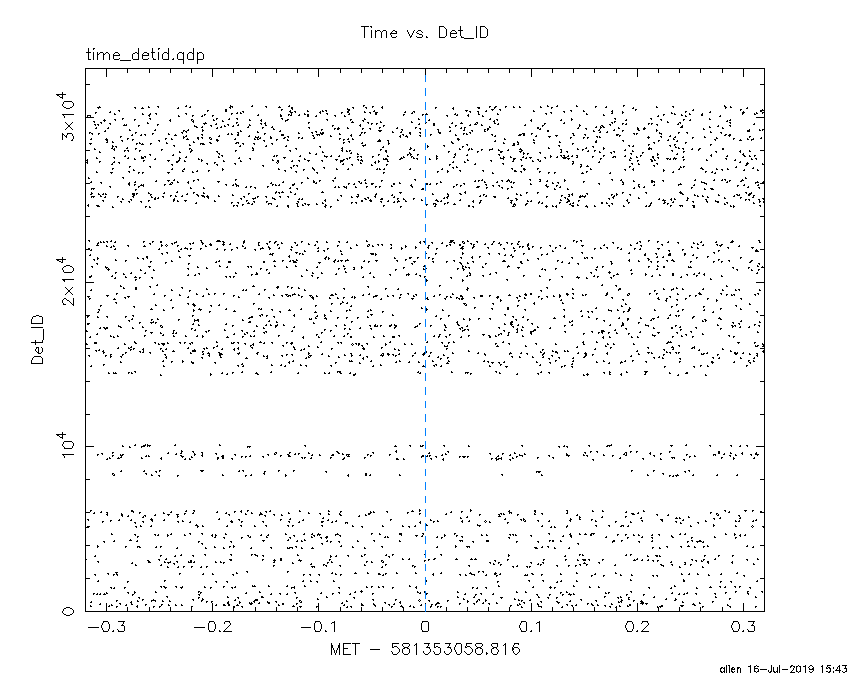
Blue+Cyan dotted lines: Time interval of the scaled map
From 0.000000 to 1.024000
100 us light curve (15-350 keV)

Blue+Cyan dotted lines: Time interval of the scaled map
From 0.000000 to 1.024000
Spacecraft aspect plot

Bright source in the pre-burst/pre-slew/post-slew images
Pre-burst image of 15-350 keV band
Time interval of the image:
-239.816000 -39.776000

# RAcent  DECcent POSerr Theta    Phi  PeakCts   SNR AngSep     Name
#  [deg]    [deg]    ['] [deg]  [deg]                   [']
244.9834 -15.6537    0.9  23.0   49.0   9.2558  13.0    0.8	Sco X-1
255.9866 -37.8440    7.3   1.9  -79.3   0.9145   1.6    0.0	4U 1700-377
256.4323 -36.4136  276.0   0.5  -53.5  -0.0233  -0.0    0.6	GX 349+2
263.0105 -24.8863    4.9  12.4  106.4   1.4603   2.3    8.4	GX 1+4
264.5738 -44.2923   24.8  10.1 -133.9  -0.2529  -0.5   11.9	4U 1735-44
268.3865  -1.4878   15.7  36.2   99.2   1.1467   0.7    2.4	SW J1753.5-0127
270.1291 -24.9450    8.0  16.0  128.7   0.9294   1.4   11.7	GX 5-1
270.1474 -25.5834    0.0  15.5  130.4   0.4168   0.7   12.7	GRS 1758-258
273.9948 -14.1825    5.8  26.8  118.8   1.8341   2.0    8.8	GX 17+2
276.0946 -30.2249    0.0  17.1  154.9  -0.7268  -1.2   12.2	H1820-303
285.0362 -24.9389    3.4  26.6  152.5   2.4073   3.4    1.1	HT1900.1-2455
263.1837 -33.7443   91.5   5.7  146.8  -0.0657  -0.1   11.1	GX 354-0
328.7591 -63.4285    3.0  50.3 -134.1  10.5235   3.8 ------	UNKNOWN
333.9037 -58.4593    2.7  53.4 -140.0  12.0873   4.3 ------	UNKNOWN
Pre-slew background subtracted image of 15-350 keV band
Time interval of the image:
-39.776000 18.684600

# RAcent  DECcent POSerr Theta    Phi  PeakCts   SNR AngSep     Name
#  [deg]    [deg]    ['] [deg]  [deg]                   [']
244.8108 -15.6751   11.4  23.1   48.6   0.2108   1.0   10.0	Sco X-1
256.2090 -37.7256    0.0   1.7  -83.3  -0.5656  -3.5   12.7	4U 1700-377
256.4307 -36.4302    6.0   0.5  -54.9   0.3033   1.9    0.5	GX 349+2
263.1540 -24.8774    6.1  12.5  106.9   0.3388   1.9   11.2	GX 1+4
264.9351 -44.5714    6.7  10.5 -134.1  -0.2684  -1.7   11.0	4U 1735-44
268.3023  -1.2919    5.8  36.4   99.0  -1.0711  -2.0   10.4	SW J1753.5-0127
270.1304 -24.9191    0.0  16.0  128.7   0.1475   0.8   12.7	GX 5-1
270.1385 -25.7566    5.0  15.4  130.8  -0.4255  -2.3    8.9	GRS 1758-258
274.0088 -13.9923    4.0  26.9  118.6   0.8468   2.9    2.7	GX 17+2
275.9503 -30.5121    4.5  16.9  155.6   0.4332   2.5    8.8	H1820-303
285.2039 -24.9584    6.1  26.7  152.7   0.4165   1.9    9.4	HT1900.1-2455
263.1572 -33.9285   21.8   5.6  148.4  -0.0833  -0.5   10.1	GX 354-0
291.2071 -22.1205    2.3  32.9  153.8   1.3771   5.1 ------	UNKNOWN
297.5453 -32.9748    0.4  33.4  176.2   6.7581  30.4 ------	UNKNOWN
196.0841 -21.2103    2.5  54.5  -12.3   2.1427   4.6 ------	UNKNOWN
306.1092 -67.7975    2.5  41.9 -126.0   1.6770   4.6 ------	UNKNOWN
Post-slew image of 15-350 keV band
Time interval of the image:
104.284600 962.254900

# RAcent  DECcent POSerr Theta    Phi  PeakCts   SNR AngSep     Name
#  [deg]    [deg]    ['] [deg]  [deg]                   [']
255.9020 -37.7729    4.7  34.1   67.2  11.8815   2.4    5.9	4U 1700-377
256.5806 -36.4252    4.2  33.7   69.7  13.1105   2.8    7.0	GX 349+2
263.0065 -24.7540   17.6  31.2   93.4   2.8522   0.7    0.5	GX 1+4
264.7644 -44.3801   16.8  27.8   53.4   2.2944   0.7    4.3	4U 1735-44
268.3900  -1.3246   19.6  41.9  130.3   5.1558   0.6    7.8	SW J1753.5-0127
270.2738 -25.0275    5.9  25.1   98.6   5.6686   1.9    3.2	GX 5-1
270.1860 -25.7617    3.5  24.9   96.9   9.9458   3.3    6.4	GRS 1758-258
274.0305 -14.1619    6.0  28.5  123.0   6.9805   1.9    7.7	GX 17+2
275.7160 -30.4677    0.0  18.8   89.0  -2.5008  -1.0   12.4	H1820-303
285.1656 -24.7888    4.0  13.6  121.0  -6.1374  -2.9   10.6	HT1900.1-2455
288.9028  10.8932   12.6  44.6  165.1  -5.2866  -0.9    6.9	GRS 1915+105
262.8699 -33.6745    8.6  28.9   76.2   5.1968   1.3   11.3	GX 354-0
297.5556 -32.9529    1.1   0.0  111.0  21.5365  10.0 ------	UNKNOWN
306.3657  22.1304    2.7  55.7 -172.9  43.9145   4.4 ------	UNKNOWN
337.6657  -9.2165    3.0  43.9 -116.3  35.9722   3.8 ------	UNKNOWN
Plot creation:
Tue Jul 16 15:43:56 EDT 2019