Estimated redshift from machine learning (Ukwatta et al. 2016) - may take a few minute to calcaulte
Image
Pre-slew 15.0-350.0 keV image (Event data)

#   RAcent    DECcent   POSerr    Theta     Phi              Peak Cts       SNR   Name
  182.5522    67.2443   0.0195    39.2161   -91.1197         3.0031653      9.778 TRIG_00908288

Foreground time interval of the image:
  0.624  20.320 (delta_t =  19.696 [sec])
Background time interval of the image:
-239.376   0.624 (delta_t = 240.000 [sec])
Lightcurves
Notes:
- 1) The mask-weighted light curves are using the flight position.
- 2) Multiple plots of different time binning/intervals are shown to cover all scenarios of short/long GRBs, rate/image triggers, and real/false positives.
- 3) For all the mask-weighted lightcurves, the y-axis units are counts/sec/det where a det is 0.4 x 0.4 = 0.16 sq cm.
- 4) The verticle lines correspond to following: green dotted lines are T50 interval, black dotted lines are T90 interval, blue solid line(s) is a spacecraft slew start time, and orange solid line(s) is a spacecraft slew end time.
- 5) Time of each bin is in the middle of the bin.
1 s binning
From T0-310 s to T0+310 s

From T100_start - 20 s to T100_end + 30 s
Full time interval
64 ms binning
Full time interval

From T100_start to T100_end

From T0-5 sec to T0+5 sec

16 ms binning
From T100_start-5 s to T100_start+5 s

Blue+Cyan dotted lines: Time interval of the scaled map
From 0.000000 to 16.384000
8 ms binning
From T100_start-3 s to T100_start+3 s
Blue+Cyan dotted lines: Time interval of the scaled map
From 0.000000 to 16.384000
2 ms binning
From T100_start-1 s to T100_start+1 s
Blue+Cyan dotted lines: Time interval of the scaled map
From 0.000000 to 16.384000
SN=5 or 10 sec. binning (whichever binning is satisfied first)

SN=5 or 10 sec. binning (T < 200 sec)

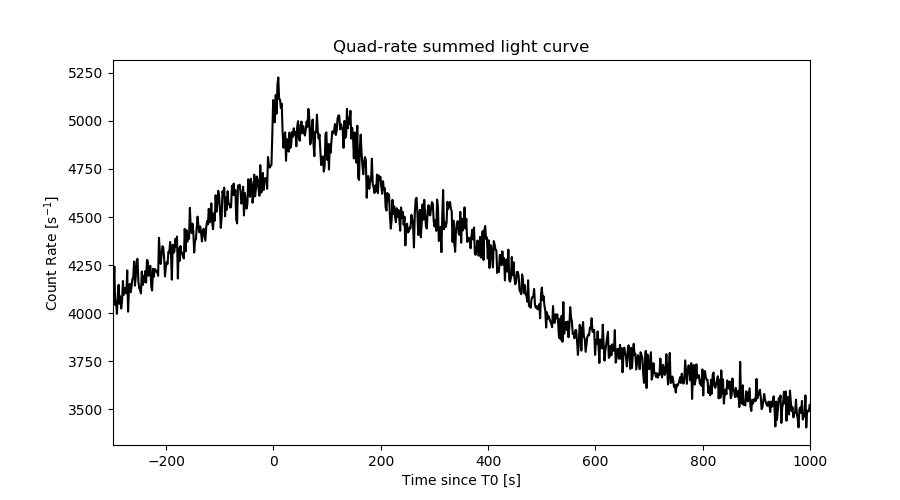
Quad-rate summed light curves (from T0-300s to T0+1000s)
Spectral Evolution

Spectra
Notes:
- 1) The fitting includes the systematic errors.
- 2) When the burst includes telescope slew time periods, the fitting uses an average response file made from multiple 5-s response files through out the slew time plus single time preiod for the non-slew times, and weighted by the total counts in the corresponding time period using addrmf. An average response file is needed becuase a spectral fit using the pre-slew DRM will introduce some errors in both a spectral shape and a normalization if the PHA file contains a lot of the slew/post-slew time interval.
- 3) For fits to more complicated models (e.g. a power-law over a cutoff power-law), the BAT team has decided to require a chi-square improvement of more than 6 for each extra dof.
Time averaged spectrum fit using the average DRM
Power-law model

Time interval is from    0.624 sec. to   20.320 sec.

Spectral model in power-law:
------------------------------------------------------------
Parameters  : value       lower 90%   higher 90%
Photon index: 1.21832     ( -0.267894   0.258055 )
Norm@50keV  : 8.57885E-03    ( -0.00124844   0.00123997 )
------------------------------------------------------------
#Fit statistic : Chi-Squared =          54.44 using 59 PHA bins.
# Reduced chi-squared =         0.9551 for     57 degrees of freedom
# Null hypothesis probability =   5.717613e-01

Photon flux (15-150 keV)    in 19.7 sec: 1.00966 ( -0.157965  0.15995 ) ph/cm2/s
Energy fluence (15-150 keV)             : 1.70607e-06 ( -2.51593e-07  2.52489e-07 ) ergs/cm2
Cutoff power-law model
Time interval is from    0.624 sec. to   20.320 sec.
Spectral model in the cutoff power-law:
------------------------------------------------------------
Parameters  : value       lower 90%   higher 90%
Photon index: 1.10304     ( -1.02244   2.11042 )
Epeak [keV] : 442.955      ( -347.747 -347.747 )
Norm@50keV  : 9.64443E-03    ( -0.00194643   0.0182358 )
------------------------------------------------------------
#Fit statistic : Chi-Squared =          54.41 using 59 PHA bins.
# Reduced chi-squared =         0.9716 for     56 degrees of freedom
# Null hypothesis probability =   5.352495e-01

Photon flux (15-150 keV)    in 19.7 sec: 1.00408 ( -0.166227  0.15632 ) ph/cm2/s
Energy fluence (15-150 keV)             : 4.65324e-07 ( 0  0 ) ergs/cm2
Band function

Time interval is from    0.624 sec. to   20.320 sec.


Spectral model in the Band function:
------------------------------------------------------------
Parameters  : value       lower 90%   higher 90%
alpha       :    (     )
beta        :     (     )
Epeak [keV] :       (   )
Norm@50keV   :     (     )
------------------------------------------------------------

Photon flux (15-150 keV)    in  sec:  (    ) ph/cm2/s
Energy fluence (15-150 keV)             : 0 ( 0  0 ) ergs/cm2
Single BB

Spectral model blackbody:
------------------------------------------------------------
Parameters  : value    Lower 90%  Upper 90%
kT [keV]    : 20.5331  (-3.70814  4.93749)
R^2/D10^2   : 4.14714E-02  (-0.0210808   0.0396592)
(R is the radius in km and D10 is the distance to the source in units of 10 kpc)
------------------------------------------------------------
#Fit statistic : Chi-Squared =          64.62 using 59 PHA bins.
# Reduced chi-squared =          1.134 for     57 degrees of freedom
# Null hypothesis probability =   2.279208e-01

Energy  Fluence     90% Error
[keV]   [erg/cm2]   [erg/cm2]
15- 25  6.570e-08   2.091e-08
25- 50  3.329e-07   8.934e-08
50-150  1.044e-06   2.658e-07
15-150  1.442e-06   3.356e-07
Thermal bremsstrahlung (OTTB)

Spectral model: thermal bremsstrahlung
------------------------------------------------------------
Parameters  : value         Lower 90%    Upper 90%
kT [keV]    : 200.000       (-46.5373      -200)
Norm        : 4.34196       (-0.628356     0.628356)
------------------------------------------------------------
#Fit statistic : Chi-Squared =          59.70 using 59 PHA bins.
# Reduced chi-squared =          1.047 for     57 degrees of freedom
# Null hypothesis probability =   3.777750e-01

Energy  Fluence     90% Error
[keV]   [erg/cm2]   [erg/cm2]
15- 25  2.132e-07   1.215e-07
25- 50  4.100e-07   2.283e-07
50-150  8.992e-07   5.042e-07
15-150  1.522e-06   8.535e-07
Double BB

Spectral model: bbodyrad<1> + bbodyrad<2>
------------------------------------------------------------
Parameters  : value         Lower 90%    Upper 90%
kT1 [keV]   : 8.94610        (-4.03232      5.92911)
R1^2/D10^2  : 0.414285        (-0.318338      3.00085)
kT2 [keV]   : 38.2254        (-24.9575      -38.2226)
R2^2/D10^2  : 4.64286E-03    (-0.00414831   0.0131135)
------------------------------------------------------------
#Fit statistic : Chi-Squared =          54.13 using 59 PHA bins.
# Reduced chi-squared =         0.9841 for     55 degrees of freedom
# Null hypothesis probability =   5.079338e-01

Energy  Fluence     90% Error
[keV]   [erg/cm2]   [erg/cm2]
15- 25  1.446e-07   8.392e-08
25- 50  3.868e-07   2.090e-07
50-150  1.182e-06   6.375e-07
15-150  1.713e-06   8.841e-07
Peak spectrum fit
Power-law model

Time interval is from    6.884 sec. to    7.884 sec.

Spectral model in power-law:
------------------------------------------------------------
Parameters  : value       lower 90%   higher 90%
Photon index: 2.51943     ( -0.630066   0.890348 )
Norm@50keV  : 7.60223E-03    ( -0.00760226   0.00364237 )
------------------------------------------------------------
#Fit statistic : Chi-Squared =          76.62 using 59 PHA bins.
# Reduced chi-squared =          1.344 for     57 degrees of freedom
# Null hypothesis probability =   4.257701e-02

Photon flux (15-150 keV)    in 1 sec: 1.51160 ( -0.652171  0.6558 ) ph/cm2/s
Energy fluence (15-150 keV)             : 7.64434e-08 ( -3.22406e-08  3.22717e-08 ) ergs/cm2
Cutoff power-law model

Time interval is from    6.884 sec. to    7.884 sec.
Spectral model in the cutoff power-law:
------------------------------------------------------------
Parameters  : value       lower 90%   higher 90%
Photon index: 1.75362     (     )
Epeak [keV] : 15.7768      (   )
Norm@50keV  : 1.96470E-02    (     )
------------------------------------------------------------
#Fit statistic : Chi-Squared =          76.43 using 59 PHA bins.
# Reduced chi-squared =          1.365 for     56 degrees of freedom
# Null hypothesis probability =   3.617196e-02

Photon flux (15-150 keV)    in 1 sec: 1.49857 ( -0.653935  0.65078 ) ph/cm2/s
Energy fluence (15-150 keV)             : 7.74694e-08 ( -3.2568e-08  3.26465e-08 ) ergs/cm2
Band function

Time interval is from    6.884 sec. to    7.884 sec.


Spectral model in the Band function:
------------------------------------------------------------
Parameters  : value       lower 90%   higher 90%
alpha       :    (     )
beta        :     (     )
Epeak [keV] :       (   )
Norm@50keV   :     (     )
------------------------------------------------------------

Photon flux (15-150 keV)    in  sec:  (    ) ph/cm2/s
Energy fluence (15-150 keV)             : 0 ( 0  0 ) ergs/cm2
Single BB

Spectral model blackbody:
------------------------------------------------------------
Parameters  : value    Lower 90%  Upper 90%
kT [keV]    : 12.2928  (-12.2949  3.97394)
R^2/D10^2   : 0.322154  (-0.3219   23.5688)
(R is the radius in km and D10 is the distance to the source in units of 10 kpc)
------------------------------------------------------------
#Fit statistic : Chi-Squared =          78.40 using 59 PHA bins.
# Reduced chi-squared =          1.375 for     57 degrees of freedom
# Null hypothesis probability =   3.158352e-02

Energy  Fluence     90% Error
[keV]   [erg/cm2]   [erg/cm2]
15- 25  1.031e-08   7.225e-09
25- 50  3.338e-08   2.217e-08
50-150  3.081e-08   2.334e-08
15-150  7.450e-08   5.075e-08
Thermal bremsstrahlung (OTTB)

Spectral model: thermal bremsstrahlung
------------------------------------------------------------
Parameters  : value         Lower 90%    Upper 90%
kT [keV]    : 44.3995       (-26.0462      58.4586)
Norm        : 9.19776       (-5.01368     11.6059)
------------------------------------------------------------
#Fit statistic : Chi-Squared =          76.49 using 59 PHA bins.
# Reduced chi-squared =          1.342 for     57 degrees of freedom
# Null hypothesis probability =   4.348232e-02

Energy  Fluence     90% Error
[keV]   [erg/cm2]   [erg/cm2]
15- 25  2.182e-08   1.325e-08
25- 50  2.996e-08   1.779e-08
50-150  2.589e-08   1.974e-08
15-150  7.767e-08   4.306e-08
Double BB

Spectral model: bbodyrad<1> + bbodyrad<2>
------------------------------------------------------------
Parameters  : value         Lower 90%    Upper 90%
kT1 [keV]   : 3.87129        (-3.57003      6.94681)
R1^2/D10^2  : 26.6051        (-26.6998      -26.8539)
kT2 [keV]   : 14.6304        (-5.16092      51.5876)
R2^2/D10^2  : 0.115285    (-0.115303   0.285855)
------------------------------------------------------------
#Fit statistic : Chi-Squared =          75.54 using 59 PHA bins.
# Reduced chi-squared =          1.373 for     55 degrees of freedom
# Null hypothesis probability =   3.448249e-02

Energy  Fluence     90% Error
[keV]   [erg/cm2]   [erg/cm2]
15- 25  2.579e-08   1.516e-08
25- 50  2.690e-08   1.604e-08
50-150  2.906e-08   2.264e-08
15-150  8.175e-08   4.501e-08
Pre-slew spectrum (Pre-slew PHA with pre-slew DRM)
Power-law model
Spectral model in power-law:
------------------------------------------------------------
Parameters  : value       lower 90%   higher 90%
Photon index: 1.21832     ( -0.267894   0.258055 )
Norm@50keV  : 8.57885E-03    ( -0.00124844   0.00123997 )
------------------------------------------------------------
#Fit statistic : Chi-Squared =          54.44 using 59 PHA bins.
# Reduced chi-squared =         0.9551 for     57 degrees of freedom
# Null hypothesis probability =   5.717613e-01

Photon flux (15-150 keV)    in 19.7 sec: 1.00966 ( -0.157967  0.159932 ) ph/cm2/s
Energy fluence (15-150 keV)             : 1.70587e-06 ( -2.51553e-07  2.52946e-07 ) ergs/cm2
Cutoff power-law model

Spectral model in the cutoff power-law:
------------------------------------------------------------
Parameters  : value       lower 90%   higher 90%
Photon index: 1.10334     ( -1.02362   2.12166 )
Epeak [keV] : 444.170      ( -349.447 -349.447 )
Norm@50keV  : 9.64148E-03    ( -0.00893781   0.0182344 )
------------------------------------------------------------
#Fit statistic : Chi-Squared =          54.41 using 59 PHA bins.
# Reduced chi-squared =         0.9716 for     56 degrees of freedom
# Null hypothesis probability =   5.352530e-01

Photon flux (15-150 keV)    in 19.7 sec: 1.00400 ( -0.166182  0.16355 ) ph/cm2/s
Energy fluence (15-150 keV)             : 1.69916e-06 ( -2.65907e-07  2.58626e-07 ) ergs/cm2
Band function

Spectral model in the Band function:
------------------------------------------------------------
Parameters  : value       lower 90%   higher 90%
alpha       :    (     )
beta        :     (     )
Epeak [keV] :       (   )
Norm@50keV   :     (     )
------------------------------------------------------------

Photon flux (15-150 keV)    in  sec:  (    ) ph/cm2/s
Energy fluence (15-150 keV)             : 0 ( 0  0 ) ergs/cm2
S(25-50 keV) vs. S(50-100 keV) plot

S(25-50 keV)  = 3.62e-07
S(50-100 keV) = 6.23e-07
T90 vs. Hardness ratio plot

T90                                   = 17.6319999694824 sec.
Hardness ratio (energy fluence ratio) = 1.72099
Color vs. Color plot

Count Ratio  (25-50 keV) / (15-25 keV) = 1.46214
Count Ratio (50-100 keV) / (15-25 keV) = 1.62132
Mask shadow pattern

IMX = -1.594617122175715E-02, IMY = 8.158935246071674E-01
TIME vs. PHA plot around the trigger time
Blue+Cyan dotted lines: Time interval of the scaled map
From 0.000000 to 16.384000
TIME vs. DetID plot around the trigger time

Blue+Cyan dotted lines: Time interval of the scaled map
From 0.000000 to 16.384000
100 us light curve (15-350 keV)

Blue+Cyan dotted lines: Time interval of the scaled map
From 0.000000 to 16.384000
Spacecraft aspect plot
Bright source in the pre-burst/pre-slew/post-slew images
Pre-burst image of 15-350 keV band
Time interval of the image:
-239.376000 0.624000

# RAcent  DECcent POSerr Theta    Phi  PeakCts   SNR AngSep     Name
#  [deg]    [deg]    ['] [deg]  [deg]                   [']
254.4240  35.4864    6.3  16.7   35.8   1.0586   1.8    8.8	Her X-1
299.5994  35.2027    1.4  51.1   10.5   8.7077   8.0    0.4	Cyg X-1
308.2429  40.8121    0.0  54.8    0.5  -1.3104  -1.0   10.4	Cyg X-3
211.1947  22.3665    2.2  26.0  172.4   3.2996   5.3 ------	UNKNOWN
Pre-slew background subtracted image of 15-350 keV band
Time interval of the image:
0.624000 20.320000

# RAcent  DECcent POSerr Theta    Phi  PeakCts   SNR AngSep     Name
#  [deg]    [deg]    ['] [deg]  [deg]                   [']
254.6041  35.3923    9.9  16.8   35.9   0.0874   1.2    7.8	Her X-1
299.7326  35.0845    0.0  51.2   10.5  -0.2513  -1.3    9.9	Cyg X-1
308.1215  41.0185    6.0  54.7    0.3   0.4816   1.9    4.0	Cyg X-3
301.5951  39.6137    2.9  50.7    4.5   0.6568   4.0 ------	UNKNOWN
187.4546  17.0407    2.3  46.1 -168.2   0.6808   5.1 ------	UNKNOWN
213.3508  65.3193    2.3  28.2  -80.7   0.4944   5.0 ------	UNKNOWN
173.0559  27.8252    2.3  51.1 -146.3   1.1460   5.0 ------	UNKNOWN
182.5522  67.2444    1.2  39.2  -91.1   3.0034   9.8 ------	UNKNOWN
Post-slew image of 15-350 keV band
Time interval of the image:
125.924600 962.713200

# RAcent  DECcent POSerr Theta    Phi  PeakCts   SNR AngSep     Name
#  [deg]    [deg]    ['] [deg]  [deg]                   [']
319.2968  52.5310    2.9  55.9   10.9  12.8170   4.0 ------	UNKNOWN
326.0770  62.9600    2.1  47.2    2.3  14.5926   5.4 ------	UNKNOWN
103.1006  50.4879    3.3  40.9  -92.3  26.8859   3.5 ------	UNKNOWN
Plot creation:
Tue Jul 16 15:38:13 EDT 2019