Estimated redshift from machine learning (Ukwatta et al. 2016) - may take a few minute to calcaulte
Image
Pre-slew 15.0-350.0 keV image (Event data)

#   RAcent    DECcent   POSerr    Theta     Phi              Peak Cts       SNR   Name
  305.4371    -4.6521   0.0166    45.7069    31.6983         2.0634316     11.551 TRIG_00908329

Foreground time interval of the image:
 -2.848  12.381 (delta_t =  15.229 [sec])
Background time interval of the image:
-239.120  -2.848 (delta_t = 236.272 [sec])
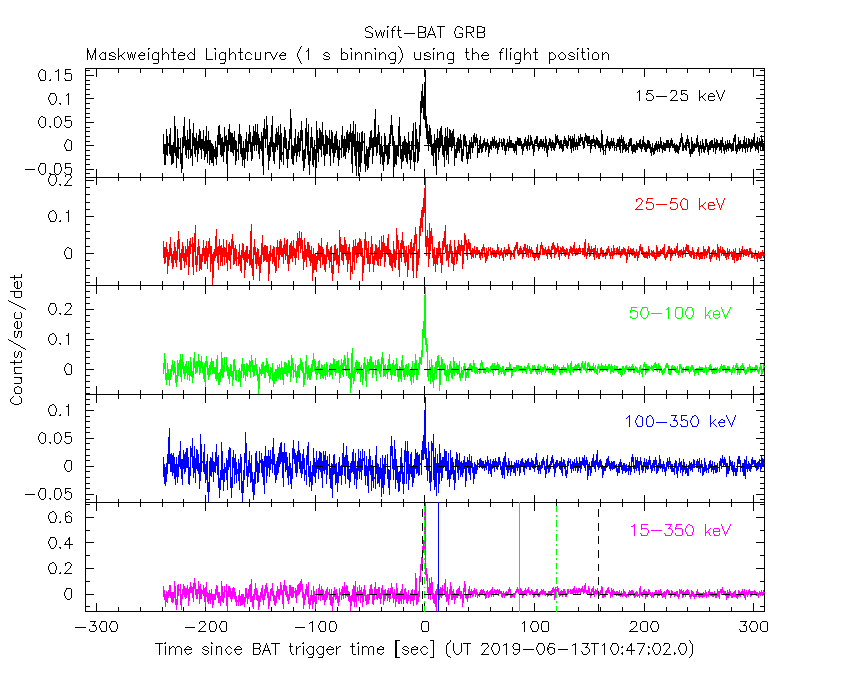
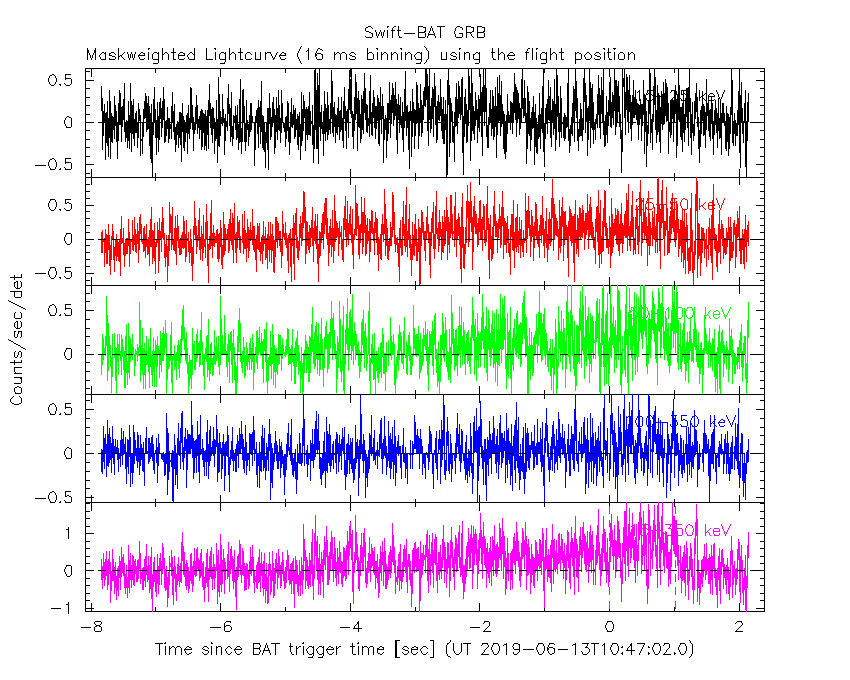
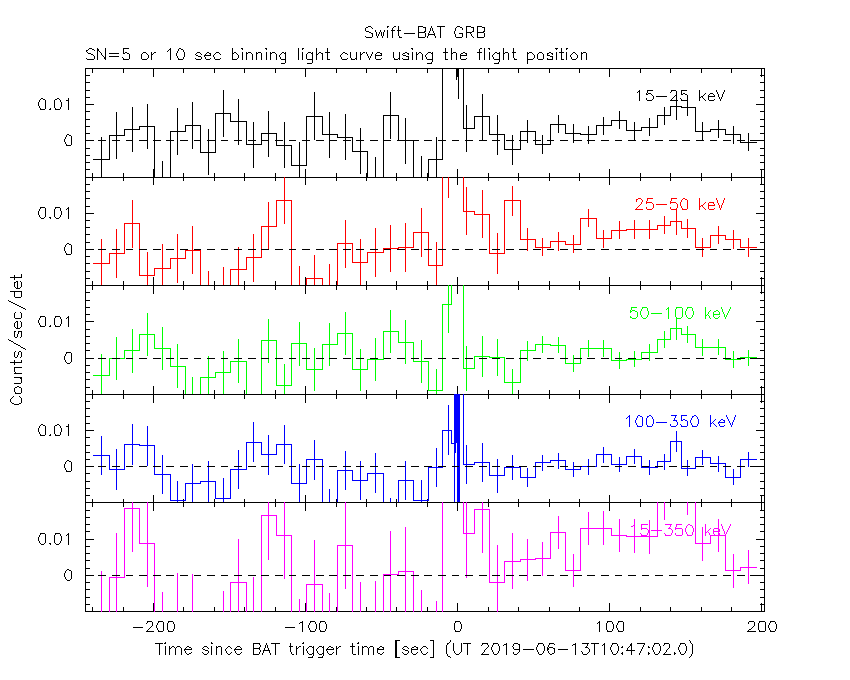
Lightcurves
Notes:
- 1) The mask-weighted light curves are using the flight position.
- 2) Multiple plots of different time binning/intervals are shown to cover all scenarios of short/long GRBs, rate/image triggers, and real/false positives.
- 3) For all the mask-weighted lightcurves, the y-axis units are counts/sec/det where a det is 0.4 x 0.4 = 0.16 sq cm.
- 4) The verticle lines correspond to following: green dotted lines are T50 interval, black dotted lines are T90 interval, blue solid line(s) is a spacecraft slew start time, and orange solid line(s) is a spacecraft slew end time.
- 5) Time of each bin is in the middle of the bin.
1 s binning
From T0-310 s to T0+310 s
From T100_start - 20 s to T100_end + 30 s

Full time interval

64 ms binning
Full time interval

From T100_start to T100_end

From T0-5 sec to T0+5 sec

16 ms binning
From T100_start-5 s to T100_start+5 s
Blue+Cyan dotted lines: Time interval of the scaled map
From 0.000000 to 1.024000
8 ms binning
From T100_start-3 s to T100_start+3 s

Blue+Cyan dotted lines: Time interval of the scaled map
From 0.000000 to 1.024000
2 ms binning
From T100_start-1 s to T100_start+1 s

Blue+Cyan dotted lines: Time interval of the scaled map
From 0.000000 to 1.024000
SN=5 or 10 sec. binning (whichever binning is satisfied first)

SN=5 or 10 sec. binning (T < 200 sec)
Quad-rate summed light curves (from T0-300s to T0+1000s)

Spectral Evolution

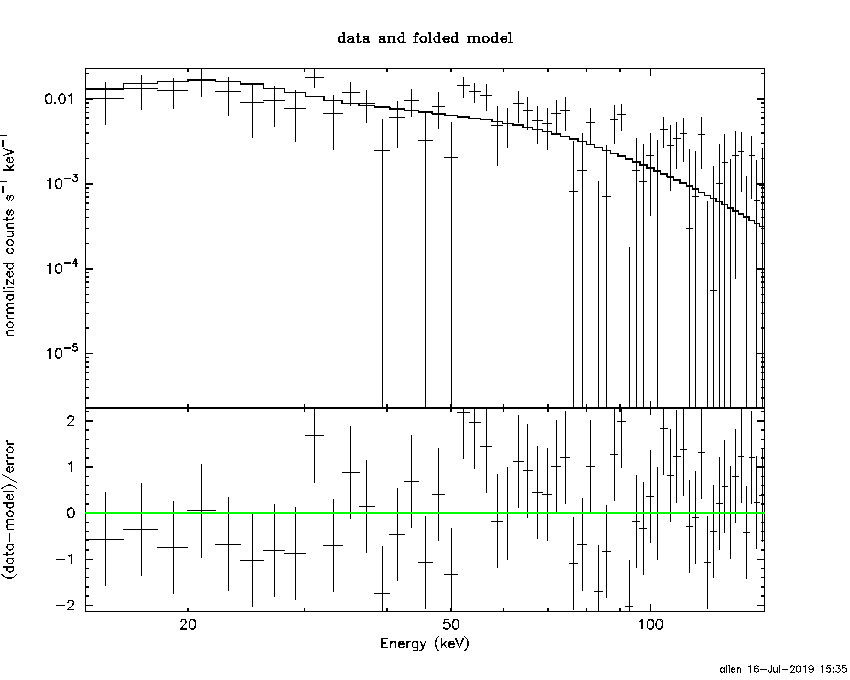
Spectra
Notes:
- 1) The fitting includes the systematic errors.
- 2) When the burst includes telescope slew time periods, the fitting uses an average response file made from multiple 5-s response files through out the slew time plus single time preiod for the non-slew times, and weighted by the total counts in the corresponding time period using addrmf. An average response file is needed becuase a spectral fit using the pre-slew DRM will introduce some errors in both a spectral shape and a normalization if the PHA file contains a lot of the slew/post-slew time interval.
- 3) For fits to more complicated models (e.g. a power-law over a cutoff power-law), the BAT team has decided to require a chi-square improvement of more than 6 for each extra dof.
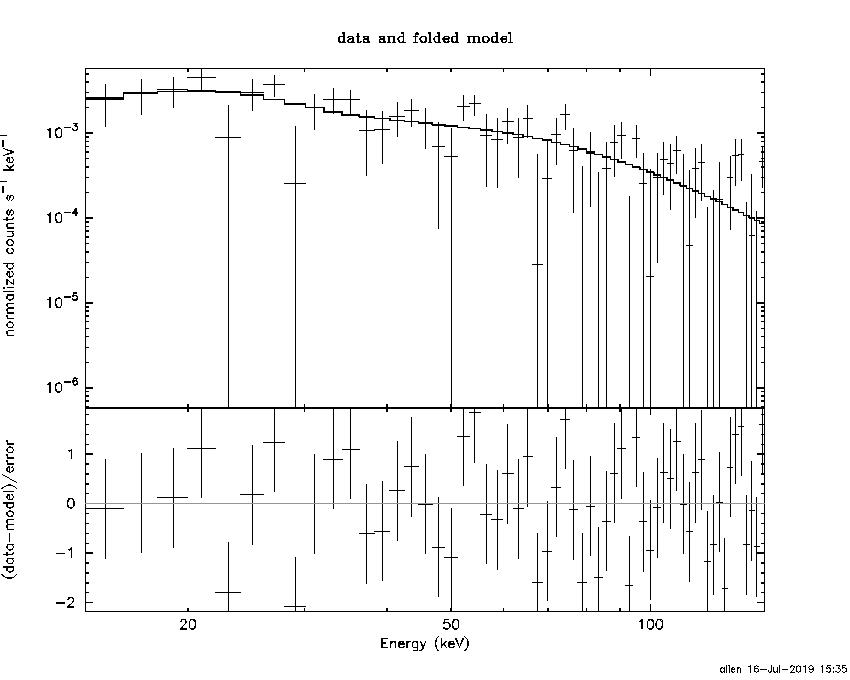
Time averaged spectrum fit using the average DRM
Power-law model

Time interval is from   -2.848 sec. to  175.652 sec.

Spectral model in power-law:
------------------------------------------------------------
Parameters  : value       lower 90%   higher 90%
Photon index: 1.75370     ( -0.237381   0.248393 )
Norm@50keV  : 1.31706E-03    ( -0.000191791   0.000185893 )
------------------------------------------------------------
#Fit statistic : Chi-Squared =          81.59 using 59 PHA bins.
# Reduced chi-squared =          1.431 for     57 degrees of freedom
# Null hypothesis probability =   1.801042e-02

Photon flux (15-150 keV)    in 178.5 sec: 0.178341 ( -0.022392  0.022419 ) ph/cm2/s
Energy fluence (15-150 keV)             : 2.16919e-06 ( -3.22392e-07  3.28101e-07 ) ergs/cm2
Cutoff power-law model

Time interval is from   -2.848 sec. to  175.652 sec.
Spectral model in the cutoff power-law:
------------------------------------------------------------
Parameters  : value       lower 90%   higher 90%
Photon index: 2.56892     ( -1.10212   0.213964 )
Epeak [keV] : 193.252      (   )
Norm@50keV  : 5.11130E-04    (     )
------------------------------------------------------------
#Fit statistic : Chi-Squared =          80.23 using 59 PHA bins.
# Reduced chi-squared =          1.433 for     56 degrees of freedom
# Null hypothesis probability =   1.854977e-02

Photon flux (15-150 keV)    in 178.5 sec: 0.178649 ( -0.023029  0.022395 ) ph/cm2/s
Energy fluence (15-150 keV)             : 2.18791e-06 ( -4.59216e-07  1.4221e-07 ) ergs/cm2
Band function

Time interval is from   -2.848 sec. to  175.652 sec.


Spectral model in the Band function:
------------------------------------------------------------
Parameters  : value       lower 90%   higher 90%
alpha       :    (     )
beta        :     (     )
Epeak [keV] :       (   )
Norm@50keV   :     (     )
------------------------------------------------------------

Photon flux (15-150 keV)    in  sec:  (    ) ph/cm2/s
Energy fluence (15-150 keV)             : 0 ( 0  0 ) ergs/cm2
Single BB

Spectral model blackbody:
------------------------------------------------------------
Parameters  : value    Lower 90%  Upper 90%
kT [keV]    : 11.2992  (-1.96169  2.524)
R^2/D10^2   : 5.10511E-02  (-0.0264803   0.0524327)
(R is the radius in km and D10 is the distance to the source in units of 10 kpc)
------------------------------------------------------------
#Fit statistic : Chi-Squared =         107.40 using 59 PHA bins.
# Reduced chi-squared =         1.8842 for     57 degrees of freedom
# Null hypothesis probability =   6.179999e-05

Energy  Fluence     90% Error
[keV]   [erg/cm2]   [erg/cm2]
15- 25  2.443e-07   6.409e-08
25- 50  7.146e-07   1.374e-07
50-150  5.259e-07   1.700e-07
15-150  1.485e-06   2.735e-07
Thermal bremsstrahlung (OTTB)

Spectral model: thermal bremsstrahlung
------------------------------------------------------------
Parameters  : value         Lower 90%    Upper 90%
kT [keV]    : 131.225       (-57.4755      -129.985)
Norm        : 0.737860       (-0.108613     0.154854)
------------------------------------------------------------
#Fit statistic : Chi-Squared =          84.11 using 59 PHA bins.
# Reduced chi-squared =          1.476 for     57 degrees of freedom
# Null hypothesis probability =   1.127129e-02

Energy  Fluence     90% Error
[keV]   [erg/cm2]   [erg/cm2]
15- 25  3.415e-07   7.211e-08
25- 50  6.202e-07   3.119e-07
50-150  1.155e-06   6.479e-07
15-150  2.117e-06   8.763e-07
Double BB

Spectral model: bbodyrad<1> + bbodyrad<2>
------------------------------------------------------------
Parameters  : value         Lower 90%    Upper 90%
kT1 [keV]   : 6.63414        (-2.12997      2.20957)
R1^2/D10^2  : 0.294132        (-0.185577      0.987256)
kT2 [keV]   : 34.1343        (-14.2289      94.3155)
R2^2/D10^2  : 8.35374E-04    (-0.000772311   0.00274609)
------------------------------------------------------------
#Fit statistic : Chi-Squared =          82.83 using 59 PHA bins.
# Reduced chi-squared =          1.506 for     55 degrees of freedom
# Null hypothesis probability =   8.994979e-03

Energy  Fluence     90% Error
[keV]   [erg/cm2]   [erg/cm2]
15- 25  3.749e-07   1.816e-07
25- 50  5.930e-07   2.515e-07
50-150  1.313e-06   7.244e-07
15-150  2.281e-06   1.028e-06
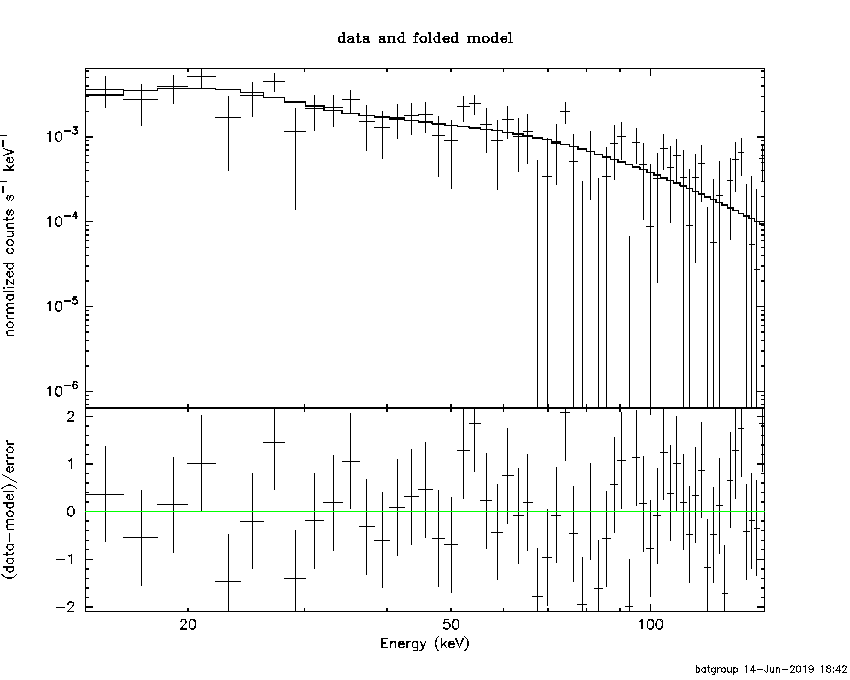
Peak spectrum fit
Power-law model

Time interval is from    0.012 sec. to    1.012 sec.

Spectral model in power-law:
------------------------------------------------------------
Parameters  : value       lower 90%   higher 90%
Photon index: 1.25388     ( -0.225241   0.223429 )
Norm@50keV  : 4.77675E-02    ( -0.00619652   0.00618729 )
------------------------------------------------------------
#Fit statistic : Chi-Squared =          57.05 using 59 PHA bins.
# Reduced chi-squared =          1.001 for     57 degrees of freedom
# Null hypothesis probability =   4.731568e-01

Photon flux (15-150 keV)    in 1 sec: 5.65323 ( -0.74676  0.74787 ) ph/cm2/s
Energy fluence (15-150 keV)             : 4.77617e-07 ( -6.91754e-08  6.98148e-08 ) ergs/cm2
Cutoff power-law model

Time interval is from    0.012 sec. to    1.012 sec.
Spectral model in the cutoff power-law:
------------------------------------------------------------
Parameters  : value       lower 90%   higher 90%
Photon index: 0.984503     ( -1.1018   0.469328 )
Epeak [keV] : 199.050      ( -199.123 -199.123 )
Norm@50keV  : 6.46208E-02    ( -0.0624564   0.148884 )
------------------------------------------------------------
#Fit statistic : Chi-Squared =          56.81 using 59 PHA bins.
# Reduced chi-squared =          1.014 for     56 degrees of freedom
# Null hypothesis probability =   4.447578e-01

Photon flux (15-150 keV)    in 1 sec: 5.59812 ( -0.77509  0.77051 ) ph/cm2/s
Energy fluence (15-150 keV)             : 1.25254e-07 ( -6.71321e-08  3.31733e-08 ) ergs/cm2
Band function

Time interval is from    0.012 sec. to    1.012 sec.


Spectral model in the Band function:
------------------------------------------------------------
Parameters  : value       lower 90%   higher 90%
alpha       :    (     )
beta        :     (     )
Epeak [keV] :       (   )
Norm@50keV   :     (     )
------------------------------------------------------------

Photon flux (15-150 keV)    in  sec:  (    ) ph/cm2/s
Energy fluence (15-150 keV)             : 0 ( 0  0 ) ergs/cm2
Single BB

Spectral model blackbody:
------------------------------------------------------------
Parameters  : value    Lower 90%  Upper 90%
kT [keV]    : 17.5815  (-2.56091  3.19703)
R^2/D10^2   : 0.398637  (-0.171759   0.279311)
(R is the radius in km and D10 is the distance to the source in units of 10 kpc)
------------------------------------------------------------
#Fit statistic : Chi-Squared =          66.28 using 59 PHA bins.
# Reduced chi-squared =          1.163 for     57 degrees of freedom
# Null hypothesis probability =   1.874532e-01

Energy  Fluence     90% Error
[keV]   [erg/cm2]   [erg/cm2]
15- 25  2.485e-08   5.850e-09
25- 50  1.129e-07   2.287e-08
50-150  2.517e-07   5.780e-08
15-150  3.895e-07   7.290e-08
Thermal bremsstrahlung (OTTB)
Spectral model: thermal bremsstrahlung
------------------------------------------------------------
Parameters  : value         Lower 90%    Upper 90%
kT [keV]    : 200.000       (-45.6254      -200)
Norm        : 23.3086       (-3.05759     3.05759)
------------------------------------------------------------
#Fit statistic : Chi-Squared =          61.65 using 59 PHA bins.
# Reduced chi-squared =          1.082 for     57 degrees of freedom
# Null hypothesis probability =   3.135011e-01

Energy  Fluence     90% Error
[keV]   [erg/cm2]   [erg/cm2]
15- 25  5.806e-08   3.320e-08
25- 50  1.117e-07   6.175e-08
50-150  2.449e-07   1.365e-07
15-150  4.147e-07   2.321e-07
Double BB

Spectral model: bbodyrad<1> + bbodyrad<2>
------------------------------------------------------------
Parameters  : value         Lower 90%    Upper 90%
kT1 [keV]   : 5.60850        (-3.28345      10.4563)
R1^2/D10^2  : 8.79277        (-8.2361      37.2646)
kT2 [keV]   : 23.1457        (-5.69193      -23.1887)
R2^2/D10^2  : 0.139923    (-0.122011   0.247025)
------------------------------------------------------------
#Fit statistic : Chi-Squared =          58.34 using 59 PHA bins.
# Reduced chi-squared =          1.061 for     55 degrees of freedom
# Null hypothesis probability =   3.536495e-01

Energy  Fluence     90% Error
[keV]   [erg/cm2]   [erg/cm2]
15- 25  4.668e-08   2.526e-08
25- 50  1.022e-07   4.750e-08
50-150  2.970e-07   1.647e-07
15-150  4.458e-07   2.038e-07
Pre-slew spectrum (Pre-slew PHA with pre-slew DRM)
Power-law model

Spectral model in power-law:
------------------------------------------------------------
Parameters  : value       lower 90%   higher 90%
Photon index: 1.48989     ( -0.242973   0.246511 )
Norm@50keV  : 8.82585E-03    ( -0.00124002   0.00123349 )
------------------------------------------------------------
#Fit statistic : Chi-Squared =          58.66 using 59 PHA bins.
# Reduced chi-squared =          1.029 for     57 degrees of freedom
# Null hypothesis probability =   4.144847e-01

Photon flux (15-150 keV)    in 15.23 sec: 1.09884 ( -0.156864  0.157444 ) ph/cm2/s
Energy fluence (15-150 keV)             : 1.27729e-06 ( -1.94221e-07  1.95829e-07 ) ergs/cm2
Cutoff power-law model
Spectral model in the cutoff power-law:
------------------------------------------------------------
Parameters  : value       lower 90%   higher 90%
Photon index: 1.49014     ( -0.394986   0.246035 )
Epeak [keV] : 9999.36      ( -9999.36 -9999.36 )
Norm@50keV  : 8.84560E-03    ( -0.00815377   0.0175118 )
------------------------------------------------------------
#Fit statistic : Chi-Squared =          58.66 using 59 PHA bins.
# Reduced chi-squared =          1.047 for     56 degrees of freedom
# Null hypothesis probability =   3.782560e-01

Photon flux (15-150 keV)    in 15.23 sec: 1.09845 ( -0.156587  0.15686 ) ph/cm2/s
Energy fluence (15-150 keV)             : 1.2776e-06 ( -2.03266e-07  1.94662e-07 ) ergs/cm2
Band function
Spectral model in the Band function:
------------------------------------------------------------
Parameters  : value       lower 90%   higher 90%
alpha       :    (     )
beta        :     (     )
Epeak [keV] :       (   )
Norm@50keV   :     (     )
------------------------------------------------------------

Photon flux (15-150 keV)    in  sec:  (    ) ph/cm2/s
Energy fluence (15-150 keV)             : 0 ( 0  0 ) ergs/cm2
S(25-50 keV) vs. S(50-100 keV) plot

S(25-50 keV)  = 6.00e-07
S(50-100 keV) = 7.12e-07
T90 vs. Hardness ratio plot
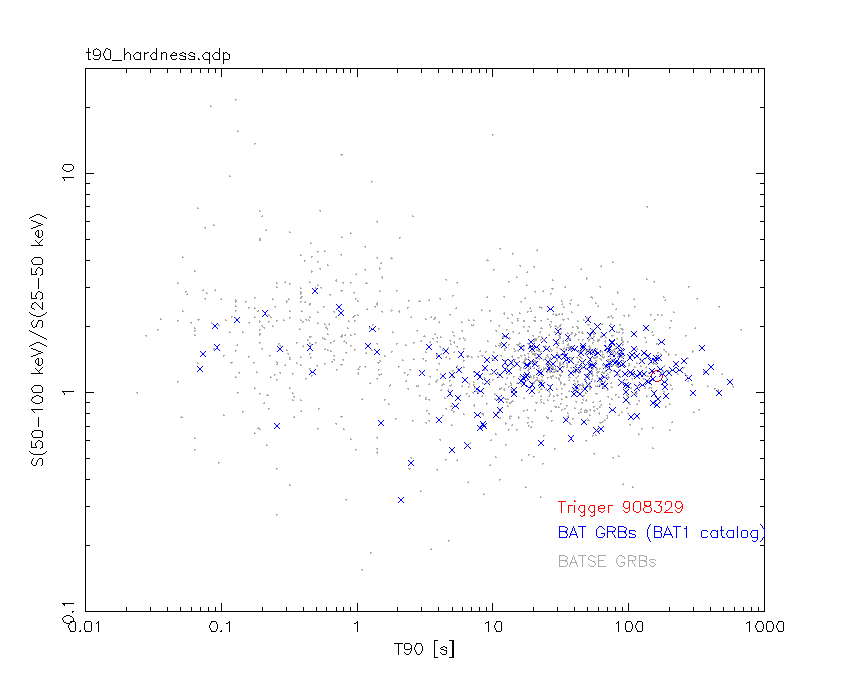
T90                                   = 160.819999933243 sec.
Hardness ratio (energy fluence ratio) = 1.18667
Color vs. Color plot

Count Ratio  (25-50 keV) / (15-25 keV) = 1.41712
Count Ratio (50-100 keV) / (15-25 keV) = 0.851565
Mask shadow pattern

IMX = 8.720846365663342E-01, IMY = -5.385738319164157E-01
TIME vs. PHA plot around the trigger time

Blue+Cyan dotted lines: Time interval of the scaled map
From 0.000000 to 1.024000
TIME vs. DetID plot around the trigger time

Blue+Cyan dotted lines: Time interval of the scaled map
From 0.000000 to 1.024000
100 us light curve (15-350 keV)

Blue+Cyan dotted lines: Time interval of the scaled map
From 0.000000 to 1.024000
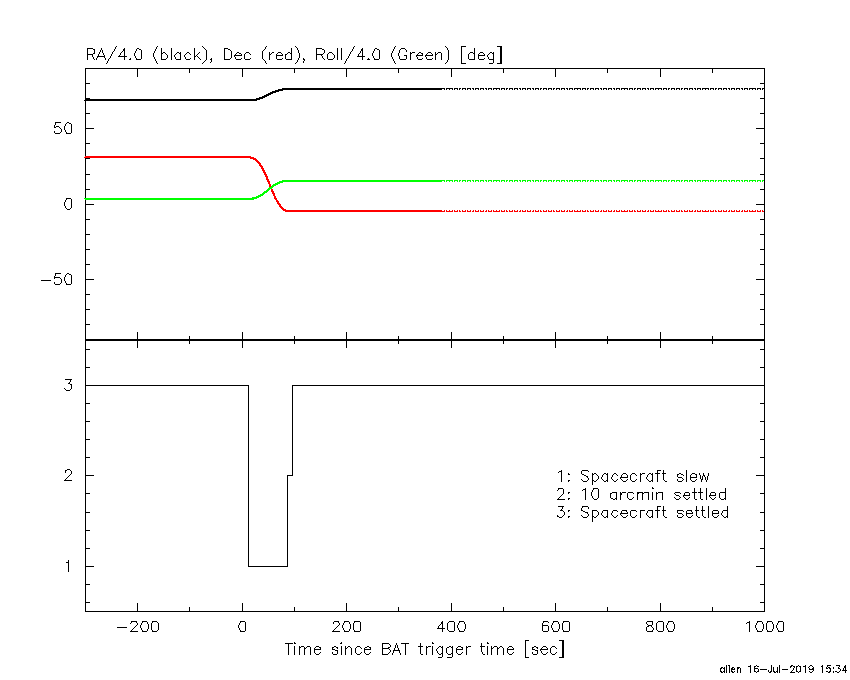
Spacecraft aspect plot
Bright source in the pre-burst/pre-slew/post-slew images
Pre-burst image of 15-350 keV band
Time interval of the image:
-239.120000 -2.848000

# RAcent  DECcent POSerr Theta    Phi  PeakCts   SNR AngSep     Name
#  [deg]    [deg]    ['] [deg]  [deg]                   [']
254.4162  35.2952    4.8  18.1 -174.7  -1.2544  -2.4    3.5	Her X-1
268.4469  -1.5420    9.6  33.2   88.7  -1.0691  -1.2    7.2	SW J1753.5-0127
288.6931  10.9263    3.7  23.5   41.5   1.7173   3.1    6.3	GRS 1915+105
299.6014  35.2068    0.9  20.6  -32.5   7.9547  13.5    0.6	Cyg X-1
308.1802  40.7617    5.7  28.1  -43.7  -1.4263  -2.0   11.9	Cyg X-3
326.3432  38.2743    7.9  42.0  -38.6   1.4626   1.5    8.6	Cyg X-2
240.0140  26.8018    2.1  31.2  167.2   3.7882   5.4 ------	UNKNOWN
331.7427   8.6370    2.7  56.8   -3.6   5.9998   4.3 ------	UNKNOWN
Pre-slew background subtracted image of 15-350 keV band
Time interval of the image:
-2.848000 12.380600

# RAcent  DECcent POSerr Theta    Phi  PeakCts   SNR AngSep     Name
#  [deg]    [deg]    ['] [deg]  [deg]                   [']
254.4821  35.1988   10.5  18.0 -175.0   0.0643   1.1    8.7	Her X-1
268.5236  -1.3326    0.0  33.0   88.6  -0.1323  -0.9   11.8	SW J1753.5-0127
288.7239  11.0362    5.8  23.4   41.3  -0.1463  -2.0    7.0	GRS 1915+105
299.8137  35.2404   10.8  20.8  -32.5   0.0681   1.1   11.2	Cyg X-1
308.2628  41.0423   18.4  28.2  -44.3   0.0409   0.6    8.8	Cyg X-3
326.1708  38.3200 1136.9  41.9  -38.6   0.0010   0.0    0.1	Cyg X-2
305.4370  -4.6521    1.0  45.7   31.7   2.0625  11.5 ------	UNKNOWN
Post-slew image of 15-350 keV band
Time interval of the image:
85.980600 962.922000

# RAcent  DECcent POSerr Theta    Phi  PeakCts   SNR AngSep     Name
#  [deg]    [deg]    ['] [deg]  [deg]                   [']
268.3648  -1.4402   39.1  37.1  122.0  -1.1550  -0.3    0.8	SW J1753.5-0127
270.3543 -25.0869    6.5  39.3   83.3   5.5277   1.8    3.8	GX 5-1
270.3413 -25.6117    7.1  39.6   82.6  -5.0591  -1.6    8.2	GRS 1758-258
274.0016 -14.1228    4.2  32.4   99.0   6.5128   2.7    5.2	GX 17+2
276.1352 -30.4198    8.4  37.7   71.7   4.0280   1.4   11.3	H1820-303
284.8916 -24.9900   12.8  28.3   70.3  -1.8726  -0.9    8.9	HT1900.1-2455
288.6617  10.9010    5.4  22.8  161.3   3.7781   2.1    8.5	GRS 1915+105
299.5763  35.1896    1.3  40.2 -159.2  28.2607   8.8    1.0	Cyg X-1
308.1719  40.9514    6.0  45.7 -148.9   8.3143   1.9    2.8	Cyg X-3
326.2894  38.2826    6.1  47.1 -129.4  17.2764   1.9    6.0	Cyg X-2
305.8205 -13.3250    2.5   8.7   25.6   8.7815   4.7 ------	UNKNOWN
339.3627 -44.3602    2.7  49.6   -3.4  13.5769   4.2 ------	UNKNOWN
341.3072  15.4164    2.3  40.8  -92.0  45.3781   5.0 ------	UNKNOWN
Plot creation:
Tue Jul 16 15:36:28 EDT 2019