Estimated redshift from machine learning (Ukwatta et al. 2016) - may take a few minute to calcaulte
Image
Pre-slew 15.0-350.0 keV image (Event data)
#   RAcent    DECcent   POSerr    Theta     Phi              Peak Cts       SNR   Name
  223.7293    41.5284   0.0169     8.0325  -123.7017         0.4234625     11.373 TRIG_00912102

Foreground time interval of the image:
 -1.684   4.704 (delta_t =   6.388 [sec])
Background time interval of the image:
-239.808  -1.684 (delta_t = 238.124 [sec])
Lightcurves
Notes:
- 1) The mask-weighted light curves are using the flight position.
- 2) Multiple plots of different time binning/intervals are shown to cover all scenarios of short/long GRBs, rate/image triggers, and real/false positives.
- 3) For all the mask-weighted lightcurves, the y-axis units are counts/sec/det where a det is 0.4 x 0.4 = 0.16 sq cm.
- 4) The verticle lines correspond to following: green dotted lines are T50 interval, black dotted lines are T90 interval, blue solid line(s) is a spacecraft slew start time, and orange solid line(s) is a spacecraft slew end time.
- 5) Time of each bin is in the middle of the bin.
1 s binning
From T0-310 s to T0+310 s

From T100_start - 20 s to T100_end + 30 s
Full time interval
64 ms binning
Full time interval

From T100_start to T100_end
From T0-5 sec to T0+5 sec
16 ms binning
From T100_start-5 s to T100_start+5 s
Blue+Cyan dotted lines: Time interval of the scaled map
From 0.000000 to 1.024000
8 ms binning
From T100_start-3 s to T100_start+3 s

Blue+Cyan dotted lines: Time interval of the scaled map
From 0.000000 to 1.024000
2 ms binning
From T100_start-1 s to T100_start+1 s

Blue+Cyan dotted lines: Time interval of the scaled map
From 0.000000 to 1.024000
SN=5 or 10 sec. binning (whichever binning is satisfied first)

SN=5 or 10 sec. binning (T < 200 sec)
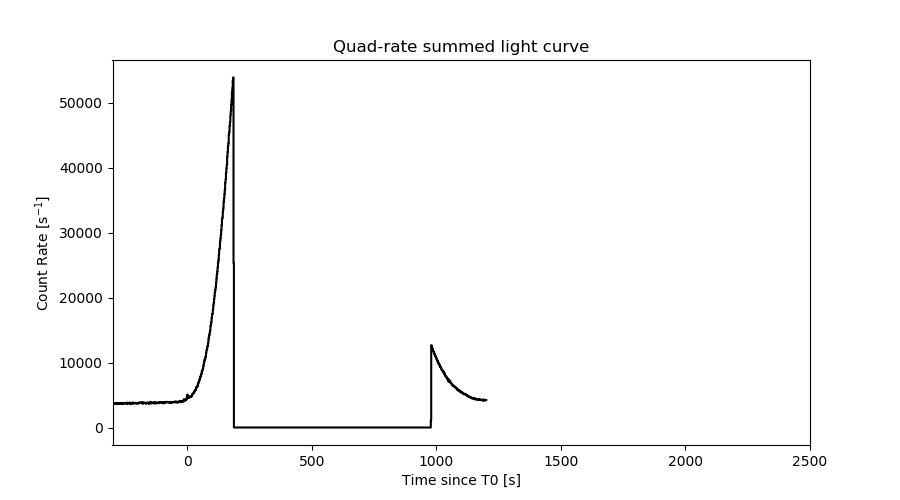
Quad-rate summed light curves (from T0-300s to T0+1000s)
Spectral Evolution

Spectra
Notes:
- 1) The fitting includes the systematic errors.
- 2) When the burst includes telescope slew time periods, the fitting uses an average response file made from multiple 5-s response files through out the slew time plus single time preiod for the non-slew times, and weighted by the total counts in the corresponding time period using addrmf. An average response file is needed becuase a spectral fit using the pre-slew DRM will introduce some errors in both a spectral shape and a normalization if the PHA file contains a lot of the slew/post-slew time interval.
- 3) For fits to more complicated models (e.g. a power-law over a cutoff power-law), the BAT team has decided to require a chi-square improvement of more than 6 for each extra dof.
Time averaged spectrum fit using the average DRM
Power-law model
Time interval is from   -1.684 sec. to    4.704 sec.

Spectral model in power-law:
------------------------------------------------------------
Parameters  : value       lower 90%   higher 90%
Photon index: 1.35645     ( -0.241925   0.242765 )
Norm@50keV  : 4.44975E-03    ( -0.000601699   0.000598273 )
------------------------------------------------------------
#Fit statistic : Chi-Squared =          55.67 using 59 PHA bins.
# Reduced chi-squared =         0.9767 for     57 degrees of freedom
# Null hypothesis probability =   5.249659e-01

Photon flux (15-150 keV)    in 6.388 sec: 0.536790 ( -0.071953  0.072088 ) ph/cm2/s
Energy fluence (15-150 keV)             : 2.77252e-07 ( -4.23996e-08  4.31277e-08 ) ergs/cm2
Cutoff power-law model
Time interval is from   -1.684 sec. to    4.704 sec.
Spectral model in the cutoff power-law:
------------------------------------------------------------
Parameters  : value       lower 90%   higher 90%
Photon index: 1.28009     ( -1.02859   1.36024 )
Epeak [keV] : 446.218      ( -501.573 -501.573 )
Norm@50keV  : 4.86054E-03    ( -0.000968291   0.0105718 )
------------------------------------------------------------
#Fit statistic : Chi-Squared =          55.66 using 59 PHA bins.
# Reduced chi-squared =         0.9939 for     56 degrees of freedom
# Null hypothesis probability =   4.876471e-01

Photon flux (15-150 keV)    in 6.388 sec: 0.534939 ( -0.075727  0.073343 ) ph/cm2/s
Energy fluence (15-150 keV)             : 2.75496e-07 ( -4.82611e-08  4.43972e-08 ) ergs/cm2
Band function

Time interval is from   -1.684 sec. to    4.704 sec.


Spectral model in the Band function:
------------------------------------------------------------
Parameters  : value       lower 90%   higher 90%
alpha       :    (     )
beta        :     (     )
Epeak [keV] :       (   )
Norm@50keV   :     (     )
------------------------------------------------------------

Photon flux (15-150 keV)    in  sec:  (    ) ph/cm2/s
Energy fluence (15-150 keV)             : 0 ( 0  0 ) ergs/cm2
Single BB

Spectral model blackbody:
------------------------------------------------------------
Parameters  : value    Lower 90%  Upper 90%
kT [keV]    : 16.0572  (-2.75874  3.49383)
R^2/D10^2   : 4.85366E-02  (-0.0234558   0.0438232)
(R is the radius in km and D10 is the distance to the source in units of 10 kpc)
------------------------------------------------------------
#Fit statistic : Chi-Squared =          68.44 using 59 PHA bins.
# Reduced chi-squared =          1.201 for     57 degrees of freedom
# Null hypothesis probability =   1.425447e-01

Energy  Fluence     90% Error
[keV]   [erg/cm2]   [erg/cm2]
15- 25  1.652e-08   4.513e-09
25- 50  6.971e-08   1.216e-08
50-150  1.258e-07   3.411e-08
15-150  2.120e-07   3.977e-08
Thermal bremsstrahlung (OTTB)

Spectral model: thermal bremsstrahlung
------------------------------------------------------------
Parameters  : value         Lower 90%    Upper 90%
kT [keV]    : 200.000       (-62.8193      -200)
Norm        : 2.20116       (-0.292503     0.292503)
------------------------------------------------------------
#Fit statistic : Chi-Squared =          57.49 using 59 PHA bins.
# Reduced chi-squared =          1.009 for     57 degrees of freedom
# Null hypothesis probability =   4.570218e-01

Energy  Fluence     90% Error
[keV]   [erg/cm2]   [erg/cm2]
15- 25  3.502e-08   1.984e-08
25- 50  6.736e-08   3.724e-08
50-150  1.477e-07   8.237e-08
15-150  2.501e-07   1.381e-07
Double BB
Spectral model: bbodyrad<1> + bbodyrad<2>
------------------------------------------------------------
Parameters  : value         Lower 90%    Upper 90%
kT1 [keV]   : 7.59557        (-4.00048      4.9421)
R1^2/D10^2  : 0.393019        (-0.295423      5.84149)
kT2 [keV]   : 30.2705        (-11.928      -30.4113)
R2^2/D10^2  : 4.66764E-03    (-0.0043308   0.0178727)
------------------------------------------------------------
#Fit statistic : Chi-Squared =          56.62 using 59 PHA bins.
# Reduced chi-squared =          1.030 for     55 degrees of freedom
# Null hypothesis probability =   4.141470e-01

Energy  Fluence     90% Error
[keV]   [erg/cm2]   [erg/cm2]
15- 25  2.938e-08   1.700e-08
25- 50  6.644e-08   3.418e-08
50-150  1.786e-07   9.908e-08
15-150  2.744e-07   1.445e-07
Peak spectrum fit
Power-law model
Time interval is from   -0.188 sec. to    0.812 sec.

Spectral model in power-law:
------------------------------------------------------------
Parameters  : value       lower 90%   higher 90%
Photon index: 1.05621     ( -0.311489   0.300107 )
Norm@50keV  : 9.11900E-03    ( -0.00157506   0.00157093 )
------------------------------------------------------------
#Fit statistic : Chi-Squared =          56.12 using 59 PHA bins.
# Reduced chi-squared =         0.9846 for     57 degrees of freedom
# Null hypothesis probability =   5.079224e-01

Photon flux (15-150 keV)    in 1 sec: 1.05371 ( -0.185775  0.18654 ) ph/cm2/s
Energy fluence (15-150 keV)             : 9.67275e-08 ( -1.81768e-08  1.8387e-08 ) ergs/cm2
Cutoff power-law model
Time interval is from   -0.188 sec. to    0.812 sec.
Spectral model in the cutoff power-law:
------------------------------------------------------------
Parameters  : value       lower 90%   higher 90%
Photon index: 0.503666     ( -1.44886   0.701673 )
Epeak [keV] : 156.024      ( -156.022 -156.022 )
Norm@50keV  : 1.59835E-02    ( -0.00814036   0.0455376 )
------------------------------------------------------------
#Fit statistic : Chi-Squared =          55.42 using 59 PHA bins.
# Reduced chi-squared =         0.9897 for     56 degrees of freedom
# Null hypothesis probability =   4.966320e-01

Photon flux (15-150 keV)    in 1 sec: 1.02673 ( -0.194391  0.19428 ) ph/cm2/s
Energy fluence (15-150 keV)             : 9.40936e-08 ( -1.92284e-08  1.92221e-08 ) ergs/cm2
Band function

Time interval is from   -0.188 sec. to    0.812 sec.


Spectral model in the Band function:
------------------------------------------------------------
Parameters  : value       lower 90%   higher 90%
alpha       :    (     )
beta        :     (     )
Epeak [keV] :       (   )
Norm@50keV   :     (     )
------------------------------------------------------------

Photon flux (15-150 keV)    in  sec:  (    ) ph/cm2/s
Energy fluence (15-150 keV)             : 0 ( 0  0 ) ergs/cm2
Single BB
Spectral model blackbody:
------------------------------------------------------------
Parameters  : value    Lower 90%  Upper 90%
kT [keV]    : 22.2388  (-4.5634  6.19636)
R^2/D10^2   : 3.60936E-02  (-0.019246   0.0387541)
(R is the radius in km and D10 is the distance to the source in units of 10 kpc)
------------------------------------------------------------
#Fit statistic : Chi-Squared =          59.41 using 59 PHA bins.
# Reduced chi-squared =          1.042 for     57 degrees of freedom
# Null hypothesis probability =   3.878012e-01

Energy  Fluence     90% Error
[keV]   [erg/cm2]   [erg/cm2]
15- 25  3.287e-09   1.164e-09
25- 50  1.749e-08   5.310e-09
50-150  6.465e-08   2.403e-08
15-150  8.543e-08   2.469e-08
Thermal bremsstrahlung (OTTB)

Spectral model: thermal bremsstrahlung
------------------------------------------------------------
Parameters  : value         Lower 90%    Upper 90%
kT [keV]    : 200.000       (-52.1317      -200)
Norm        : 4.31442       (-0.768374     0.768374)
------------------------------------------------------------
#Fit statistic : Chi-Squared =          63.02 using 59 PHA bins.
# Reduced chi-squared =          1.106 for     57 degrees of freedom
# Null hypothesis probability =   2.718087e-01

Energy  Fluence     90% Error
[keV]   [erg/cm2]   [erg/cm2]
15- 25  1.074e-08   6.195e-09
25- 50  2.067e-08   1.154e-08
50-150  4.532e-08   2.556e-08
15-150  7.673e-08   4.398e-08
Double BB

Spectral model: bbodyrad<1> + bbodyrad<2>
------------------------------------------------------------
Parameters  : value         Lower 90%    Upper 90%
kT1 [keV]   : 6.78938        (-3.69164      6.34259)
R1^2/D10^2  : 0.769886        (-0.688719      4.26499)
kT2 [keV]   : 29.0875        (-7.99817      22.554)
R2^2/D10^2  : 1.38432E-02    (-0.0115721   0.0161581)
------------------------------------------------------------
#Fit statistic : Chi-Squared =          54.20 using 59 PHA bins.
# Reduced chi-squared =         0.9855 for     55 degrees of freedom
# Null hypothesis probability =   5.051255e-01

Energy  Fluence     90% Error
[keV]   [erg/cm2]   [erg/cm2]
15- 25  7.384e-09   4.384e-09
25- 50  1.848e-08   9.515e-09
50-150  6.979e-08   3.993e-08
15-150  9.566e-08   5.115e-08
Pre-slew spectrum (Pre-slew PHA with pre-slew DRM)
Power-law model
Spectral model in power-law:
------------------------------------------------------------
Parameters  : value       lower 90%   higher 90%
Photon index: 1.35645     ( -0.241925   0.242765 )
Norm@50keV  : 4.44975E-03    ( -0.000601699   0.000598273 )
------------------------------------------------------------
#Fit statistic : Chi-Squared =          55.67 using 59 PHA bins.
# Reduced chi-squared =         0.9767 for     57 degrees of freedom
# Null hypothesis probability =   5.249659e-01

Photon flux (15-150 keV)    in 6.388 sec: 0.536783 ( -0.0719506  0.072085 ) ph/cm2/s
Energy fluence (15-150 keV)             : 2.77221e-07 ( -4.23961e-08  4.31323e-08 ) ergs/cm2
Cutoff power-law model

Spectral model in the cutoff power-law:
------------------------------------------------------------
Parameters  : value       lower 90%   higher 90%
Photon index: 1.28497     ( -1.0291   1.35659 )
Epeak [keV] : 504.952      ( -504.952 -504.952 )
Norm@50keV  : 4.83417E-03    ( -0.000967691   0.0105724 )
------------------------------------------------------------
#Fit statistic : Chi-Squared =          55.65 using 59 PHA bins.
# Reduced chi-squared =         0.9938 for     56 degrees of freedom
# Null hypothesis probability =   4.878786e-01

Photon flux (15-150 keV)    in 6.388 sec: 0.534877 ( -0.075703  0.073582 ) ph/cm2/s
Energy fluence (15-150 keV)             : 2.75603e-07 ( -4.81987e-08  4.43755e-08 ) ergs/cm2
Band function

Spectral model in the Band function:
------------------------------------------------------------
Parameters  : value       lower 90%   higher 90%
alpha       :    (     )
beta        :     (     )
Epeak [keV] :       (   )
Norm@50keV   :     (     )
------------------------------------------------------------

Photon flux (15-150 keV)    in  sec:  (    ) ph/cm2/s
Energy fluence (15-150 keV)             : 0 ( 0  0 ) ergs/cm2
S(25-50 keV) vs. S(50-100 keV) plot

S(25-50 keV)  = 6.37e-08
S(50-100 keV) = 9.97e-08
T90 vs. Hardness ratio plot

T90                                   = 5.567999958992 sec.
Hardness ratio (energy fluence ratio) = 1.56515
Color vs. Color plot

Count Ratio  (25-50 keV) / (15-25 keV) = 1.22846
Count Ratio (50-100 keV) / (15-25 keV) = 0.990513
Mask shadow pattern
IMX = -7.830236160365243E-02, IMY = 1.174020836367789E-01
TIME vs. PHA plot around the trigger time
Blue+Cyan dotted lines: Time interval of the scaled map
From 0.000000 to 1.024000
TIME vs. DetID plot around the trigger time

Blue+Cyan dotted lines: Time interval of the scaled map
From 0.000000 to 1.024000
100 us light curve (15-350 keV)

Blue+Cyan dotted lines: Time interval of the scaled map
From 0.000000 to 1.024000
Spacecraft aspect plot
Bright source in the pre-burst/pre-slew/post-slew images
Pre-burst image of 15-350 keV band
Time interval of the image:
-239.808000 -1.684000

# RAcent  DECcent POSerr Theta    Phi  PeakCts   SNR AngSep     Name
#  [deg]    [deg]    ['] [deg]  [deg]                   [']
254.2637  35.3324    3.7  16.6   48.7   1.3272   3.1    9.5	Her X-1
299.5251  35.1217    2.2  51.0   23.0   6.9482   5.1    5.8	Cyg X-1
307.9336  40.8700   18.0  54.6   12.9   1.1590   0.6    9.4	Cyg X-3
228.8801   8.9242    4.2  31.1  139.8   1.8837   2.8 ------	UNKNOWN
174.7744  42.4991    2.4  43.8 -116.4   7.6976   4.8 ------	UNKNOWN
Pre-slew background subtracted image of 15-350 keV band
Time interval of the image:
-1.684000 4.704000

# RAcent  DECcent POSerr Theta    Phi  PeakCts   SNR AngSep     Name
#  [deg]    [deg]    ['] [deg]  [deg]                   [']
254.6856  35.2951    7.4  16.9   48.4  -0.0685  -1.6   11.5	Her X-1
299.4925  35.2672    3.1  51.0   22.8  -0.5764  -3.7    6.2	Cyg X-1
308.1682  40.9427    3.8  54.7   12.7  -0.6460  -3.1    2.7	Cyg X-3
223.7293  41.5283    1.0   8.0 -123.7   0.4234  11.4 ------	UNKNOWN
206.3364  23.0035    2.4  28.8 -167.3   0.2104   4.8 ------	UNKNOWN
213.2508  51.5131    1.9  18.6  -93.9   0.2473   5.9 ------	UNKNOWN
176.0822  17.7992    3.3  54.3 -146.3   0.5404   3.5 ------	UNKNOWN
Post-slew image of 15-350 keV band
Time interval of the image:
45.892590 242.392000

# RAcent  DECcent POSerr Theta    Phi  PeakCts   SNR AngSep     Name
#  [deg]    [deg]    ['] [deg]  [deg]                   [']
254.3721  35.4435    3.5  24.6   54.0   0.1941   3.3    7.4	Her X-1
239.2333  52.9143    2.1  15.5   -2.9   0.2093   5.5 ------	UNKNOWN
167.5228  22.1076    2.5  50.5 -134.6   0.9007   4.6 ------	UNKNOWN
Plot creation:
Tue Jul 16 16:18:22 EDT 2019