Estimated redshift from machine learning (Ukwatta et al. 2016) - may take a few minute to calcaulte
Image
Pre-slew 15.0-350.0 keV image (Event data)
#   RAcent    DECcent   POSerr    Theta     Phi              Peak Cts       SNR   Name
  293.8889   -32.7587   0.0072    23.1833   136.1281         3.0209485     26.572 TRIG_00912239

Foreground time interval of the image:
 -1.920  17.613 (delta_t =  19.533 [sec])
Background time interval of the image:
-239.688  -1.920 (delta_t = 237.768 [sec])
Lightcurves
Notes:
- 1) The mask-weighted light curves are using the flight position.
- 2) Multiple plots of different time binning/intervals are shown to cover all scenarios of short/long GRBs, rate/image triggers, and real/false positives.
- 3) For all the mask-weighted lightcurves, the y-axis units are counts/sec/det where a det is 0.4 x 0.4 = 0.16 sq cm.
- 4) The verticle lines correspond to following: green dotted lines are T50 interval, black dotted lines are T90 interval, blue solid line(s) is a spacecraft slew start time, and orange solid line(s) is a spacecraft slew end time.
- 5) Time of each bin is in the middle of the bin.
1 s binning
From T0-310 s to T0+310 s
From T100_start - 20 s to T100_end + 30 s
Full time interval

64 ms binning
Full time interval

From T100_start to T100_end
From T0-5 sec to T0+5 sec
16 ms binning
From T100_start-5 s to T100_start+5 s
Blue+Cyan dotted lines: Time interval of the scaled map
From 0.000000 to 1.024000
8 ms binning
From T100_start-3 s to T100_start+3 s

Blue+Cyan dotted lines: Time interval of the scaled map
From 0.000000 to 1.024000
2 ms binning
From T100_start-1 s to T100_start+1 s
Blue+Cyan dotted lines: Time interval of the scaled map
From 0.000000 to 1.024000
SN=5 or 10 sec. binning (whichever binning is satisfied first)
SN=5 or 10 sec. binning (T < 200 sec)

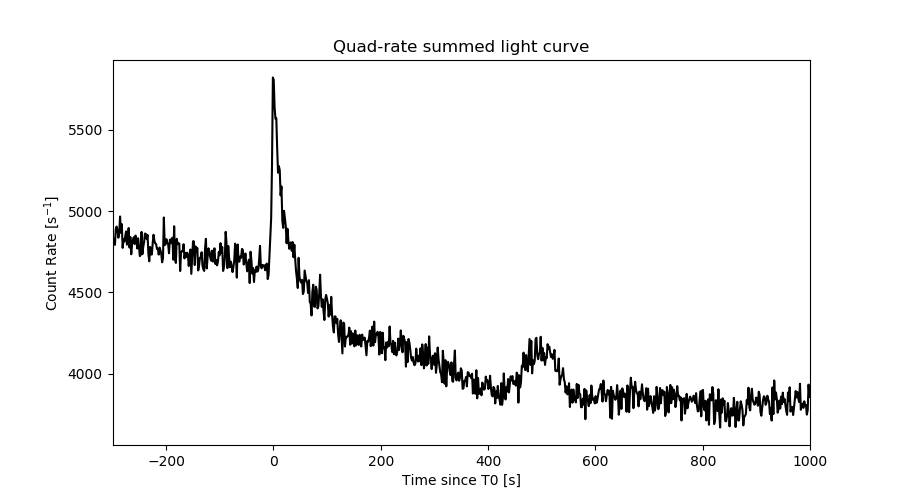
Quad-rate summed light curves (from T0-300s to T0+1000s)
Spectral Evolution

Spectra
Notes:
- 1) The fitting includes the systematic errors.
- 2) When the burst includes telescope slew time periods, the fitting uses an average response file made from multiple 5-s response files through out the slew time plus single time preiod for the non-slew times, and weighted by the total counts in the corresponding time period using addrmf. An average response file is needed becuase a spectral fit using the pre-slew DRM will introduce some errors in both a spectral shape and a normalization if the PHA file contains a lot of the slew/post-slew time interval.
- 3) For fits to more complicated models (e.g. a power-law over a cutoff power-law), the BAT team has decided to require a chi-square improvement of more than 6 for each extra dof.
Time averaged spectrum fit using the average DRM
Power-law model
Time interval is from   -1.920 sec. to   50.232 sec.

Spectral model in power-law:
------------------------------------------------------------
Parameters  : value       lower 90%   higher 90%
Photon index: 1.95752     ( -0.110399   0.112743 )
Norm@50keV  : 4.77320E-03    ( -0.000328154   0.000324601 )
------------------------------------------------------------
#Fit statistic : Chi-Squared =          58.13 using 59 PHA bins.
# Reduced chi-squared =          1.020 for     57 degrees of freedom
# Null hypothesis probability =   4.334711e-01

Photon flux (15-150 keV)    in 52.15 sec: 0.702402 ( -0.041424  0.04148 ) ph/cm2/s
Energy fluence (15-150 keV)             : 2.29168e-06 ( -1.51233e-07  1.52957e-07 ) ergs/cm2
Cutoff power-law model
Time interval is from   -1.920 sec. to   50.232 sec.
Spectral model in the cutoff power-law:
------------------------------------------------------------
Parameters  : value       lower 90%   higher 90%
Photon index: 1.29008     ( -0.610357   0.517742 )
Epeak [keV] : 44.5909      ( -8.84666 17.6956 )
Norm@50keV  : 1.14390E-02    ( -0.00556304   0.0140927 )
------------------------------------------------------------
#Fit statistic : Chi-Squared =          53.13 using 59 PHA bins.
# Reduced chi-squared =         0.9487 for     56 degrees of freedom
# Null hypothesis probability =   5.842377e-01

Photon flux (15-150 keV)    in 52.15 sec: 0.677605 ( -0.045614  0.045461 ) ph/cm2/s
Energy fluence (15-150 keV)             : 2.11999e-06 ( -1.92137e-07  1.9812e-07 ) ergs/cm2
Band function

Time interval is from   -1.920 sec. to   50.232 sec.


Spectral model in the Band function:
------------------------------------------------------------
Parameters  : value       lower 90%   higher 90%
alpha       :    (     )
beta        :     (     )
Epeak [keV] :       (   )
Norm@50keV   :     (     )
------------------------------------------------------------

Photon flux (15-150 keV)    in  sec:  (    ) ph/cm2/s
Energy fluence (15-150 keV)             : 0 ( 0  0 ) ergs/cm2
Single BB
Spectral model blackbody:
------------------------------------------------------------
Parameters  : value    Lower 90%  Upper 90%
kT [keV]    : 10.1474  (-0.644109  0.698682)
R^2/D10^2   : 0.303150  (-0.0695432   0.0889414)
(R is the radius in km and D10 is the distance to the source in units of 10 kpc)
------------------------------------------------------------
#Fit statistic : Chi-Squared =          88.17 using 59 PHA bins.
# Reduced chi-squared =          1.547 for     57 degrees of freedom
# Null hypothesis probability =   5.070151e-03

Energy  Fluence     90% Error
[keV]   [erg/cm2]   [erg/cm2]
15- 25  3.331e-07   3.296e-08
25- 50  8.455e-07   5.476e-08
50-150  4.603e-07   6.952e-08
15-150  1.639e-06   1.082e-07
Thermal bremsstrahlung (OTTB)

Spectral model: thermal bremsstrahlung
------------------------------------------------------------
Parameters  : value         Lower 90%    Upper 90%
kT [keV]    : 70.4140       (-12.2699      16.7876)
Norm        : 3.41603       (-0.330773     0.375897)
------------------------------------------------------------
#Fit statistic : Chi-Squared =          52.96 using 59 PHA bins.
# Reduced chi-squared =         0.9291 for     57 degrees of freedom
# Null hypothesis probability =   6.273567e-01

Energy  Fluence     90% Error
[keV]   [erg/cm2]   [erg/cm2]
15- 25  4.573e-07   3.690e-08
25- 50  7.288e-07   4.563e-08
50-150  9.402e-07   1.437e-07
15-150  2.126e-06   1.554e-07
Double BB

Spectral model: bbodyrad<1> + bbodyrad<2>
------------------------------------------------------------
Parameters  : value         Lower 90%    Upper 90%
kT1 [keV]   : 8.15031        (-1.06017      0.955857)
R1^2/D10^2  : 0.605602        (-0.189676      0.338688)
kT2 [keV]   : 38.2235        (-15.2803      92.5006)
R2^2/D10^2  : 1.37478E-03    (-0.00124565   0.00639035)
------------------------------------------------------------
#Fit statistic : Chi-Squared =          47.51 using 59 PHA bins.
# Reduced chi-squared =         0.8638 for     55 degrees of freedom
# Null hypothesis probability =   7.534412e-01

Energy  Fluence     90% Error
[keV]   [erg/cm2]   [erg/cm2]
15- 25  3.985e-07   5.588e-08
25- 50  7.888e-07   1.207e-07
50-150  1.042e-06   4.810e-07
15-150  2.229e-06   5.950e-07
Peak spectrum fit
Power-law model

Time interval is from   -0.120 sec. to    0.880 sec.

Spectral model in power-law:
------------------------------------------------------------
Parameters  : value       lower 90%   higher 90%
Photon index: 1.31418     ( -0.257131   0.257491 )
Norm@50keV  : 1.66639E-02    ( -0.00244744   0.00243949 )
------------------------------------------------------------
#Fit statistic : Chi-Squared =          50.40 using 59 PHA bins.
# Reduced chi-squared =         0.8843 for     57 degrees of freedom
# Null hypothesis probability =   7.191400e-01

Photon flux (15-150 keV)    in 1 sec: 1.99335 ( -0.29428  0.29488 ) ph/cm2/s
Energy fluence (15-150 keV)             : 1.64127e-07 ( -2.71051e-08  2.74485e-08 ) ergs/cm2
Cutoff power-law model

Time interval is from   -0.120 sec. to    0.880 sec.
Spectral model in the cutoff power-law:
------------------------------------------------------------
Parameters  : value       lower 90%   higher 90%
Photon index: 1.15051     ( -1.18721   1.31744 )
Epeak [keV] : 270.764      ( -270.778 -270.778 )
Norm@50keV  : 2.00571E-02    ( -0.00572954   0.0533114 )
------------------------------------------------------------
#Fit statistic : Chi-Squared =          50.33 using 59 PHA bins.
# Reduced chi-squared =         0.8987 for     56 degrees of freedom
# Null hypothesis probability =   6.885154e-01

Photon flux (15-150 keV)    in 1 sec: 1.98024 ( -0.30616  0.30353 ) ph/cm2/s
Energy fluence (15-150 keV)             : 1.62301e-07 ( -2.97479e-08  2.88119e-08 ) ergs/cm2
Band function

Time interval is from   -0.120 sec. to    0.880 sec.


Spectral model in the Band function:
------------------------------------------------------------
Parameters  : value       lower 90%   higher 90%
alpha       :    (     )
beta        :     (     )
Epeak [keV] :       (   )
Norm@50keV   :     (     )
------------------------------------------------------------

Photon flux (15-150 keV)    in  sec:  (    ) ph/cm2/s
Energy fluence (15-150 keV)             : 0 ( 0  0 ) ergs/cm2
Single BB

Spectral model blackbody:
------------------------------------------------------------
Parameters  : value    Lower 90%  Upper 90%
kT [keV]    : 17.1527  (-2.94004  3.69947)
R^2/D10^2   : 0.149398  (-0.0719765   0.131525)
(R is the radius in km and D10 is the distance to the source in units of 10 kpc)
------------------------------------------------------------
#Fit statistic : Chi-Squared =          59.63 using 59 PHA bins.
# Reduced chi-squared =          1.046 for     57 degrees of freedom
# Null hypothesis probability =   3.801935e-01

Energy  Fluence     90% Error
[keV]   [erg/cm2]   [erg/cm2]
15- 25  8.930e-09   2.505e-09
25- 50  3.979e-08   9.350e-09
50-150  8.382e-08   2.491e-08
15-150  1.326e-07   3.221e-08
Thermal bremsstrahlung (OTTB)

Spectral model: thermal bremsstrahlung
------------------------------------------------------------
Parameters  : value         Lower 90%    Upper 90%
kT [keV]    : 200.000       (-61.1985      -200)
Norm        : 8.19781       (-1.20077     1.20077)
------------------------------------------------------------
#Fit statistic : Chi-Squared =          52.73 using 59 PHA bins.
# Reduced chi-squared =         0.9251 for     57 degrees of freedom
# Null hypothesis probability =   6.359371e-01

Energy  Fluence     90% Error
[keV]   [erg/cm2]   [erg/cm2]
15- 25  2.041e-08   1.151e-08
25- 50  3.927e-08   2.189e-08
50-150  8.612e-08   4.814e-08
15-150  1.458e-07   8.310e-08
Double BB

Spectral model: bbodyrad<1> + bbodyrad<2>
------------------------------------------------------------
Parameters  : value         Lower 90%    Upper 90%
kT1 [keV]   : 5.26501        (-2.67462      8.7046)
R1^2/D10^2  : 4.47296        (-4.11495      118.553)
kT2 [keV]   : 23.1210        (-6.06415      -23.2155)
R2^2/D10^2  : 4.82375E-02    (-0.0464164   0.0926619)
------------------------------------------------------------
#Fit statistic : Chi-Squared =          51.19 using 59 PHA bins.
# Reduced chi-squared =         0.9308 for     55 degrees of freedom
# Null hypothesis probability =   6.208345e-01

Energy  Fluence     90% Error
[keV]   [erg/cm2]   [erg/cm2]
15- 25  1.798e-08   1.033e-08
25- 50  3.522e-08   1.490e-08
50-150  1.018e-07   5.865e-08
15-150  1.550e-07   8.200e-08
Pre-slew spectrum (Pre-slew PHA with pre-slew DRM)
Power-law model

Spectral model in power-law:
------------------------------------------------------------
Parameters  : value       lower 90%   higher 90%
Photon index: 1.80984     ( -0.101519   0.102935 )
Norm@50keV  : 9.49258E-03    ( -0.000584243   0.000579329 )
------------------------------------------------------------
#Fit statistic : Chi-Squared =          64.38 using 59 PHA bins.
# Reduced chi-squared =          1.130 for     57 degrees of freedom
# Null hypothesis probability =   2.340218e-01

Photon flux (15-150 keV)    in 19.53 sec: 1.31308 ( -0.0732974  0.0733788 ) ph/cm2/s
Energy fluence (15-150 keV)             : 1.70615e-06 ( -1.06626e-07  1.07574e-07 ) ergs/cm2
Cutoff power-law model

Spectral model in the cutoff power-law:
------------------------------------------------------------
Parameters  : value       lower 90%   higher 90%
Photon index: 1.37818     ( -0.485866   0.425192 )
Epeak [keV] : 62.9023      ( -14.4349 421.366 )
Norm@50keV  : 1.65051E-02    ( -0.00680207   0.0141709 )
------------------------------------------------------------
#Fit statistic : Chi-Squared =          61.40 using 59 PHA bins.
# Reduced chi-squared =          1.096 for     56 degrees of freedom
# Null hypothesis probability =   2.887849e-01

Photon flux (15-150 keV)    in 19.53 sec: 1.28361 ( -0.07887  0.07862 ) ph/cm2/s
Energy fluence (15-150 keV)             : 1.62317e-06 ( -1.33997e-07  1.34521e-07 ) ergs/cm2
Band function
Spectral model in the Band function:
------------------------------------------------------------
Parameters  : value       lower 90%   higher 90%
alpha       :    (     )
beta        :     (     )
Epeak [keV] :       (   )
Norm@50keV   :     (     )
------------------------------------------------------------

Photon flux (15-150 keV)    in  sec:  (    ) ph/cm2/s
Energy fluence (15-150 keV)             : 0 ( 0  0 ) ergs/cm2
S(25-50 keV) vs. S(50-100 keV) plot

S(25-50 keV)  = 6.83e-07
S(50-100 keV) = 6.99e-07
T90 vs. Hardness ratio plot

T90                                   = 38.3839999437332 sec.
Hardness ratio (energy fluence ratio) = 1.02343
Color vs. Color plot
Count Ratio  (25-50 keV) / (15-25 keV) = 1.16208
Count Ratio (50-100 keV) / (15-25 keV) = 0.525704
Mask shadow pattern
IMX = -3.087256181757651E-01, IMY = -2.968017969461657E-01
TIME vs. PHA plot around the trigger time
Blue+Cyan dotted lines: Time interval of the scaled map
From 0.000000 to 1.024000
TIME vs. DetID plot around the trigger time
Blue+Cyan dotted lines: Time interval of the scaled map
From 0.000000 to 1.024000
100 us light curve (15-350 keV)
Blue+Cyan dotted lines: Time interval of the scaled map
From 0.000000 to 1.024000
Spacecraft aspect plot

Bright source in the pre-burst/pre-slew/post-slew images
Pre-burst image of 15-350 keV band
Time interval of the image:
-239.688000 -1.920000

# RAcent  DECcent POSerr Theta    Phi  PeakCts   SNR AngSep     Name
#  [deg]    [deg]    ['] [deg]  [deg]                   [']
244.9983 -15.6615    1.0  26.4  -78.0   8.4416  12.1    1.7	Sco X-1
254.3554  35.3478    5.1  57.7   -9.8  -6.0254  -2.2    5.0	Her X-1
255.8835 -37.8600    6.2  23.1 -137.5   1.0255   1.9    5.0	4U 1700-377
256.2572 -36.4604    4.9  21.9 -135.6   1.2859   2.3    8.9	GX 349+2
262.8568 -24.9027    0.0  10.2 -114.5   0.4602   0.8   12.6	GX 1+4
264.6890 -44.4990    9.7  25.6 -159.6   0.6882   1.2    3.7	4U 1735-44
268.2117  -1.3241    6.9  18.9   -5.5   0.9117   1.7   12.1	SW J1753.5-0127
270.3006 -25.0795    3.2   5.7 -152.8   1.9544   3.6    0.9	GX 5-1
270.2923 -25.8592   21.8   6.4 -155.2   0.2931   0.5    7.0	GRS 1758-258
273.9717 -13.9981    4.4   5.9   22.5   1.4277   2.6    3.0	GX 17+2
275.8360 -30.5314    7.2  11.2  172.3  -0.7935  -1.6   10.9	H1820-303
285.1798 -24.8169   10.8  12.9  123.2   0.6372   1.1   10.0	HT1900.1-2455
288.6779  10.8694   17.4  34.5   36.6   0.5911   0.7    8.4	GRS 1915+105
263.0778 -33.9799    6.5  16.5 -144.1   0.8891   1.8    9.8	GX 354-0
285.3274  23.2084    2.9  44.7   24.6   4.2917   4.1 ------	UNKNOWN
311.3981 -58.6919    2.3  48.0  161.5  14.3286   5.1 ------	UNKNOWN
Pre-slew background subtracted image of 15-350 keV band
Time interval of the image:
-1.920000 17.612590

# RAcent  DECcent POSerr Theta    Phi  PeakCts   SNR AngSep     Name
#  [deg]    [deg]    ['] [deg]  [deg]                   [']
244.9173 -15.5564    6.8  26.5  -77.8   0.1699   1.7    6.2	Sco X-1
254.5630  35.2753    6.6  57.5   -9.6  -0.7252  -1.8    6.5	Her X-1
255.7997 -37.7254   10.4  23.1 -137.2   0.1008   1.1   11.4	4U 1700-377
256.3269 -36.2748   12.6  21.7 -135.3  -0.0828  -0.9   10.3	GX 349+2
263.1400 -24.6293    3.9   9.9 -113.8   0.2308   2.9   10.0	GX 1+4
264.6709 -44.5709    4.0  25.7 -159.6   0.2488   2.9    7.9	4U 1735-44
268.5058  -1.4069    3.5  18.7   -4.6   0.2566   3.3    8.7	SW J1753.5-0127
270.2864 -25.0813  233.1   5.7 -152.7   0.0039   0.0    0.2	GX 5-1
270.3144 -25.7526 2493.9   6.3 -155.0   0.0003   0.0    0.9	GRS 1758-258
274.0496 -14.1818   12.0   5.8   23.7   0.0792   1.0    9.1	GX 17+2
275.9083 -30.3887   28.3  11.1  171.7  -0.0311  -0.4    1.6	H1820-303
284.9091 -25.0986    0.0  12.7  124.8  -0.0889  -1.0   12.7	HT1900.1-2455
288.6855  10.8398    7.8  34.5   36.7   0.2169   1.5    9.2	GRS 1915+105
262.8097 -33.8025   11.9  16.5 -143.1   0.0793   1.0    9.1	GX 354-0
293.8889 -32.7587    0.4  23.2  136.1   3.0206  26.6 ------	UNKNOWN
226.0174 -37.5606    2.4  43.9 -116.5   1.5244   4.7 ------	UNKNOWN
Post-slew image of 15-350 keV band
Time interval of the image:
135.012600 414.312600

# RAcent  DECcent POSerr Theta    Phi  PeakCts   SNR AngSep     Name
#  [deg]    [deg]    ['] [deg]  [deg]                   [']
255.9796 -37.8133    6.6  31.1   36.1  -1.3937  -1.7    1.9	4U 1700-377
256.5407 -36.5314    5.5  30.7   38.7  -1.7226  -2.1    8.3	GX 349+2
262.9747 -24.5720   45.7  28.2   65.2   0.2420   0.3   10.6	GX 1+4
264.7047 -44.2941    3.6  25.3   20.8  -2.1988  -3.2    9.5	4U 1735-44
270.1521 -25.1567    6.0  22.0   70.4  -1.6004  -2.1    8.6	GX 5-1
270.2946 -25.5366    7.4  21.7   69.6  -1.2865  -1.7   12.4	GRS 1758-258
274.0483 -13.8935    8.5  26.1   97.9   1.3331   1.4    8.9	GX 17+2
276.0282 -30.4901    5.2  15.3   60.1   1.2183   2.2    9.1	H1820-303
285.0380 -24.9136   67.1  11.0   99.7   0.1026   0.2    0.4	HT1900.1-2455
288.9592  10.9618    7.5  44.0  139.3  -5.4862  -1.5    9.5	GRS 1915+105
263.0161 -33.9907  186.6  25.7   45.0  -0.0453  -0.1    9.5	GX 354-0
273.9622 -37.6430    2.7  16.9   34.0   2.3479   4.3 ------	UNKNOWN
247.9395 -54.4475    2.9  38.7    8.2   3.1149   4.0 ------	UNKNOWN
313.8512   0.8332    3.2  38.6  179.5   3.2303   3.6 ------	UNKNOWN
327.0265 -75.1647    2.1  45.3  -45.1   7.2195   5.6 ------	UNKNOWN
Plot creation:
Tue Jul 16 15:30:46 EDT 2019