Estimated redshift from machine learning (Ukwatta et al. 2016) - may take a few minute to calcaulte
Image
Pre-slew 15.0-350.0 keV image (Event data)

#   RAcent    DECcent   POSerr    Theta     Phi              Peak Cts       SNR   Name
  341.1816   -29.7446   0.0132    29.6778    55.4667         4.8690528     14.637 TRIG_00920783

Foreground time interval of the image:
-12.499  83.701 (delta_t =  96.200 [sec])
Background time interval of the image:
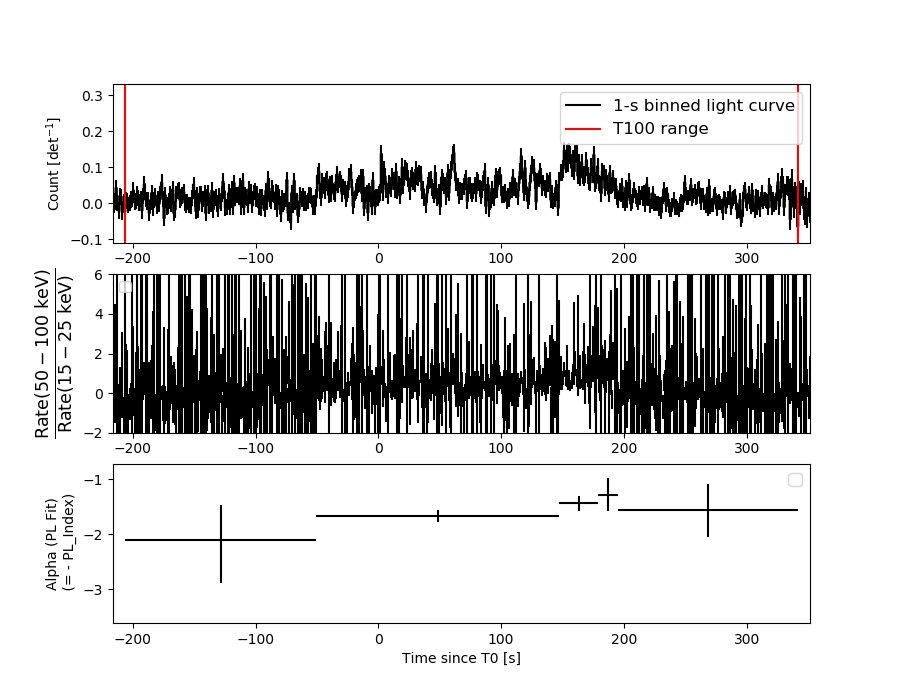
Lightcurves
Notes:
- 1) The mask-weighted light curves are using the flight position.
- 2) Multiple plots of different time binning/intervals are shown to cover all scenarios of short/long GRBs, rate/image triggers, and real/false positives.
- 3) For all the mask-weighted lightcurves, the y-axis units are counts/sec/det where a det is 0.4 x 0.4 = 0.16 sq cm.
- 4) The verticle lines correspond to following: green dotted lines are T50 interval, black dotted lines are T90 interval, blue solid line(s) is a spacecraft slew start time, and orange solid line(s) is a spacecraft slew end time.
- 5) Time of each bin is in the middle of the bin.
1 s binning
From T0-310 s to T0+310 s

From T100_start - 20 s to T100_end + 30 s

Full time interval

64 ms binning
Full time interval

From T100_start to T100_end

From T0-5 sec to T0+5 sec

16 ms binning
From T100_start-5 s to T100_start+5 s

Blue+Cyan dotted lines: Time interval of the scaled map
From 0.000000 to 80.000000
8 ms binning
From T100_start-3 s to T100_start+3 s

Blue+Cyan dotted lines: Time interval of the scaled map
From 0.000000 to 80.000000
2 ms binning
From T100_start-1 s to T100_start+1 s

Blue+Cyan dotted lines: Time interval of the scaled map
From 0.000000 to 80.000000
SN=5 or 10 sec. binning (whichever binning is satisfied first)

SN=5 or 10 sec. binning (T < 200 sec)

Quad-rate summed light curves (from T0-300s to T0+1000s)

Spectral Evolution
Spectra
Notes:
- 1) The fitting includes the systematic errors.
- 2) When the burst includes telescope slew time periods, the fitting uses an average response file made from multiple 5-s response files through out the slew time plus single time preiod for the non-slew times, and weighted by the total counts in the corresponding time period using addrmf. An average response file is needed becuase a spectral fit using the pre-slew DRM will introduce some errors in both a spectral shape and a normalization if the PHA file contains a lot of the slew/post-slew time interval.
- 3) For fits to more complicated models (e.g. a power-law over a cutoff power-law), the BAT team has decided to require a chi-square improvement of more than 6 for each extra dof.
Time averaged spectrum fit using the average DRM
Power-law model

Time interval is from -206.480 sec. to  341.552 sec.

Spectral model in power-law:
------------------------------------------------------------
Parameters  : value       lower 90%   higher 90%
Photon index: 1.61867     ( -0.105697   0.10657 )
Norm@50keV  : 1.90910E-03    ( -0.000112469   0.000111916 )
------------------------------------------------------------
#Fit statistic : Chi-Squared =          44.33 using 59 PHA bins.
# Reduced chi-squared =         0.7778 for     57 degrees of freedom
# Null hypothesis probability =   8.895547e-01

Photon flux (15-150 keV)    in 548 sec: 0.246776 ( -0.014475  0.014512 ) ph/cm2/s
Energy fluence (15-150 keV)             : 9.76383e-06 ( -6.15311e-07  6.19596e-07 ) ergs/cm2
Cutoff power-law model

Time interval is from -206.480 sec. to  341.552 sec.
Spectral model in the cutoff power-law:
------------------------------------------------------------
Parameters  : value       lower 90%   higher 90%
Photon index: 1.61978     ( -0.108336   0.10545 )
Epeak [keV] : 9999.36      ( -9999.36 -9999.36 )
Norm@50keV  : 1.90717E-03    ( -0.000345459   0.000885329 )
------------------------------------------------------------
#Fit statistic : Chi-Squared =          44.34 using 59 PHA bins.
# Reduced chi-squared =         0.7919 for     56 degrees of freedom
# Null hypothesis probability =   8.695895e-01

Photon flux (15-150 keV)    in 548 sec: 0.247419 ( -0.017141  0.01528 ) ph/cm2/s
Energy fluence (15-150 keV)             : 9.79402e-06 ( -7.10159e-07  5.00605e-07 ) ergs/cm2
Band function

Time interval is from -206.480 sec. to  341.552 sec.


Spectral model in the Band function:
------------------------------------------------------------
Parameters  : value       lower 90%   higher 90%
alpha       :    (     )
beta        :     (     )
Epeak [keV] :       (   )
Norm@50keV   :     (     )
------------------------------------------------------------

Photon flux (15-150 keV)    in  sec:  (    ) ph/cm2/s
Energy fluence (15-150 keV)             : 0 ( 0  0 ) ergs/cm2
Single BB

Spectral model blackbody:
------------------------------------------------------------
Parameters  : value    Lower 90%  Upper 90%
kT [keV]    : 14.6248  (  )
R^2/D10^2   : 2.86187E-02  (   )
(R is the radius in km and D10 is the distance to the source in units of 10 kpc)
------------------------------------------------------------
#Fit statistic : Chi-Squared =         143.35 using 59 PHA bins.
# Reduced chi-squared =         2.5149 for     57 degrees of freedom
# Null hypothesis probability =   2.189413e-09

Energy  Fluence     90% Error
[keV]   [erg/cm2]   [erg/cm2]
15- 25  7.050e-07   8.028e-08
25- 50  2.736e-06   2.137e-07
50-150  3.936e-06   4.724e-07
15-150  7.377e-06   5.124e-07
Thermal bremsstrahlung (OTTB)

Spectral model: thermal bremsstrahlung
------------------------------------------------------------
Parameters  : value         Lower 90%    Upper 90%
kT [keV]    : 185.683       (-51.4997      -184.791)
Norm        : 0.993794       (-0.059583     0.0696148)
------------------------------------------------------------
#Fit statistic : Chi-Squared =          47.28 using 59 PHA bins.
# Reduced chi-squared =         0.8294 for     57 degrees of freedom
# Null hypothesis probability =   8.172047e-01

Energy  Fluence     90% Error
[keV]   [erg/cm2]   [erg/cm2]
15- 25  1.368e-06   1.167e-07
25- 50  2.610e-06   4.776e-07
50-150  5.587e-06   2.419e-06
15-150  9.565e-06   2.939e-06
Double BB

Spectral model: bbodyrad<1> + bbodyrad<2>
------------------------------------------------------------
Parameters  : value         Lower 90%    Upper 90%
kT1 [keV]   : 5.93061        (-0.912408      1.04722)
R1^2/D10^2  : 0.522425        (-0.239189      0.496574)
kT2 [keV]   : 25.5590        (-3.59548      5.12926)
R2^2/D10^2  : 3.33537E-03    (-0.00156291   0.00241163)
------------------------------------------------------------
#Fit statistic : Chi-Squared =          42.13 using 59 PHA bins.
# Reduced chi-squared =         0.7659 for     55 degrees of freedom
# Null hypothesis probability =   8.986681e-01

Energy  Fluence     90% Error
[keV]   [erg/cm2]   [erg/cm2]
15- 25  1.520e-06   3.017e-07
25- 50  2.455e-06   3.567e-07
50-150  5.788e-06   1.163e-06
15-150  9.763e-06   1.422e-06
Peak spectrum fit
Power-law model

Time interval is from  151.572 sec. to  152.572 sec.

Spectral model in power-law:
------------------------------------------------------------
Parameters  : value       lower 90%   higher 90%
Photon index: 1.91730     ( -0.386008   0.446182 )
Norm@50keV  : 8.86763E-03    ( -0.00275317   0.002649 )
------------------------------------------------------------
#Fit statistic : Chi-Squared =          73.17 using 59 PHA bins.
# Reduced chi-squared =          1.284 for     57 degrees of freedom
# Null hypothesis probability =   7.320159e-02

Photon flux (15-150 keV)    in 1 sec: 1.28213 ( -0.324947  0.32498 ) ph/cm2/s
Energy fluence (15-150 keV)             : 8.15511e-08 ( -2.39846e-08  2.47824e-08 ) ergs/cm2
Cutoff power-law model

Time interval is from  151.572 sec. to  152.572 sec.
Spectral model in the cutoff power-law:
------------------------------------------------------------
Parameters  : value       lower 90%   higher 90%
Photon index: 0.428527     ( -2.42453   1.56307 )
Epeak [keV] : 47.8596      (   )
Norm@50keV  : 5.91427E-02    (     )
------------------------------------------------------------
#Fit statistic : Chi-Squared =          70.53 using 59 PHA bins.
# Reduced chi-squared =          1.259 for     56 degrees of freedom
# Null hypothesis probability =   9.157560e-02

Photon flux (15-150 keV)    in 1 sec: 1.26699 ( -0.323326  0.32398 ) ph/cm2/s
Energy fluence (15-150 keV)             : 7.7707e-08 ( -2.30948e-08  2.48724e-08 ) ergs/cm2
Band function

Time interval is from  151.572 sec. to  152.572 sec.


Spectral model in the Band function:
------------------------------------------------------------
Parameters  : value       lower 90%   higher 90%
alpha       :    (     )
beta        :     (     )
Epeak [keV] :       (   )
Norm@50keV   :     (     )
------------------------------------------------------------

Photon flux (15-150 keV)    in  sec:  (    ) ph/cm2/s
Energy fluence (15-150 keV)             : 0 ( 0  0 ) ergs/cm2
Single BB

Spectral model blackbody:
------------------------------------------------------------
Parameters  : value    Lower 90%  Upper 90%
kT [keV]    : 11.4618  (-2.87412  3.79582)
R^2/D10^2   : 0.395365  (-0.260272   0.742498)
(R is the radius in km and D10 is the distance to the source in units of 10 kpc)
------------------------------------------------------------
#Fit statistic : Chi-Squared =          72.56 using 59 PHA bins.
# Reduced chi-squared =          1.273 for     57 degrees of freedom
# Null hypothesis probability =   8.021661e-02

Energy  Fluence     90% Error
[keV]   [erg/cm2]   [erg/cm2]
15- 25  1.093e-08   5.406e-09
25- 50  3.255e-08   1.499e-08
50-150  2.490e-08   1.567e-08
15-150  6.838e-08   3.222e-08
Thermal bremsstrahlung (OTTB)

Spectral model: thermal bremsstrahlung
------------------------------------------------------------
Parameters  : value         Lower 90%    Upper 90%
kT [keV]    : 76.5134       (-36.807      113.062)
Norm        : 6.31820       (-1.92802     2.64251)
------------------------------------------------------------
#Fit statistic : Chi-Squared =          71.30 using 59 PHA bins.
# Reduced chi-squared =          1.251 for     57 degrees of freedom
# Null hypothesis probability =   9.639545e-02

Energy  Fluence     90% Error
[keV]   [erg/cm2]   [erg/cm2]
15- 25  1.634e-08   6.009e-09
25- 50  2.661e-08   1.326e-08
50-150  3.644e-08   3.006e-08
15-150  7.939e-08   4.862e-08
Double BB

Spectral model: bbodyrad<1> + bbodyrad<2>
------------------------------------------------------------
Parameters  : value         Lower 90%    Upper 90%
kT1 [keV]   : 5.09100        (-5.10156      -5.10156)
R1^2/D10^2  : 3.95476        (-3.93953      -3.93953)
kT2 [keV]   : 15.7904        (-15.8055      -15.8055)
R2^2/D10^2  : 9.48760E-02    (-0.0945085   0.462146)
------------------------------------------------------------
#Fit statistic : Chi-Squared =          70.09 using 59 PHA bins.
# Reduced chi-squared =          1.274 for     55 degrees of freedom
# Null hypothesis probability =   8.269122e-02

Energy  Fluence     90% Error
[keV]   [erg/cm2]   [erg/cm2]
15- 25  1.524e-08   8.290e-09
25- 50  2.746e-08   1.463e-08
50-150  3.570e-08   2.250e-08
15-150  7.839e-08   4.165e-08
Pre-slew spectrum (Pre-slew PHA with pre-slew DRM)
Power-law model

Spectral model in power-law:
------------------------------------------------------------
Parameters  : value       lower 90%   higher 90%
Photon index: 1.60223     ( -0.145627   0.147557 )
Norm@50keV  : 3.10386E-03    ( -0.000276415   0.000274174 )
------------------------------------------------------------
#Fit statistic : Chi-Squared =          44.07 using 59 PHA bins.
# Reduced chi-squared =         0.7731 for     57 degrees of freedom
# Null hypothesis probability =   8.950154e-01

Photon flux (15-150 keV)    in 96.2 sec: 0.399136 ( -0.0339467  0.0339762 ) ph/cm2/s
Energy fluence (15-150 keV)             : 2.7917e-06 ( -2.66552e-07  2.6909e-07 ) ergs/cm2
Cutoff power-law model

Spectral model in the cutoff power-law:
------------------------------------------------------------
Parameters  : value       lower 90%   higher 90%
Photon index: 1.24484     ( -0.646631   0.43159 )
Epeak [keV] : 99.9916      ( -38.2849 -99.9964 )
Norm@50keV  : 4.80496E-03    ( -0.00190536   0.00561318 )
------------------------------------------------------------
#Fit statistic : Chi-Squared =          42.93 using 59 PHA bins.
# Reduced chi-squared =         0.7666 for     56 degrees of freedom
# Null hypothesis probability =   9.001611e-01

Photon flux (15-150 keV)    in 96.2 sec: 0.393404 ( -0.035265  0.03515 ) ph/cm2/s
Energy fluence (15-150 keV)             : 2.7067e-06 ( -3.01068e-07  2.95344e-07 ) ergs/cm2
Band function

Spectral model in the Band function:
------------------------------------------------------------
Parameters  : value       lower 90%   higher 90%
alpha       :    (     )
beta        :     (     )
Epeak [keV] :       (   )
Norm@50keV   :     (     )
------------------------------------------------------------

Photon flux (15-150 keV)    in  sec:  (    ) ph/cm2/s
Energy fluence (15-150 keV)             : 0 ( 0  0 ) ergs/cm2
S(25-50 keV) vs. S(50-100 keV) plot

S(25-50 keV)  = 2.55e-06
S(50-100 keV) = 3.33e-06
T90 vs. Hardness ratio plot

T90                                   = 375.759999990463 sec.
Hardness ratio (energy fluence ratio) = 1.30588
Color vs. Color plot

Count Ratio  (25-50 keV) / (15-25 keV) = 1.14371
Count Ratio (50-100 keV) / (15-25 keV) = 0.893643
Mask shadow pattern

IMX = 3.230544599709423E-01, IMY = -4.694627845241600E-01
TIME vs. PHA plot around the trigger time

Blue+Cyan dotted lines: Time interval of the scaled map
From 0.000000 to 80.000000
TIME vs. DetID plot around the trigger time

Blue+Cyan dotted lines: Time interval of the scaled map
From 0.000000 to 80.000000
100 us light curve (15-350 keV)

Blue+Cyan dotted lines: Time interval of the scaled map
From 0.000000 to 80.000000
Spacecraft aspect plot

Bright source in the pre-burst/pre-slew/post-slew images
Pre-burst image of 15-350 keV band
Time interval of the image:
Pre-slew background subtracted image of 15-350 keV band
Time interval of the image:
-12.499380 83.700610

# RAcent  DECcent POSerr Theta    Phi  PeakCts   SNR AngSep     Name
#  [deg]    [deg]    ['] [deg]  [deg]                   [']
326.2914 -28.0396    3.4  42.8   57.5   2.3256   3.4 ------	UNKNOWN
354.7226  15.3589    2.7  44.1  135.7   4.4944   4.3 ------	UNKNOWN
316.8564 -45.0342    2.6  50.1   33.8   3.1599   4.5 ------	UNKNOWN
341.1816 -29.7446    0.8  29.7   55.5   4.8692  14.6 ------	UNKNOWN
 29.6782 -16.4251    2.3  16.6 -132.7   0.9628   5.1 ------	UNKNOWN
 40.1332  23.3534    1.8  54.1 -167.0   4.2461   6.4 ------	UNKNOWN
 45.6648   2.9771    2.5  41.1 -144.2   1.4731   4.6 ------	UNKNOWN
 48.8767 -25.4627    2.7  31.5  -97.5   1.2209   4.3 ------	UNKNOWN
Post-slew image of 15-350 keV band
Time interval of the image:
97.900600 196.700610

# RAcent  DECcent POSerr Theta    Phi  PeakCts   SNR AngSep     Name
#  [deg]    [deg]    ['] [deg]  [deg]                   [']
343.9737   6.4639    2.8  40.8  115.5   2.9633   4.1 ------	UNKNOWN
341.1671 -29.7336    0.7  29.6   52.7   6.5193  17.5 ------	UNKNOWN
358.2333  -1.3642    2.3  25.7  127.0   1.5574   5.1  133.9	UNKNOWN
 18.3420 -63.6454    2.0  41.2  -19.9   1.8194   5.8 ------	UNKNOWN
 56.3678   4.7862    2.9  50.3 -134.0   4.3543   4.0 ------	UNKNOWN
Plot creation:
Wed Oct  9 18:11:01 EDT 2019