Special notes of this burst
Image
Pre-slew 15.0-350.0 keV image (Event data)

#   RAcent    DECcent   POSerr    Theta     Phi              Peak Cts       SNR   Name
   44.5419    -8.9579   0.0161    53.0564   169.5545        11.4549532     11.887 TRIG_00922968

Foreground time interval of the image:
-51.896  12.005 (delta_t =  63.901 [sec])
Background time interval of the image:
-153.795 -51.896 (delta_t = 101.899 [sec])
Lightcurves
Notes:
- 1) The mask-weighted light curves are using the flight position.
- 2) Multiple plots of different time binning/intervals are shown to cover all scenarios of short/long GRBs, rate/image triggers, and real/false positives.
- 3) For all the mask-weighted lightcurves, the y-axis units are counts/sec/det where a det is 0.4 x 0.4 = 0.16 sq cm.
- 4) The verticle lines correspond to following: green dotted lines are T50 interval, black dotted lines are T90 interval, blue solid line(s) is a spacecraft slew start time, and orange solid line(s) is a spacecraft slew end time.
- 5) Time of each bin is in the middle of the bin.
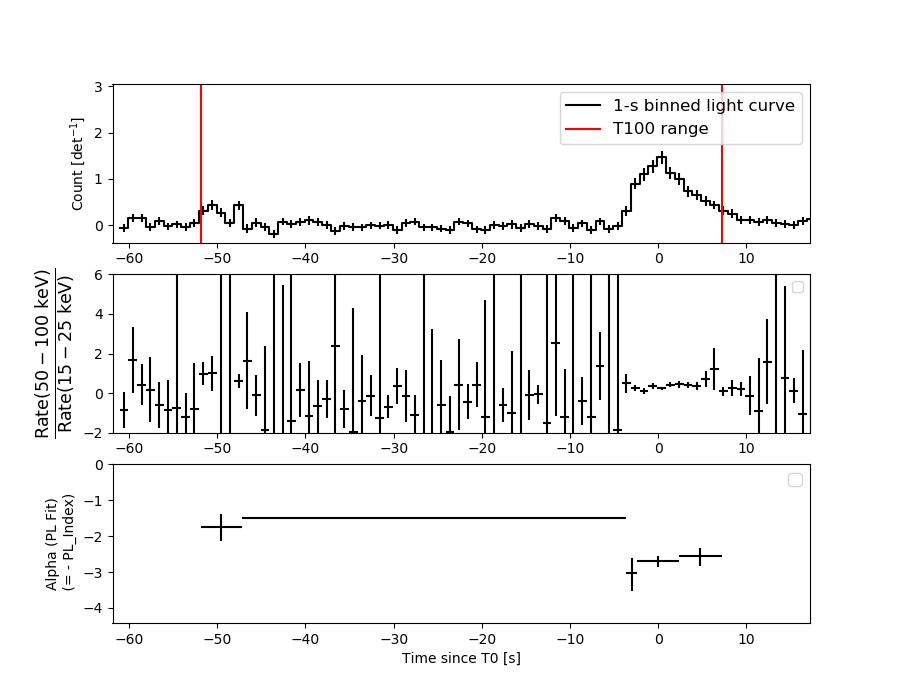
1 s binning
From T0-310 s to T0+310 s
From T100_start - 20 s to T100_end + 30 s

Full time interval

64 ms binning
Full time interval
From T100_start to T100_end

From T0-5 sec to T0+5 sec
16 ms binning
From T100_start-5 s to T100_start+5 s

Blue+Cyan dotted lines: Time interval of the scaled map
From 0.000000 to 1.024000
8 ms binning
From T100_start-3 s to T100_start+3 s

Blue+Cyan dotted lines: Time interval of the scaled map
From 0.000000 to 1.024000
2 ms binning
From T100_start-1 s to T100_start+1 s

Blue+Cyan dotted lines: Time interval of the scaled map
From 0.000000 to 1.024000
SN=5 or 10 sec. binning (whichever binning is satisfied first)
SN=5 or 10 sec. binning (T < 200 sec)
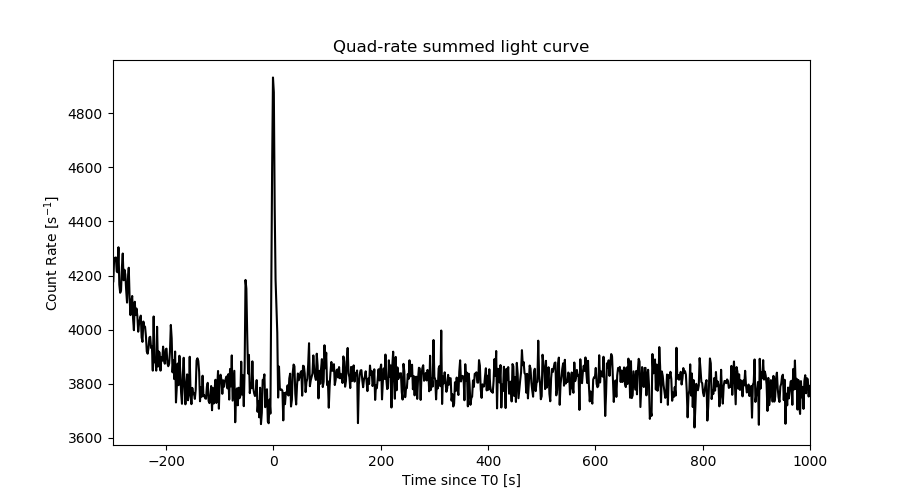
Quad-rate summed light curves (from T0-300s to T0+1000s)
Spectral Evolution
Spectra
Notes:
- 1) The fitting includes the systematic errors.
- 2) When the burst includes telescope slew time periods, the fitting uses an average response file made from multiple 5-s response files through out the slew time plus single time preiod for the non-slew times, and weighted by the total counts in the corresponding time period using addrmf. An average response file is needed becuase a spectral fit using the pre-slew DRM will introduce some errors in both a spectral shape and a normalization if the PHA file contains a lot of the slew/post-slew time interval.
- 3) For fits to more complicated models (e.g. a power-law over a cutoff power-law), the BAT team has decided to require a chi-square improvement of more than 6 for each extra dof.
Time averaged spectrum fit using the average DRM
Power-law model

Time interval is from  -51.896 sec. to    7.240 sec.

Spectral model in power-law:
------------------------------------------------------------
Parameters  : value       lower 90%   higher 90%
Photon index: 2.56418     ( -0.205265   0.221602 )
Norm@50keV  : 1.05722E-02    ( -0.00163808   0.00161571 )
------------------------------------------------------------
#Fit statistic : Chi-Squared =          52.98 using 59 PHA bins.
# Reduced chi-squared =         0.9295 for     57 degrees of freedom
# Null hypothesis probability =   6.265477e-01

Photon flux (15-150 keV)    in 59.14 sec: 2.16162 ( -0.21713  0.21736 ) ph/cm2/s
Energy fluence (15-150 keV)             : 6.36796e-06 ( -7.16233e-07  7.29149e-07 ) ergs/cm2
Cutoff power-law model

Time interval is from  -51.896 sec. to    7.240 sec.
Spectral model in the cutoff power-law:
------------------------------------------------------------
Parameters  : value       lower 90%   higher 90%
Photon index: 1.36963     ( -1.57487   0.642839 )
Epeak [keV] : 18.8978      (   )
Norm@50keV  : 5.94836E-02    (     )
------------------------------------------------------------
#Fit statistic : Chi-Squared =          49.25 using 59 PHA bins.
# Reduced chi-squared =         0.8794 for     56 degrees of freedom
# Null hypothesis probability =   7.264320e-01

Photon flux (15-150 keV)    in 59.14 sec:  (    ) ph/cm2/s
Energy fluence (15-150 keV)             : 0 ( 0  0 ) ergs/cm2
Band function

Time interval is from  -51.896 sec. to    7.240 sec.


Spectral model in the Band function:
------------------------------------------------------------
Parameters  : value       lower 90%   higher 90%
alpha       :    (     )
beta        :     (     )
Epeak [keV] :       (   )
Norm@50keV   :     (     )
------------------------------------------------------------

Photon flux (15-150 keV)    in  sec:  (    ) ph/cm2/s
Energy fluence (15-150 keV)             : 0 ( 0  0 ) ergs/cm2
Single BB

Spectral model blackbody:
------------------------------------------------------------
Parameters  : value    Lower 90%  Upper 90%
kT [keV]    : 7.25630  (-0.717116  0.802749)
R^2/D10^2   : 3.45194  (-1.25671   1.97236)
(R is the radius in km and D10 is the distance to the source in units of 10 kpc)
------------------------------------------------------------
#Fit statistic : Chi-Squared =          56.83 using 59 PHA bins.
# Reduced chi-squared =         0.9971 for     57 degrees of freedom
# Null hypothesis probability =   4.813487e-01

Energy  Fluence     90% Error
[keV]   [erg/cm2]   [erg/cm2]
15- 25  1.790e-06   3.007e-07
25- 50  2.625e-06   3.548e-07
50-150  4.946e-07   1.739e-07
15-150  4.910e-06   6.659e-07
Thermal bremsstrahlung (OTTB)

Spectral model: thermal bremsstrahlung
------------------------------------------------------------
Parameters  : value         Lower 90%    Upper 90%
kT [keV]    : 30.6061       (-6.24772      8.4265)
Norm        : 16.9165       (-3.45113     4.55221)
------------------------------------------------------------
#Fit statistic : Chi-Squared =          49.22 using 59 PHA bins.
# Reduced chi-squared =         0.8634 for     57 degrees of freedom
# Null hypothesis probability =   7.586482e-01

Energy  Fluence     90% Error
[keV]   [erg/cm2]   [erg/cm2]
15- 25  2.057e-06   2.916e-07
25- 50  2.376e-06   2.883e-07
50-150  1.336e-06   4.447e-07
15-150  5.769e-06   7.289e-07
Double BB

Spectral model: bbodyrad<1> + bbodyrad<2>
------------------------------------------------------------
Parameters  : value         Lower 90%    Upper 90%
kT1 [keV]   : 6.06675        (-1.51051      1.10112)
R1^2/D10^2  : 6.35827        (-2.95272      10.0259)
kT2 [keV]   : 19.4565        (-14.8994      38.4446)
R2^2/D10^2  : 2.34384E-02    (-0.0228419   0.407888)
------------------------------------------------------------
#Fit statistic : Chi-Squared =          47.93 using 59 PHA bins.
# Reduced chi-squared =         0.8715 for     55 degrees of freedom
# Null hypothesis probability =   7.391200e-01

Energy  Fluence     90% Error
[keV]   [erg/cm2]   [erg/cm2]
15- 25  1.970e-06   6.012e-07
25- 50  2.408e-06   7.759e-07
50-150  1.580e-06   9.712e-07
15-150  5.958e-06   1.997e-06
Peak spectrum fit
Power-law model

Time interval is from   -0.012 sec. to    0.988 sec.

Spectral model in power-law:
------------------------------------------------------------
Parameters  : value       lower 90%   higher 90%
Photon index: 3.23166     ( -0.301917   0.360041 )
Norm@50keV  : 5.50036E-02    ( -0.0149091   0.0147579 )
------------------------------------------------------------
#Fit statistic : Chi-Squared =          58.28 using 59 PHA bins.
# Reduced chi-squared =          1.022 for     57 degrees of freedom
# Null hypothesis probability =   4.281806e-01

Photon flux (15-150 keV)    in 1 sec: 17.9964 ( -2.7245  2.7275 ) ph/cm2/s
Energy fluence (15-150 keV)             : 7.42027e-07 ( -1.16926e-07  1.17659e-07 ) ergs/cm2
Cutoff power-law model

Time interval is from   -0.012 sec. to    0.988 sec.
Spectral model in the cutoff power-law:
------------------------------------------------------------
Parameters  : value       lower 90%   higher 90%
Photon index: 1.00000     (     )
Epeak [keV] : 80.0000      (   )
Norm@50keV  : 0.106818    (     )
------------------------------------------------------------
#Fit statistic : Chi-Squared =         131.66 using 59 PHA bins.
# Reduced chi-squared =         2.3510 for     56 degrees of freedom
# Null hypothesis probability =   4.936829e-08

Photon flux (15-150 keV)    in 1 sec:  (    ) ph/cm2/s
Energy fluence (15-150 keV)             : 0 ( 0  0 ) ergs/cm2
Band function

Time interval is from   -0.012 sec. to    0.988 sec.


Spectral model in the Band function:
------------------------------------------------------------
Parameters  : value       lower 90%   higher 90%
alpha       :    (     )
beta        :     (     )
Epeak [keV] :       (   )
Norm@50keV   :     (     )
------------------------------------------------------------

Photon flux (15-150 keV)    in  sec:  (    ) ph/cm2/s
Energy fluence (15-150 keV)             : 0 ( 0  0 ) ergs/cm2
Single BB

Spectral model blackbody:
------------------------------------------------------------
Parameters  : value    Lower 90%  Upper 90%
kT [keV]    : 6.10907  (-1.02002  1.11056)
R^2/D10^2   : 58.7752  (-31.43   78.9823)
(R is the radius in km and D10 is the distance to the source in units of 10 kpc)
------------------------------------------------------------
#Fit statistic : Chi-Squared =          62.20 using 59 PHA bins.
# Reduced chi-squared =          1.091 for     57 degrees of freedom
# Null hypothesis probability =   2.962433e-01

Energy  Fluence     90% Error
[keV]   [erg/cm2]   [erg/cm2]
15- 25  2.990e-07   8.625e-08
25- 50  3.100e-07   8.560e-08
50-150  3.054e-08   1.749e-08
15-150  6.395e-07   1.629e-07
Thermal bremsstrahlung (OTTB)

Spectral model: thermal bremsstrahlung
------------------------------------------------------------
Parameters  : value         Lower 90%    Upper 90%
kT [keV]    : 19.5022       (-4.79757      6.08733)
Norm        : 223.452       (-69.8494     116.011)
------------------------------------------------------------
#Fit statistic : Chi-Squared =          55.50 using 59 PHA bins.
# Reduced chi-squared =         0.9737 for     57 degrees of freedom
# Null hypothesis probability =   5.314081e-01

Energy  Fluence     90% Error
[keV]   [erg/cm2]   [erg/cm2]
15- 25  3.391e-07   7.130e-08
25- 50  2.912e-07   6.100e-08
50-150  8.357e-08   4.233e-08
15-150  7.139e-07   1.335e-07
Double BB

Spectral model: bbodyrad<1> + bbodyrad<2>
------------------------------------------------------------
Parameters  : value         Lower 90%    Upper 90%
kT1 [keV]   : 3.15792        (-1.6598      1.99121)
R1^2/D10^2  : 905.732        (-806.165      154401)
kT2 [keV]   : 8.73259        (-2.28048      5.30746)
R2^2/D10^2  : 8.22301    (-7.74501   32.4566)
------------------------------------------------------------
#Fit statistic : Chi-Squared =          54.91 using 59 PHA bins.
# Reduced chi-squared =         0.9984 for     55 degrees of freedom
# Null hypothesis probability =   4.780387e-01

Energy  Fluence     90% Error
[keV]   [erg/cm2]   [erg/cm2]
15- 25  3.513e-07   1.926e-07
25- 50  2.835e-07   1.527e-07
50-150  8.468e-08   5.640e-08
15-150  7.195e-07   3.564e-07
Pre-slew spectrum (Pre-slew PHA with pre-slew DRM)
Power-law model
Spectral model in power-law:
------------------------------------------------------------
Parameters  : value       lower 90%   higher 90%
Photon index: 2.56418     ( -0.205265   0.221602 )
Norm@50keV  : 1.05722E-02    ( -0.00163808   0.00161571 )
------------------------------------------------------------
#Fit statistic : Chi-Squared =          52.98 using 59 PHA bins.
# Reduced chi-squared =         0.9295 for     57 degrees of freedom
# Null hypothesis probability =   6.265477e-01

Photon flux (15-150 keV)    in 59.14 sec: 2.16129 ( -0.217083  0.217319 ) ph/cm2/s
Energy fluence (15-150 keV)             : 6.3663e-06 ( -7.15961e-07  7.29261e-07 ) ergs/cm2
Cutoff power-law model
Spectral model in the cutoff power-law:
------------------------------------------------------------
Parameters  : value       lower 90%   higher 90%
Photon index: 1.36835     ( -1.57406   0.628711 )
Epeak [keV] : 18.9147      ( -16.3372 9.89541 )
Norm@50keV  : 5.95967E-02    ( -0.0598652   0.583037 )
------------------------------------------------------------
#Fit statistic : Chi-Squared =          49.25 using 59 PHA bins.
# Reduced chi-squared =         0.8794 for     56 degrees of freedom
# Null hypothesis probability =   7.264317e-01

Photon flux (15-150 keV)    in 59.14 sec: 2.07730 ( -0.22876  0.22906 ) ph/cm2/s
Energy fluence (15-150 keV)             : 5.77152e-06 ( -7.83014e-07  8.70139e-07 ) ergs/cm2
Band function

Spectral model in the Band function:
------------------------------------------------------------
Parameters  : value       lower 90%   higher 90%
alpha       :    (     )
beta        :     (     )
Epeak [keV] :       (   )
Norm@50keV   :     (     )
------------------------------------------------------------

Photon flux (15-150 keV)    in  sec:  (    ) ph/cm2/s
Energy fluence (15-150 keV)             : 0 ( 0  0 ) ergs/cm2
S(25-50 keV) vs. S(50-100 keV) plot
S(25-50 keV)  = 2.12e-06
S(50-100 keV) = 1.44e-06
T90 vs. Hardness ratio plot

T90                                   = 56.8959999084473 sec.
Hardness ratio (energy fluence ratio) = 0.679245
Color vs. Color plot

Count Ratio  (25-50 keV) / (15-25 keV) = 1.00377
Count Ratio (50-100 keV) / (15-25 keV) = 0.336588
Mask shadow pattern
IMX = -1.307727448355517E+00, IMY = -2.410857632435768E-01
TIME vs. PHA plot around the trigger time

Blue+Cyan dotted lines: Time interval of the scaled map
From 0.000000 to 1.024000
TIME vs. DetID plot around the trigger time

Blue+Cyan dotted lines: Time interval of the scaled map
From 0.000000 to 1.024000
100 us light curve (15-350 keV)
Blue+Cyan dotted lines: Time interval of the scaled map
From 0.000000 to 1.024000
Spacecraft aspect plot

Bright source in the pre-burst/pre-slew/post-slew images
Pre-burst image of 15-350 keV band
Time interval of the image:
-153.795410 -51.896000

# RAcent  DECcent POSerr Theta    Phi  PeakCts   SNR AngSep     Name
#  [deg]    [deg]    ['] [deg]  [deg]                   [']
342.9171 -29.1791    2.4  39.3   81.9   4.0342   4.8 ------	UNKNOWN
338.3553 -30.9460    2.4  39.9   75.2   4.5459   4.8 ------	UNKNOWN
 27.1653 -14.1734    2.4  44.9  148.5   4.4040   4.8 ------	UNKNOWN
303.6921 -50.3429    2.5  42.9   25.7   1.8258   4.6 ------	UNKNOWN
 16.5381 -48.7423    2.4  10.4  124.0   1.1339   4.9 ------	UNKNOWN
 65.4878 -32.7404    2.4  39.5 -151.7   1.6657   4.8 ------	UNKNOWN
 89.7463 -72.3481    2.8  29.3  -75.6   1.2521   4.1 ------	UNKNOWN
 86.3455 -61.0966    2.7  31.5  -97.7   1.4761   4.3 ------	UNKNOWN
Pre-slew background subtracted image of 15-350 keV band
Time interval of the image:
-51.896000 7.240000

# RAcent  DECcent POSerr Theta    Phi  PeakCts   SNR AngSep     Name
#  [deg]    [deg]    ['] [deg]  [deg]                   [']
 44.5426  -8.9549    1.1  53.1  169.6  11.3343  11.0 ------	UNKNOWN
Post-slew image of 15-350 keV band
Time interval of the image:
86.004600 662.984000
720.904000 963.024000

# RAcent  DECcent POSerr Theta    Phi  PeakCts   SNR AngSep     Name
#  [deg]    [deg]    ['] [deg]  [deg]                   [']
 23.7252  28.2696    3.0  42.3  158.7  14.8415   3.8 ------	UNKNOWN
 53.9167  29.3317    3.5  39.4 -160.7   7.8039   3.3 ------	UNKNOWN
 66.2059 -12.7564    2.3  21.6  -71.7   8.9953   4.9 ------	UNKNOWN
 74.6902  -9.1561    2.6  29.8  -80.9   9.6354   4.4 ------	UNKNOWN
Plot creation:
Wed Oct  9 17:57:49 EDT 2019