Estimated redshift from machine learning (Ukwatta et al. 2016) - may take a few minute to calcaulte
Image
Pre-slew 15.0-350.0 keV image (Event data)

#   RAcent    DECcent   POSerr    Theta     Phi              Peak Cts       SNR   Name
  100.6155    59.5318   0.0207    28.6391   114.6996         1.3595012      9.359 TRIG_00926515

Foreground time interval of the image:
 -0.004  73.301 (delta_t =  73.305 [sec])
Background time interval of the image:
-239.000  -0.004 (delta_t = 238.996 [sec])
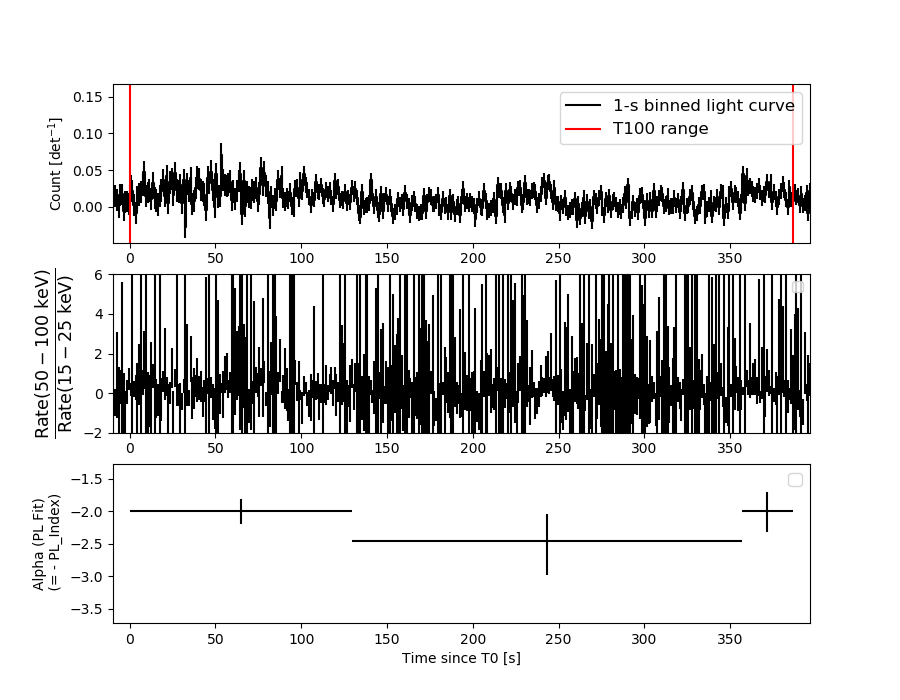
Lightcurves
Notes:
- 1) The mask-weighted light curves are using the flight position.
- 2) Multiple plots of different time binning/intervals are shown to cover all scenarios of short/long GRBs, rate/image triggers, and real/false positives.
- 3) For all the mask-weighted lightcurves, the y-axis units are counts/sec/det where a det is 0.4 x 0.4 = 0.16 sq cm.
- 4) The verticle lines correspond to following: green dotted lines are T50 interval, black dotted lines are T90 interval, blue solid line(s) is a spacecraft slew start time, and orange solid line(s) is a spacecraft slew end time.
- 5) Time of each bin is in the middle of the bin.
1 s binning
From T0-310 s to T0+310 s

From T100_start - 20 s to T100_end + 30 s

Full time interval

64 ms binning
Full time interval
From T100_start to T100_end

From T0-5 sec to T0+5 sec

16 ms binning
From T100_start-5 s to T100_start+5 s

Blue+Cyan dotted lines: Time interval of the scaled map
From 0.000000 to 64.000000
8 ms binning
From T100_start-3 s to T100_start+3 s

Blue+Cyan dotted lines: Time interval of the scaled map
From 0.000000 to 64.000000
2 ms binning
From T100_start-1 s to T100_start+1 s

Blue+Cyan dotted lines: Time interval of the scaled map
From 0.000000 to 64.000000
SN=5 or 10 sec. binning (whichever binning is satisfied first)
SN=5 or 10 sec. binning (T < 200 sec)

Quad-rate summed light curves (from T0-300s to T0+1000s)

Spectral Evolution
Spectra
Notes:
- 1) The fitting includes the systematic errors.
- 2) When the burst includes telescope slew time periods, the fitting uses an average response file made from multiple 5-s response files through out the slew time plus single time preiod for the non-slew times, and weighted by the total counts in the corresponding time period using addrmf. An average response file is needed becuase a spectral fit using the pre-slew DRM will introduce some errors in both a spectral shape and a normalization if the PHA file contains a lot of the slew/post-slew time interval.
- 3) For fits to more complicated models (e.g. a power-law over a cutoff power-law), the BAT team has decided to require a chi-square improvement of more than 6 for each extra dof.
Time averaged spectrum fit using the average DRM
Power-law model

Time interval is from   -0.004 sec. to  386.468 sec.

Spectral model in power-law:
------------------------------------------------------------
Parameters  : value       lower 90%   higher 90%
Photon index: 2.11366     ( -0.174981   0.184299 )
Norm@50keV  : 6.45798E-04    ( -7.53461e-05   7.33857e-05 )
------------------------------------------------------------
#Fit statistic : Chi-Squared =          48.58 using 59 PHA bins.
# Reduced chi-squared =         0.8523 for     57 degrees of freedom
# Null hypothesis probability =   7.786621e-01

Photon flux (15-150 keV)    in 386.5 sec: 0.102300 ( -0.0084917  0.008498 ) ph/cm2/s
Energy fluence (15-150 keV)             : 2.32268e-06 ( -2.36606e-07  2.42038e-07 ) ergs/cm2
Cutoff power-law model

Time interval is from   -0.004 sec. to  386.468 sec.
Spectral model in the cutoff power-law:
------------------------------------------------------------
Parameters  : value       lower 90%   higher 90%
Photon index: 2.35184     ( -1.99695   -1.99695 )
Epeak [keV] : 138.094      (   )
Norm@50keV  : 4.83717E-04    (     )
------------------------------------------------------------
#Fit statistic : Chi-Squared =          47.39 using 59 PHA bins.
# Reduced chi-squared =         0.8463 for     56 degrees of freedom
# Null hypothesis probability =   7.867058e-01

Photon flux (15-150 keV)    in 386.5 sec: 9.44822E-02 ( -0.0200185  0.0076368 ) ph/cm2/s
Energy fluence (15-150 keV)             : 1.94205e-06 ( -5.84079e-07  6.01614e-07 ) ergs/cm2
Band function

Time interval is from   -0.004 sec. to  386.468 sec.


Spectral model in the Band function:
------------------------------------------------------------
Parameters  : value       lower 90%   higher 90%
alpha       :    (     )
beta        :     (     )
Epeak [keV] :       (   )
Norm@50keV   :     (     )
------------------------------------------------------------

Photon flux (15-150 keV)    in  sec:  (    ) ph/cm2/s
Energy fluence (15-150 keV)             : 0 ( 0  0 ) ergs/cm2
Single BB

Spectral model blackbody:
------------------------------------------------------------
Parameters  : value    Lower 90%  Upper 90%
kT [keV]    : 8.04900  (-0.862045  1.0133)
R^2/D10^2   : 0.103099  (-0.0388371   0.0602745)
(R is the radius in km and D10 is the distance to the source in units of 10 kpc)
------------------------------------------------------------
#Fit statistic : Chi-Squared =          96.38 using 59 PHA bins.
# Reduced chi-squared =          1.691 for     57 degrees of freedom
# Null hypothesis probability =   8.679969e-04

Energy  Fluence     90% Error
[keV]   [erg/cm2]   [erg/cm2]
15- 25  4.689e-07   6.851e-08
25- 50  8.295e-07   9.295e-08
50-150  2.222e-07   6.232e-08
15-150  1.521e-06   1.643e-07
Thermal bremsstrahlung (OTTB)

Spectral model: thermal bremsstrahlung
------------------------------------------------------------
Parameters  : value         Lower 90%    Upper 90%
kT [keV]    : 57.4882       (-14.5109      22.2284)
Norm        : 0.533928       (-0.0820053     0.0978144)
------------------------------------------------------------
#Fit statistic : Chi-Squared =          56.86 using 59 PHA bins.
# Reduced chi-squared =         0.9976 for     57 degrees of freedom
# Null hypothesis probability =   4.801273e-01

Energy  Fluence     90% Error
[keV]   [erg/cm2]   [erg/cm2]
15- 25  5.149e-07   6.319e-08
25- 50  7.732e-07   7.131e-08
50-150  8.486e-07   1.958e-07
15-150  2.137e-06   2.630e-07
Double BB

Spectral model: bbodyrad<1> + bbodyrad<2>
------------------------------------------------------------
Parameters  : value         Lower 90%    Upper 90%
kT1 [keV]   : 5.62583        (-0.789174      0.846478)
R1^2/D10^2  : 0.367558        (-0.158899      0.275848)
kT2 [keV]   : 27.4585        (-6.88167      12.7982)
R2^2/D10^2  : 7.51318E-04    (-0.000519157   0.00128738)
------------------------------------------------------------
#Fit statistic : Chi-Squared =          43.56 using 59 PHA bins.
# Reduced chi-squared =         0.7919 for     55 degrees of freedom
# Null hypothesis probability =   8.671055e-01

Energy  Fluence     90% Error
[keV]   [erg/cm2]   [erg/cm2]
15- 25  5.775e-07   1.329e-07
25- 50  6.821e-07   1.492e-07
50-150  1.208e-06   6.582e-07
15-150  2.468e-06   8.060e-07
Peak spectrum fit
Power-law model

Time interval is from   52.948 sec. to   53.948 sec.

Spectral model in power-law:
------------------------------------------------------------
Parameters  : value       lower 90%   higher 90%
Photon index: 2.01617     ( -0.704185   0.804118 )
Norm@50keV  : 3.76126E-03    ( -0.0018459   0.00171615 )
------------------------------------------------------------
#Fit statistic : Chi-Squared =          59.94 using 59 PHA bins.
# Reduced chi-squared =          1.052 for     57 degrees of freedom
# Null hypothesis probability =   3.694547e-01

Photon flux (15-150 keV)    in 1 sec: 0.568468 ( -0.200805  0.20081 ) ph/cm2/s
Energy fluence (15-150 keV)             : 3.47232e-08 ( -1.47435e-08  1.60787e-08 ) ergs/cm2
Cutoff power-law model

Time interval is from   52.948 sec. to   53.948 sec.
Spectral model in the cutoff power-law:
------------------------------------------------------------
Parameters  : value       lower 90%   higher 90%
Photon index: 2.50649     ( -4.32553   1.17142 )
Epeak [keV] : 178.237      (   )
Norm@50keV  : 2.01477E-03    (     )
------------------------------------------------------------
#Fit statistic : Chi-Squared =          59.54 using 59 PHA bins.
# Reduced chi-squared =          1.063 for     56 degrees of freedom
# Null hypothesis probability =   3.481197e-01

Photon flux (15-150 keV)    in 1 sec:  (    ) ph/cm2/s
Energy fluence (15-150 keV)             : 0 ( 0  0 ) ergs/cm2
Band function

Time interval is from   52.948 sec. to   53.948 sec.


Spectral model in the Band function:
------------------------------------------------------------
Parameters  : value       lower 90%   higher 90%
alpha       :    (     )
beta        :     (     )
Epeak [keV] :       (   )
Norm@50keV   :     (     )
------------------------------------------------------------

Photon flux (15-150 keV)    in  sec:  (    ) ph/cm2/s
Energy fluence (15-150 keV)             : 0 ( 0  0 ) ergs/cm2
Single BB

Spectral model blackbody:
------------------------------------------------------------
Parameters  : value    Lower 90%  Upper 90%
kT [keV]    : 8.42571  (-2.84908  3.69769)
R^2/D10^2   : 0.523343  (-0.523257   2.13098)
(R is the radius in km and D10 is the distance to the source in units of 10 kpc)
------------------------------------------------------------
#Fit statistic : Chi-Squared =          61.04 using 59 PHA bins.
# Reduced chi-squared =          1.071 for     57 degrees of freedom
# Null hypothesis probability =   3.328158e-01

Energy  Fluence     90% Error
[keV]   [erg/cm2]   [erg/cm2]
15- 25  6.963e-09   4.260e-09
25- 50  1.331e-08   8.375e-09
50-150  4.133e-09   3.363e-09
15-150  2.440e-08   1.599e-08
Thermal bremsstrahlung (OTTB)

Spectral model: thermal bremsstrahlung
------------------------------------------------------------
Parameters  : value         Lower 90%    Upper 90%
kT [keV]    : 51.2429       (-32.2201      -51.2413)
Norm        : 3.17077       (-1.58504     3.73733)
------------------------------------------------------------
#Fit statistic : Chi-Squared =          60.38 using 59 PHA bins.
# Reduced chi-squared =          1.059 for     57 degrees of freedom
# Null hypothesis probability =   3.548285e-01

Energy  Fluence     90% Error
[keV]   [erg/cm2]   [erg/cm2]
15- 25  7.796e-09   4.784e-09
25- 50  1.129e-08   7.075e-09
50-150  1.122e-08   8.745e-09
15-150  3.031e-08   2.017e-08
Double BB

------------------------------------------------------------
Parameters  : value         Lower 90%    Upper 90%
kT1 [keV]   : 200.000        (-200      -200)
R1^2/D10^2  : 8.95088E-05        (-6.37674e-05      6.37676e-05)
kT2 [keV]   : 7.07058        (-2.65452      3.15184)
R2^2/D10^2  : 0.942950    (-0.665206   5.73225)
------------------------------------------------------------
#Fit statistic : Chi-Squared =          60.41 using 59 PHA bins.
#Fit statistic : Chi-Squared =          56.31 using 59 PHA bins.
# Reduced chi-squared =          1.098 for     55 degrees of freedom
# Reduced chi-squared =          1.024 for     55 degrees of freedom
# Null hypothesis probability =   2.868020e-01
# Null hypothesis probability =   4.258355e-01

Energy  Fluence     90% Error
[keV]   [erg/cm2]   [erg/cm2]
15- 25  7.972e-09   4.225e-09
25- 50  1.191e-08   7.430e-09
50-150  6.100e-09   4.168e-09
15-150  2.598e-08   1.457e-08
Pre-slew spectrum (Pre-slew PHA with pre-slew DRM)
Power-law model

Spectral model in power-law:
------------------------------------------------------------
Parameters  : value       lower 90%   higher 90%
Photon index: 1.87640     ( -0.223342   0.235236 )
Norm@50keV  : 1.45341E-03    ( -0.000212897   0.000206394 )
------------------------------------------------------------
#Fit statistic : Chi-Squared =          40.05 using 59 PHA bins.
# Reduced chi-squared =         0.7027 for     57 degrees of freedom
# Null hypothesis probability =   9.568318e-01

Photon flux (15-150 keV)    in 73.3 sec: 0.206521 ( -0.0242818  0.0242904 ) ph/cm2/s
Energy fluence (15-150 keV)             : 9.79369e-07 ( -1.39564e-07  1.42755e-07 ) ergs/cm2
Cutoff power-law model

Spectral model in the cutoff power-law:
------------------------------------------------------------
Parameters  : value       lower 90%   higher 90%
Photon index: 1.88078     (     )
Epeak [keV] : 787.422      (   )
Norm@50keV  : 1.44351E-03    (     )
------------------------------------------------------------
#Fit statistic : Chi-Squared =          40.10 using 59 PHA bins.
# Reduced chi-squared =         0.7160 for     56 degrees of freedom
# Null hypothesis probability =   9.462541e-01

Photon flux (15-150 keV)    in 73.3 sec: 0.206581 ( -0.024361  0.024191 ) ph/cm2/s
Energy fluence (15-150 keV)             : 9.74809e-07 ( -1.4218e-07  1.44196e-07 ) ergs/cm2
Band function

Spectral model in the Band function:
------------------------------------------------------------
Parameters  : value       lower 90%   higher 90%
alpha       :    (     )
beta        :     (     )
Epeak [keV] :       (   )
Norm@50keV   :     (     )
------------------------------------------------------------

Photon flux (15-150 keV)    in  sec:  (    ) ph/cm2/s
Energy fluence (15-150 keV)             : 0 ( 0  0 ) ergs/cm2
S(25-50 keV) vs. S(50-100 keV) plot

S(25-50 keV)  = 7.23e-07
S(50-100 keV) = 6.65e-07
T90 vs. Hardness ratio plot

T90                                   = 362.340000033379 sec.
Hardness ratio (energy fluence ratio) = 0.919779
Color vs. Color plot

Count Ratio  (25-50 keV) / (15-25 keV) = 0.932468
Count Ratio (50-100 keV) / (15-25 keV) = 0.511938
Mask shadow pattern

IMX = -2.281950291976579E-01, IMY = -4.961409639792215E-01
TIME vs. PHA plot around the trigger time

Blue+Cyan dotted lines: Time interval of the scaled map
From 0.000000 to 64.000000
TIME vs. DetID plot around the trigger time

Blue+Cyan dotted lines: Time interval of the scaled map
From 0.000000 to 64.000000
100 us light curve (15-350 keV)

Blue+Cyan dotted lines: Time interval of the scaled map
From 0.000000 to 64.000000
Spacecraft aspect plot

Bright source in the pre-burst/pre-slew/post-slew images
Pre-burst image of 15-350 keV band
Time interval of the image:
-239.000000 -0.004000

# RAcent  DECcent POSerr Theta    Phi  PeakCts   SNR AngSep     Name
#  [deg]    [deg]    ['] [deg]  [deg]                   [']
 94.0989   9.3854    4.2  48.5   33.7   2.2506   2.7 ------	UNKNOWN
239.4870  74.3761    2.4  54.3  171.1   4.6108   4.8 ------	UNKNOWN
147.0277  24.0910    2.9  19.3  -60.0   0.9918   4.0 ------	UNKNOWN
Pre-slew background subtracted image of 15-350 keV band
Time interval of the image:
-0.004000 73.300590

# RAcent  DECcent POSerr Theta    Phi  PeakCts   SNR AngSep     Name
#  [deg]    [deg]    ['] [deg]  [deg]                   [']
 85.1398  32.6334    2.0  40.9   67.4   2.2928   5.7 ------	UNKNOWN
100.6155  59.5317    1.2  28.6  114.7   1.3606   9.4 ------	UNKNOWN
158.1571  13.8421    2.4  33.3  -69.7   0.9182   4.9 ------	UNKNOWN
Post-slew image of 15-350 keV band
Time interval of the image:
123.500610 824.800600

# RAcent  DECcent POSerr Theta    Phi  PeakCts   SNR AngSep     Name
#  [deg]    [deg]    ['] [deg]  [deg]                   [']
 83.6185  22.0145    0.4  39.4   18.1  26.2804  31.7    0.8	Crab
322.3217  66.2601    2.8  50.5  152.5   9.5747   4.1 ------	UNKNOWN
 65.3641  72.4796    2.8  18.8  140.3   2.4663   4.2 ------	UNKNOWN
100.6509  59.4946    2.7   0.0  -55.9   2.3629   4.3 ------	UNKNOWN
251.4224  60.5152    3.0  57.9 -170.7  12.7151   3.8 ------	UNKNOWN
115.3714   1.6950    3.2  58.9  -24.5  12.2005   3.6 ------	UNKNOWN
Plot creation:
Wed Nov 27 16:32:15 EST 2019