Estimated redshift from machine learning (Ukwatta et al. 2016) - may take a few minute to calcaulte
Image
Pre-slew 15.0-350.0 keV image (Event data)
#   RAcent    DECcent   POSerr    Theta     Phi              Peak Cts       SNR   Name
   31.7140   -36.9310   0.0070    35.9837   117.7876         1.9039448     27.403 TRIG_00927825

Foreground time interval of the image:
 -0.092   2.576 (delta_t =   2.668 [sec])
Background time interval of the image:
-239.556  -0.092 (delta_t = 239.464 [sec])
Lightcurves
Notes:
- 1) The mask-weighted light curves are using the flight position.
- 2) Multiple plots of different time binning/intervals are shown to cover all scenarios of short/long GRBs, rate/image triggers, and real/false positives.
- 3) For all the mask-weighted lightcurves, the y-axis units are counts/sec/det where a det is 0.4 x 0.4 = 0.16 sq cm.
- 4) The verticle lines correspond to following: green dotted lines are T50 interval, black dotted lines are T90 interval, blue solid line(s) is a spacecraft slew start time, and orange solid line(s) is a spacecraft slew end time.
- 5) Time of each bin is in the middle of the bin.
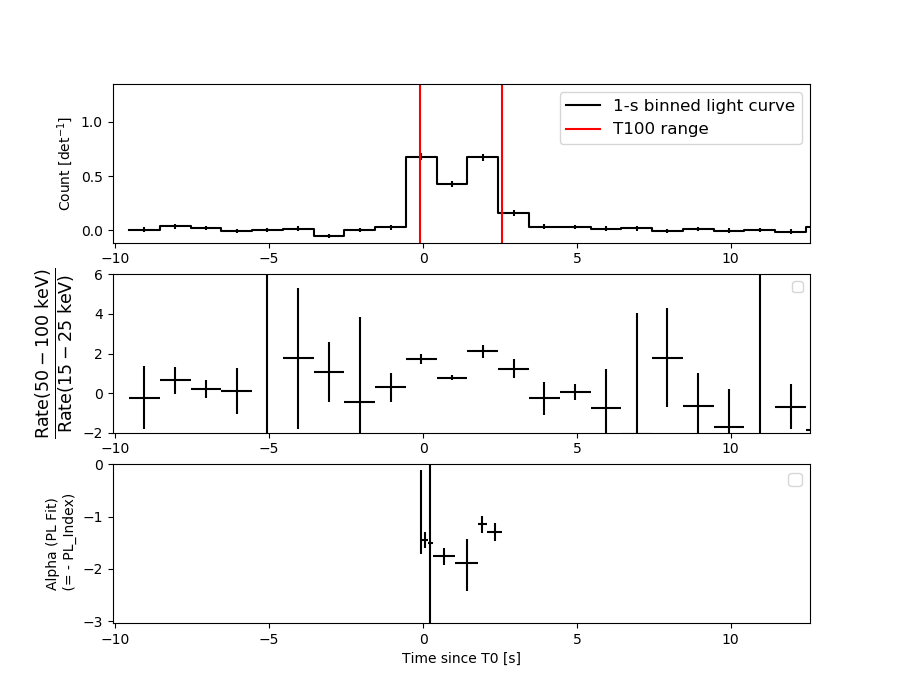
1 s binning
From T0-310 s to T0+310 s
From T100_start - 20 s to T100_end + 30 s
Full time interval

64 ms binning
Full time interval
From T100_start to T100_end
From T0-5 sec to T0+5 sec
16 ms binning
From T100_start-5 s to T100_start+5 s
Blue+Cyan dotted lines: Time interval of the scaled map
From 0.000000 to 0.064000
8 ms binning
From T100_start-3 s to T100_start+3 s
Blue+Cyan dotted lines: Time interval of the scaled map
From 0.000000 to 0.064000
2 ms binning
From T100_start-1 s to T100_start+1 s
Blue+Cyan dotted lines: Time interval of the scaled map
From 0.000000 to 0.064000
SN=5 or 10 sec. binning (whichever binning is satisfied first)
SN=5 or 10 sec. binning (T < 200 sec)
Quad-rate summed light curves (from T0-300s to T0+1000s)

Spectral Evolution
Spectra
Notes:
- 1) The fitting includes the systematic errors.
- 2) When the burst includes telescope slew time periods, the fitting uses an average response file made from multiple 5-s response files through out the slew time plus single time preiod for the non-slew times, and weighted by the total counts in the corresponding time period using addrmf. An average response file is needed becuase a spectral fit using the pre-slew DRM will introduce some errors in both a spectral shape and a normalization if the PHA file contains a lot of the slew/post-slew time interval.
- 3) For fits to more complicated models (e.g. a power-law over a cutoff power-law), the BAT team has decided to require a chi-square improvement of more than 6 for each extra dof.
Time averaged spectrum fit using the average DRM
Power-law model
Time interval is from   -0.092 sec. to    2.576 sec.

Spectral model in power-law:
------------------------------------------------------------
Parameters  : value       lower 90%   higher 90%
Photon index: 1.35044     ( -0.0838171   0.0838034 )
Norm@50keV  : 4.82799E-02    ( -0.00237783   0.0023776 )
------------------------------------------------------------
#Fit statistic : Chi-Squared =          56.43 using 59 PHA bins.
# Reduced chi-squared =         0.9900 for     57 degrees of freedom
# Null hypothesis probability =   4.963793e-01

Photon flux (15-150 keV)    in 2.668 sec: 5.81694 ( -0.30015  0.30056 ) ph/cm2/s
Energy fluence (15-150 keV)             : 1.2581e-06 ( -6.69249e-08  6.70821e-08 ) ergs/cm2
Cutoff power-law model
Time interval is from   -0.092 sec. to    2.576 sec.
Spectral model in the cutoff power-law:
------------------------------------------------------------
Parameters  : value       lower 90%   higher 90%
Photon index: 1.04767     ( -0.341034   0.322737 )
Epeak [keV] : 174.070      ( -64.1602 -174.07 )
Norm@50keV  : 6.68534E-02    ( -0.0188982   0.0284271 )
------------------------------------------------------------
#Fit statistic : Chi-Squared =          53.78 using 59 PHA bins.
# Reduced chi-squared =         0.9604 for     56 degrees of freedom
# Null hypothesis probability =   5.593723e-01

Photon flux (15-150 keV)    in 2.668 sec: 5.74688 ( -0.30874  0.30901 ) ph/cm2/s
Energy fluence (15-150 keV)             : 1.24307e-06 ( -6.95646e-08  6.93571e-08 ) ergs/cm2
Band function

Time interval is from   -0.092 sec. to    2.576 sec.


Spectral model in the Band function:
------------------------------------------------------------
Parameters  : value       lower 90%   higher 90%
alpha       :    (     )
beta        :     (     )
Epeak [keV] :       (   )
Norm@50keV   :     (     )
------------------------------------------------------------

Photon flux (15-150 keV)    in  sec:  (    ) ph/cm2/s
Energy fluence (15-150 keV)             : 0 ( 0  0 ) ergs/cm2
Single BB
Spectral model blackbody:
------------------------------------------------------------
Parameters  : value    Lower 90%  Upper 90%
kT [keV]    : 18.2341  (  )
R^2/D10^2   : 0.353334  (   )
(R is the radius in km and D10 is the distance to the source in units of 10 kpc)
------------------------------------------------------------
#Fit statistic : Chi-Squared =         142.20 using 59 PHA bins.
# Reduced chi-squared =         2.4947 for     57 degrees of freedom
# Null hypothesis probability =   3.133163e-09

Energy  Fluence     90% Error
[keV]   [erg/cm2]   [erg/cm2]
15- 25  6.249e-08   6.630e-09
25- 50  2.918e-07   1.828e-08
50-150  7.065e-07   5.323e-08
15-150  1.061e-06   6.216e-08
Thermal bremsstrahlung (OTTB)
Spectral model: thermal bremsstrahlung
------------------------------------------------------------
Parameters  : value         Lower 90%    Upper 90%
kT [keV]    : 200.000       (-10.9938      -200)
Norm        : 24.3140       (-1.20575     1.20575)
------------------------------------------------------------
#Fit statistic : Chi-Squared =          72.73 using 59 PHA bins.
# Reduced chi-squared =          1.276 for     57 degrees of freedom
# Null hypothesis probability =   7.817329e-02

Energy  Fluence     90% Error
[keV]   [erg/cm2]   [erg/cm2]
15- 25  1.615e-07   9.298e-09
25- 50  3.107e-07   1.641e-08
50-150  6.814e-07   4.389e-08
15-150  1.154e-06   7.057e-08
Double BB
Spectral model: bbodyrad<1> + bbodyrad<2>
------------------------------------------------------------
Parameters  : value         Lower 90%    Upper 90%
kT1 [keV]   : 6.91650        (-1.15538      1.39629)
R1^2/D10^2  : 5.40871        (-2.46487      4.98896)
kT2 [keV]   : 27.4539        (-3.28029      4.83001)
R2^2/D10^2  : 7.39073E-02    (-0.0323796   0.0433112)
------------------------------------------------------------
#Fit statistic : Chi-Squared =          52.73 using 59 PHA bins.
# Reduced chi-squared =         0.9588 for     55 degrees of freedom
# Null hypothesis probability =   5.616844e-01

Energy  Fluence     90% Error
[keV]   [erg/cm2]   [erg/cm2]
15- 25  1.340e-07   2.971e-08
25- 50  2.920e-07   3.930e-08
50-150  8.209e-07   1.178e-07
15-150  1.247e-06   1.583e-07
Peak spectrum fit
Power-law model
Time interval is from   -0.092 sec. to    0.908 sec.

Spectral model in power-law:
------------------------------------------------------------
Parameters  : value       lower 90%   higher 90%
Photon index: 1.48139     ( -0.103489   0.104241 )
Norm@50keV  : 6.28050E-02    ( -0.00414283   0.00413688 )
------------------------------------------------------------
#Fit statistic : Chi-Squared =          76.07 using 59 PHA bins.
# Reduced chi-squared =          1.335 for     57 degrees of freedom
# Null hypothesis probability =   4.651691e-02

Photon flux (15-150 keV)    in 1 sec: 7.80215 ( -0.52434  0.52482 ) ph/cm2/s
Energy fluence (15-150 keV)             : 5.97737e-07 ( -4.22678e-08  4.24104e-08 ) ergs/cm2
Cutoff power-law model

Time interval is from   -0.092 sec. to    0.908 sec.
Spectral model in the cutoff power-law:
------------------------------------------------------------
Parameters  : value       lower 90%   higher 90%
Photon index: 0.806976     ( -0.469556   0.428726 )
Epeak [keV] : 93.6656      ( -19.2499 68.5451 )
Norm@50keV  : 0.134295    ( -0.050397   0.089033 )
------------------------------------------------------------
#Fit statistic : Chi-Squared =          68.53 using 59 PHA bins.
# Reduced chi-squared =          1.224 for     56 degrees of freedom
# Null hypothesis probability =   1.214079e-01

Photon flux (15-150 keV)    in 1 sec: 7.66691 ( -0.53231  0.53245 ) ph/cm2/s
Energy fluence (15-150 keV)             : 3.42492e-07 ( -4.90042e-08  4.23035e-08 ) ergs/cm2
Band function

Time interval is from   -0.092 sec. to    0.908 sec.


Spectral model in the Band function:
------------------------------------------------------------
Parameters  : value       lower 90%   higher 90%
alpha       :    (     )
beta        :     (     )
Epeak [keV] :       (   )
Norm@50keV   :     (     )
------------------------------------------------------------

Photon flux (15-150 keV)    in  sec:  (    ) ph/cm2/s
Energy fluence (15-150 keV)             : 0 ( 0  0 ) ergs/cm2
Single BB
Spectral model blackbody:
------------------------------------------------------------
Parameters  : value    Lower 90%  Upper 90%
kT [keV]    : 16.5248  (-1.22928  1.31672)
R^2/D10^2   : 0.668141  (-0.158906   0.207793)
(R is the radius in km and D10 is the distance to the source in units of 10 kpc)
------------------------------------------------------------
#Fit statistic : Chi-Squared =         111.77 using 59 PHA bins.
# Reduced chi-squared =         1.9609 for     57 degrees of freedom
# Null hypothesis probability =   2.005987e-05

Energy  Fluence     90% Error
[keV]   [erg/cm2]   [erg/cm2]
15- 25  3.744e-08   4.570e-09
25- 50  1.619e-07   1.415e-08
50-150  3.126e-07   3.705e-08
15-150  5.119e-07   4.025e-08
Thermal bremsstrahlung (OTTB)
Spectral model: thermal bremsstrahlung
------------------------------------------------------------
Parameters  : value         Lower 90%    Upper 90%
kT [keV]    : 200.000       (-32.503      -200)
Norm        : 32.2766       (-2.10345     2.10345)
------------------------------------------------------------
#Fit statistic : Chi-Squared =          72.75 using 59 PHA bins.
# Reduced chi-squared =          1.276 for     57 degrees of freedom
# Null hypothesis probability =   7.800574e-02

Energy  Fluence     90% Error
[keV]   [erg/cm2]   [erg/cm2]
15- 25  8.066e-08   5.975e-09
25- 50  1.552e-07   1.195e-08
50-150  3.403e-07   6.930e-08
15-150  5.761e-07   7.755e-08
Double BB

Spectral model: bbodyrad<1> + bbodyrad<2>
------------------------------------------------------------
Parameters  : value         Lower 90%    Upper 90%
kT1 [keV]   : 6.23599        (-1.29884      1.62354)
R1^2/D10^2  : 10.1825        (-5.51584      14.0578)
kT2 [keV]   : 22.7071        (-2.75292      4.04384)
R2^2/D10^2  : 0.180619    (-0.0858226   0.118741)
------------------------------------------------------------
#Fit statistic : Chi-Squared =          65.63 using 59 PHA bins.
# Reduced chi-squared =          1.193 for     55 degrees of freedom
# Null hypothesis probability =   1.544801e-01

Energy  Fluence     90% Error
[keV]   [erg/cm2]   [erg/cm2]
15- 25  7.248e-08   2.552e-08
25- 50  1.516e-07   3.349e-08
50-150  3.588e-07   8.005e-08
15-150  5.829e-07   1.253e-07
Pre-slew spectrum (Pre-slew PHA with pre-slew DRM)
Power-law model

Spectral model in power-law:
------------------------------------------------------------
Parameters  : value       lower 90%   higher 90%
Photon index: 1.35044     ( -0.0838171   0.0838034 )
Norm@50keV  : 4.82799E-02    ( -0.00237783   0.0023776 )
------------------------------------------------------------
#Fit statistic : Chi-Squared =          56.43 using 59 PHA bins.
# Reduced chi-squared =         0.9900 for     57 degrees of freedom
# Null hypothesis probability =   4.963793e-01

Photon flux (15-150 keV)    in 2.668 sec: 5.81686 ( -0.300137  0.300545 ) ph/cm2/s
Energy fluence (15-150 keV)             : 1.25794e-06 ( -6.69489e-08  6.70815e-08 ) ergs/cm2
Cutoff power-law model

Spectral model in the cutoff power-law:
------------------------------------------------------------
Parameters  : value       lower 90%   higher 90%
Photon index: 1.04767     ( -0.341034   0.322737 )
Epeak [keV] : 174.070      ( -64.1602 -174.07 )
Norm@50keV  : 6.68534E-02    ( -0.0188982   0.0284271 )
------------------------------------------------------------
#Fit statistic : Chi-Squared =          53.78 using 59 PHA bins.
# Reduced chi-squared =         0.9604 for     56 degrees of freedom
# Null hypothesis probability =   5.593723e-01

Photon flux (15-150 keV)    in 2.668 sec: 5.74635 ( -0.30866  0.30892 ) ph/cm2/s
Energy fluence (15-150 keV)             : 1.24358e-06 ( -6.96401e-08  6.93893e-08 ) ergs/cm2
Band function
Spectral model in the Band function:
------------------------------------------------------------
Parameters  : value       lower 90%   higher 90%
alpha       :    (     )
beta        :     (     )
Epeak [keV] :       (   )
Norm@50keV   :     (     )
------------------------------------------------------------

Photon flux (15-150 keV)    in  sec:  (    ) ph/cm2/s
Energy fluence (15-150 keV)             : 0 ( 0  0 ) ergs/cm2
S(25-50 keV) vs. S(50-100 keV) plot

S(25-50 keV)  = 2.88e-07
S(50-100 keV) = 4.51e-07
T90 vs. Hardness ratio plot
T90                                   = 2.44399988651276 sec.
Hardness ratio (energy fluence ratio) = 1.56597
Color vs. Color plot

Count Ratio  (25-50 keV) / (15-25 keV) = 1.53708
Count Ratio (50-100 keV) / (15-25 keV) = 1.48019
Mask shadow pattern

IMX = -3.385085496979163E-01, IMY = -6.423743622980559E-01
TIME vs. PHA plot around the trigger time

Blue+Cyan dotted lines: Time interval of the scaled map
From 0.000000 to 0.064000
TIME vs. DetID plot around the trigger time

Blue+Cyan dotted lines: Time interval of the scaled map
From 0.000000 to 0.064000
100 us light curve (15-350 keV)
Blue+Cyan dotted lines: Time interval of the scaled map
From 0.000000 to 0.064000
Spacecraft aspect plot

Bright source in the pre-burst/pre-slew/post-slew images
Pre-burst image of 15-350 keV band
Time interval of the image:
-239.556000 -0.092000

# RAcent  DECcent POSerr Theta    Phi  PeakCts   SNR AngSep     Name
#  [deg]    [deg]    ['] [deg]  [deg]                   [']
264.8752 -44.4782    5.7  54.1  -28.6  -1.9628  -2.0    5.9	4U 1735-44
 17.3306 -45.6105    2.9  26.4   98.3   1.2916   4.1 ------	UNKNOWN
 69.1284 -50.4019    2.7  31.7  172.3   1.1838   4.3 ------	UNKNOWN
Pre-slew background subtracted image of 15-350 keV band
Time interval of the image:
-0.092000 2.576000

# RAcent  DECcent POSerr Theta    Phi  PeakCts   SNR AngSep     Name
#  [deg]    [deg]    ['] [deg]  [deg]                   [']
264.8434 -44.3077    7.2  54.2  -28.5   0.1448   1.6    9.6	4U 1735-44
 35.7561 -32.2457    2.0  41.1  121.9   0.6299   5.9 ------	UNKNOWN
 16.2014 -36.8165    2.5  35.2   96.4   0.3311   4.6 ------	UNKNOWN
 31.7140 -36.9310    0.4  36.0  117.8   1.9040  27.4 ------	UNKNOWN
 79.2593 -73.6460    2.6  17.9 -138.9   0.1146   4.5 ------	UNKNOWN
132.1851 -51.8128    2.9  48.5 -131.7   0.3750   4.1 ------	UNKNOWN
Post-slew image of 15-350 keV band
Time interval of the image:
65.344590 709.880400
720.444000 899.578300
900.444000 962.535600

# RAcent  DECcent POSerr Theta    Phi  PeakCts   SNR AngSep     Name
#  [deg]    [deg]    ['] [deg]  [deg]                   [']
 65.8926  -7.2718    3.3  43.0  175.5   4.1685   3.5 ------	UNKNOWN
323.3813 -48.6514    2.8  49.7   -5.8   4.8478   4.1 ------	UNKNOWN
300.5980 -60.6031    3.6  58.9  -24.4  12.9336   3.3 ------	UNKNOWN
 54.6279 -72.1677    3.4  37.1  -70.8   4.8017   3.4 ------	UNKNOWN
Plot creation:
Wed Nov 27 16:30:20 EST 2019