Estimated redshift from machine learning (Ukwatta et al. 2016) - may take a few minute to calcaulte
Image
Pre-slew 15.0-350.0 keV image (Event data)
#   RAcent    DECcent   POSerr    Theta     Phi              Peak Cts       SNR   Name
   49.2010   -39.6357   0.0034    13.9659  -132.9613         3.2234756     56.336 TRIG_00927839

Foreground time interval of the image:
 -1.452  10.325 (delta_t =  11.777 [sec])
Background time interval of the image:
-239.376  -1.452 (delta_t = 237.924 [sec])
Lightcurves
Notes:
- 1) The mask-weighted light curves are using the flight position.
- 2) Multiple plots of different time binning/intervals are shown to cover all scenarios of short/long GRBs, rate/image triggers, and real/false positives.
- 3) For all the mask-weighted lightcurves, the y-axis units are counts/sec/det where a det is 0.4 x 0.4 = 0.16 sq cm.
- 4) The verticle lines correspond to following: green dotted lines are T50 interval, black dotted lines are T90 interval, blue solid line(s) is a spacecraft slew start time, and orange solid line(s) is a spacecraft slew end time.
- 5) Time of each bin is in the middle of the bin.
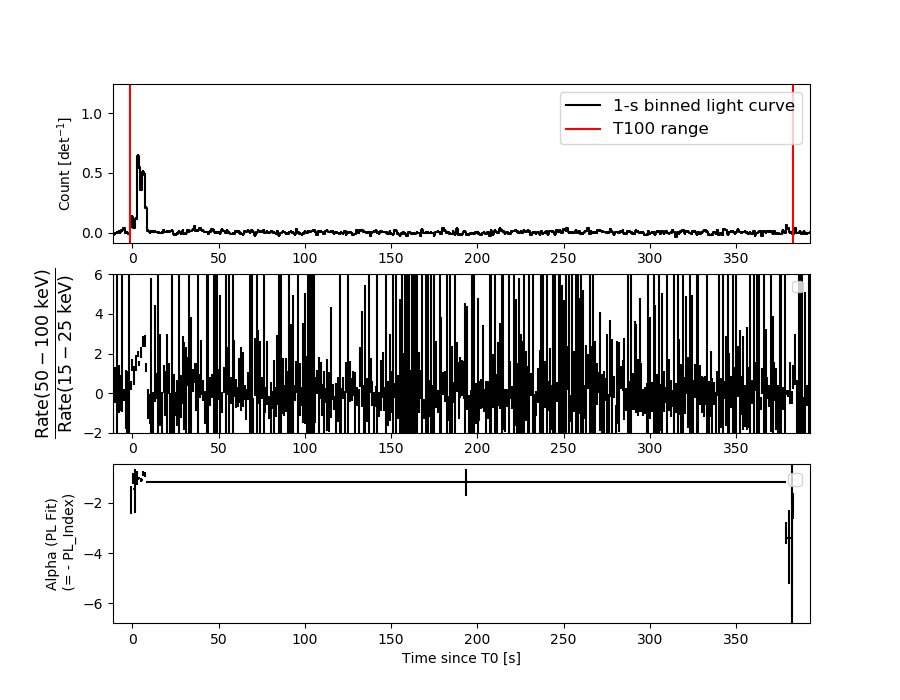
1 s binning
From T0-310 s to T0+310 s
From T100_start - 20 s to T100_end + 30 s

Full time interval

64 ms binning
Full time interval

From T100_start to T100_end

From T0-5 sec to T0+5 sec

16 ms binning
From T100_start-5 s to T100_start+5 s

Blue+Cyan dotted lines: Time interval of the scaled map
From 0.000000 to 0.512000
8 ms binning
From T100_start-3 s to T100_start+3 s

Blue+Cyan dotted lines: Time interval of the scaled map
From 0.000000 to 0.512000
2 ms binning
From T100_start-1 s to T100_start+1 s
Blue+Cyan dotted lines: Time interval of the scaled map
From 0.000000 to 0.512000
SN=5 or 10 sec. binning (whichever binning is satisfied first)
SN=5 or 10 sec. binning (T < 200 sec)

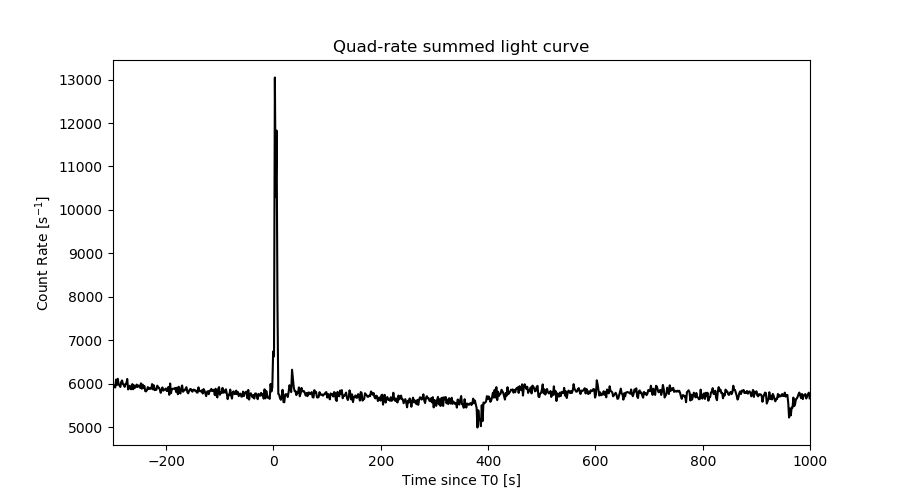
Quad-rate summed light curves (from T0-300s to T0+1000s)
Spectral Evolution
Spectra
Notes:
- 1) The fitting includes the systematic errors.
- 2) When the burst includes telescope slew time periods, the fitting uses an average response file made from multiple 5-s response files through out the slew time plus single time preiod for the non-slew times, and weighted by the total counts in the corresponding time period using addrmf. An average response file is needed becuase a spectral fit using the pre-slew DRM will introduce some errors in both a spectral shape and a normalization if the PHA file contains a lot of the slew/post-slew time interval.
- 3) For fits to more complicated models (e.g. a power-law over a cutoff power-law), the BAT team has decided to require a chi-square improvement of more than 6 for each extra dof.
Time averaged spectrum fit using the average DRM
Power-law model

Time interval is from   -1.452 sec. to  382.784 sec.

Spectral model in power-law:
------------------------------------------------------------
Parameters  : value       lower 90%   higher 90%
Photon index: 1.09612     ( -0.149121   0.146682 )
Norm@50keV  : 7.48565E-04    ( -5.92348e-05   5.92026e-05 )
------------------------------------------------------------
#Fit statistic : Chi-Squared =          54.85 using 59 PHA bins.
# Reduced chi-squared =         0.9623 for     57 degrees of freedom
# Null hypothesis probability =   5.560554e-01

Photon flux (15-150 keV)    in 384.2 sec: 8.67960E-02 ( -0.0070327  0.0070489 ) ph/cm2/s
Energy fluence (15-150 keV)             : 3.01098e-06 ( -2.69039e-07  2.7162e-07 ) ergs/cm2
Cutoff power-law model

Time interval is from   -1.452 sec. to  382.784 sec.
Spectral model in the cutoff power-law:
------------------------------------------------------------
Parameters  : value       lower 90%   higher 90%
Photon index: 1.00705     ( -0.603912   0.220753 )
Epeak [keV] : 593.628      ( -631.241 -631.241 )
Norm@50keV  : 8.22387E-04    ( -0.00012219   0.000696673 )
------------------------------------------------------------
#Fit statistic : Chi-Squared =          54.79 using 59 PHA bins.
# Reduced chi-squared =         0.9784 for     56 degrees of freedom
# Null hypothesis probability =   5.207612e-01

Photon flux (15-150 keV)    in 384.2 sec: 8.63938E-02 ( -0.007326  0.0070625 ) ph/cm2/s
Energy fluence (15-150 keV)             : 2.99218e-06 ( -2.96689e-07  2.70075e-07 ) ergs/cm2
Band function

Time interval is from   -1.452 sec. to  382.784 sec.


Spectral model in the Band function:
------------------------------------------------------------
Parameters  : value       lower 90%   higher 90%
alpha       :    (     )
beta        :     (     )
Epeak [keV] :       (   )
Norm@50keV   :     (     )
------------------------------------------------------------

Photon flux (15-150 keV)    in  sec:  (    ) ph/cm2/s
Energy fluence (15-150 keV)             : 0 ( 0  0 ) ergs/cm2
Single BB

Spectral model blackbody:
------------------------------------------------------------
Parameters  : value    Lower 90%  Upper 90%
kT [keV]    : 20.5196  (-2.20847  2.59905)
R^2/D10^2   : 3.69724E-03  (-0.0011586   0.00162909)
(R is the radius in km and D10 is the distance to the source in units of 10 kpc)
------------------------------------------------------------
#Fit statistic : Chi-Squared =          81.98 using 59 PHA bins.
# Reduced chi-squared =          1.438 for     57 degrees of freedom
# Null hypothesis probability =   1.678088e-02

Energy  Fluence     90% Error
[keV]   [erg/cm2]   [erg/cm2]
15- 25  1.141e-07   2.034e-08
25- 50  5.780e-07   7.511e-08
50-150  1.810e-06   2.372e-07
15-150  2.502e-06   2.843e-07
Thermal bremsstrahlung (OTTB)
Spectral model: thermal bremsstrahlung
------------------------------------------------------------
Parameters  : value         Lower 90%    Upper 90%
kT [keV]    : 200.000       (-16.8258      -200)
Norm        : 0.354793       (-0.0289061     0.0289061)
------------------------------------------------------------
#Fit statistic : Chi-Squared =          80.84 using 59 PHA bins.
# Reduced chi-squared =          1.418 for     57 degrees of freedom
# Null hypothesis probability =   2.062191e-02

Energy  Fluence     90% Error
[keV]   [erg/cm2]   [erg/cm2]
15- 25  3.393e-07   3.571e-08
25- 50  6.528e-07   1.600e-07
50-150  1.432e-06   6.576e-07
15-150  2.424e-06   7.261e-07
Double BB
Spectral model: bbodyrad<1> + bbodyrad<2>
------------------------------------------------------------
Parameters  : value         Lower 90%    Upper 90%
kT1 [keV]   : 5.92524        (-2.24127      3.72824)
R1^2/D10^2  : 0.110849        (-0.0859363      0.362265)
kT2 [keV]   : 27.8631        (-5.16871      13.1172)
R2^2/D10^2  : 1.27682E-03    (-0.000902936   0.00104234)
------------------------------------------------------------
#Fit statistic : Chi-Squared =          56.08 using 59 PHA bins.
# Reduced chi-squared =          1.020 for     55 degrees of freedom
# Null hypothesis probability =   4.340875e-01

Energy  Fluence     90% Error
[keV]   [erg/cm2]   [erg/cm2]
15- 25  2.574e-07   1.173e-07
25- 50  5.614e-07   1.560e-07
50-150  2.109e-06   5.740e-07
15-150  2.928e-06   6.670e-07
Peak spectrum fit
Power-law model

Time interval is from    2.748 sec. to    3.748 sec.

Spectral model in power-law:
------------------------------------------------------------
Parameters  : value       lower 90%   higher 90%
Photon index: 1.12788     ( -0.0792933   0.0791126 )
Norm@50keV  : 4.30155E-02    ( -0.00197577   0.00197574 )
------------------------------------------------------------
#Fit statistic : Chi-Squared =          65.75 using 59 PHA bins.
# Reduced chi-squared =          1.154 for     57 degrees of freedom
# Null hypothesis probability =   1.996210e-01

Photon flux (15-150 keV)    in 1 sec: 5.00385 ( -0.23305  0.23315 ) ph/cm2/s
Energy fluence (15-150 keV)             : 4.45872e-07 ( -2.33202e-08  2.34058e-08 ) ergs/cm2
Cutoff power-law model
Time interval is from    2.748 sec. to    3.748 sec.
Spectral model in the cutoff power-law:
------------------------------------------------------------
Parameters  : value       lower 90%   higher 90%
Photon index: 0.759442     ( -0.324895   0.302999 )
Epeak [keV] : 184.453      ( -61.7895 501.805 )
Norm@50keV  : 6.40535E-02    ( -0.0174725   0.0259287 )
------------------------------------------------------------
#Fit statistic : Chi-Squared =          61.36 using 59 PHA bins.
# Reduced chi-squared =          1.096 for     56 degrees of freedom
# Null hypothesis probability =   2.897370e-01

Photon flux (15-150 keV)    in 1 sec: 4.93567 ( -0.23962  0.23955 ) ph/cm2/s
Energy fluence (15-150 keV)             : 4.36767e-07 ( -2.48972e-08  2.48056e-08 ) ergs/cm2
Band function

Time interval is from    2.748 sec. to    3.748 sec.


Spectral model in the Band function:
------------------------------------------------------------
Parameters  : value       lower 90%   higher 90%
alpha       :    (     )
beta        :     (     )
Epeak [keV] :       (   )
Norm@50keV   :     (     )
------------------------------------------------------------

Photon flux (15-150 keV)    in  sec:  (    ) ph/cm2/s
Energy fluence (15-150 keV)             : 0 ( 0  0 ) ergs/cm2
Single BB

Spectral model blackbody:
------------------------------------------------------------
Parameters  : value    Lower 90%  Upper 90%
kT [keV]    : 19.5253  (  )
R^2/D10^2   : 0.256172  (   )
(R is the radius in km and D10 is the distance to the source in units of 10 kpc)
------------------------------------------------------------
#Fit statistic : Chi-Squared =         141.17 using 59 PHA bins.
# Reduced chi-squared =         2.4766 for     57 degrees of freedom
# Null hypothesis probability =   4.318709e-09

Energy  Fluence     90% Error
[keV]   [erg/cm2]   [erg/cm2]
15- 25  1.900e-08   1.710e-09
25- 50  9.314e-08   5.855e-09
50-150  2.623e-07   2.155e-08
15-150  3.744e-07   2.145e-08
Thermal bremsstrahlung (OTTB)

Spectral model: thermal bremsstrahlung
------------------------------------------------------------
Parameters  : value         Lower 90%    Upper 90%
kT [keV]    : 199.362       (      )
Norm        : 20.2218       (     )
------------------------------------------------------------
#Fit statistic : Chi-Squared =         136.40 using 59 PHA bins.
# Reduced chi-squared =         2.3929 for     57 degrees of freedom
# Null hypothesis probability =   1.859647e-08

Energy  Fluence     90% Error
[keV]   [erg/cm2]   [erg/cm2]
15- 25  5.035e-08   2.600e-09
25- 50  9.686e-08   5.100e-09
50-150  2.124e-07   1.125e-08
15-150  3.597e-07   1.870e-08
Double BB
Spectral model: bbodyrad<1> + bbodyrad<2>
------------------------------------------------------------
Parameters  : value         Lower 90%    Upper 90%
kT1 [keV]   : 8.41287        (-1.34458      1.53546)
R1^2/D10^2  : 2.15032        (-0.822426      1.50437)
kT2 [keV]   : 32.6624        (-4.75288      7.6746)
R2^2/D10^2  : 4.03092E-02    (-0.0197972   0.028191)
------------------------------------------------------------
#Fit statistic : Chi-Squared =          56.76 using 59 PHA bins.
# Reduced chi-squared =          1.032 for     55 degrees of freedom
# Null hypothesis probability =   4.091817e-01

Energy  Fluence     90% Error
[keV]   [erg/cm2]   [erg/cm2]
15- 25  3.487e-08   6.680e-09
25- 50  9.498e-08   1.652e-08
50-150  3.117e-07   6.700e-08
15-150  4.416e-07   7.880e-08
Pre-slew spectrum (Pre-slew PHA with pre-slew DRM)
Power-law model
Spectral model in power-law:
------------------------------------------------------------
Parameters  : value       lower 90%   higher 90%
Photon index: 1.08352     ( -0.0517678   0.0515494 )
Norm@50keV  : 1.76442E-02    ( -0.000492913   0.000492607 )
------------------------------------------------------------
#Fit statistic : Chi-Squared =          52.39 using 59 PHA bins.
# Reduced chi-squared =         0.9192 for     57 degrees of freedom
# Null hypothesis probability =   6.482735e-01

Photon flux (15-150 keV)    in 11.78 sec: 2.04346 ( -0.0591469  0.0592314 ) ph/cm2/s
Energy fluence (15-150 keV)             : 2.18466e-06 ( -6.6369e-08  6.65357e-08 ) ergs/cm2
Cutoff power-law model

Spectral model in the cutoff power-law:
------------------------------------------------------------
Parameters  : value       lower 90%   higher 90%
Photon index: 0.781939     ( -0.21731   0.207002 )
Epeak [keV] : 234.256      ( -73.6322 350.388 )
Norm@50keV  : 2.38814E-02    ( -0.00437611   0.00562843 )
------------------------------------------------------------
#Fit statistic : Chi-Squared =          46.09 using 59 PHA bins.
# Reduced chi-squared =         0.8231 for     56 degrees of freedom
# Null hypothesis probability =   8.247997e-01

Photon flux (15-150 keV)    in 11.78 sec: 2.00820 ( -0.06344  0.06353 ) ph/cm2/s
Energy fluence (15-150 keV)             : 2.14906e-06 ( -7.17991e-08  7.15282e-08 ) ergs/cm2
Band function
Spectral model in the Band function:
------------------------------------------------------------
Parameters  : value       lower 90%   higher 90%
alpha       :    (     )
beta        :     (     )
Epeak [keV] :       (   )
Norm@50keV   :     (     )
------------------------------------------------------------

Photon flux (15-150 keV)    in  sec:  (    ) ph/cm2/s
Energy fluence (15-150 keV)             : 0 ( 0  0 ) ergs/cm2
S(25-50 keV) vs. S(50-100 keV) plot
S(25-50 keV)  = 5.92e-07
S(50-100 keV) = 1.11e-06
T90 vs. Hardness ratio plot

T90                                   = 300.127999901772 sec.
Hardness ratio (energy fluence ratio) = 1.875
Color vs. Color plot

Count Ratio  (25-50 keV) / (15-25 keV) = 1.22988
Count Ratio (50-100 keV) / (15-25 keV) = 1.41499
Mask shadow pattern
IMX = -1.694869942920265E-01, IMY = 1.819991427023131E-01
TIME vs. PHA plot around the trigger time

Blue+Cyan dotted lines: Time interval of the scaled map
From 0.000000 to 0.512000
TIME vs. DetID plot around the trigger time

Blue+Cyan dotted lines: Time interval of the scaled map
From 0.000000 to 0.512000
100 us light curve (15-350 keV)
Blue+Cyan dotted lines: Time interval of the scaled map
From 0.000000 to 0.512000
Spacecraft aspect plot

Bright source in the pre-burst/pre-slew/post-slew images
Pre-burst image of 15-350 keV band
Time interval of the image:
-239.376000 -1.452000

# RAcent  DECcent POSerr Theta    Phi  PeakCts   SNR AngSep     Name
#  [deg]    [deg]    ['] [deg]  [deg]                   [']
 29.7679 -49.4652    2.9  12.6  -53.6   0.9263   4.0 ------	UNKNOWN
 84.2085 -15.6290    2.5  50.9 -159.6   2.8938   4.6 ------	UNKNOWN
309.8750 -66.7087    3.2  53.3  -30.2   3.6801   3.6 ------	UNKNOWN
300.6892 -60.5405    2.9  58.9  -24.3   6.0582   3.9 ------	UNKNOWN
Pre-slew background subtracted image of 15-350 keV band
Time interval of the image:
-1.452000 10.324610

# RAcent  DECcent POSerr Theta    Phi  PeakCts   SNR AngSep     Name
#  [deg]    [deg]    ['] [deg]  [deg]                   [']
 49.2010 -39.6357    0.2  14.0 -133.0   3.2235  56.3 ------	UNKNOWN
Post-slew image of 15-350 keV band
Time interval of the image:
46.524600 373.624600

# RAcent  DECcent POSerr Theta    Phi  PeakCts   SNR AngSep     Name
#  [deg]    [deg]    ['] [deg]  [deg]                   [']
 96.3868  -4.8810    2.7  54.9 -158.1   5.0319   4.4 ------	UNKNOWN
292.5469 -76.1077    3.2  57.6  -26.8   7.1394   3.6 ------	UNKNOWN
Plot creation:
Wed Nov 27 16:29:25 EST 2019