Estimated redshift from machine learning (Ukwatta et al. 2016) - may take a few minute to calcaulte
Image
Pre-slew 15.0-350.0 keV image (Event data)
#   RAcent    DECcent   POSerr    Theta     Phi              Peak Cts       SNR   Name
  340.0347   -17.3400   0.0033    44.4987  -170.5020        18.9034484     57.701 TRIG_00930285

Foreground time interval of the image:
 -0.828  84.320 (delta_t =  85.148 [sec])
Background time interval of the image:
-239.408  -0.828 (delta_t = 238.580 [sec])
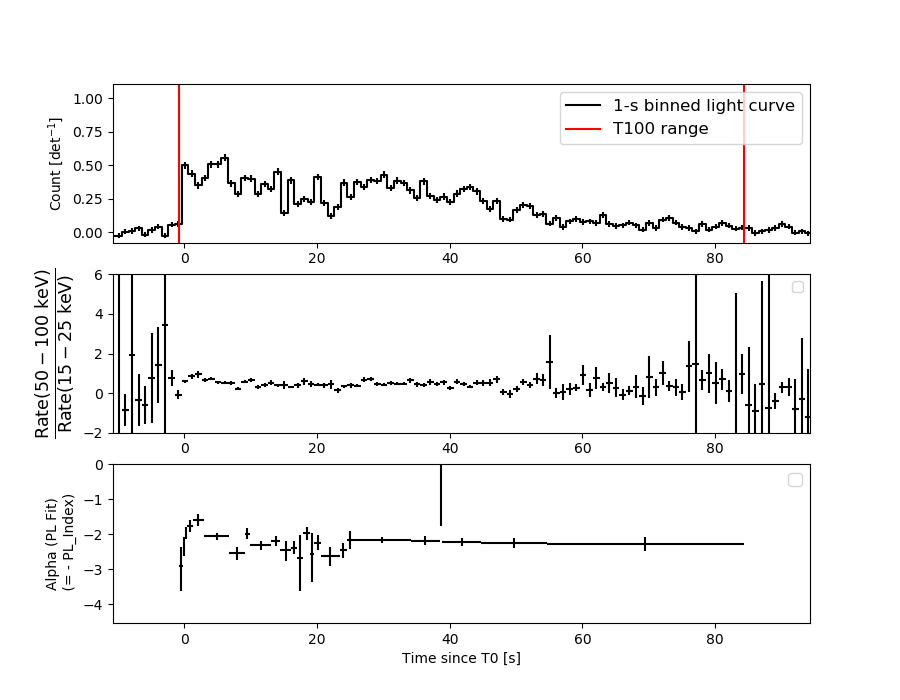
Lightcurves
Notes:
- 1) The mask-weighted light curves are using the flight position.
- 2) Multiple plots of different time binning/intervals are shown to cover all scenarios of short/long GRBs, rate/image triggers, and real/false positives.
- 3) For all the mask-weighted lightcurves, the y-axis units are counts/sec/det where a det is 0.4 x 0.4 = 0.16 sq cm.
- 4) The verticle lines correspond to following: green dotted lines are T50 interval, black dotted lines are T90 interval, blue solid line(s) is a spacecraft slew start time, and orange solid line(s) is a spacecraft slew end time.
- 5) Time of each bin is in the middle of the bin.
1 s binning
From T0-310 s to T0+310 s
From T100_start - 20 s to T100_end + 30 s

Full time interval

64 ms binning
Full time interval

From T100_start to T100_end

From T0-5 sec to T0+5 sec

16 ms binning
From T100_start-5 s to T100_start+5 s

Blue+Cyan dotted lines: Time interval of the scaled map
From 0.000000 to 0.256000
8 ms binning
From T100_start-3 s to T100_start+3 s

Blue+Cyan dotted lines: Time interval of the scaled map
From 0.000000 to 0.256000
2 ms binning
From T100_start-1 s to T100_start+1 s

Blue+Cyan dotted lines: Time interval of the scaled map
From 0.000000 to 0.256000
SN=5 or 10 sec. binning (whichever binning is satisfied first)
SN=5 or 10 sec. binning (T < 200 sec)

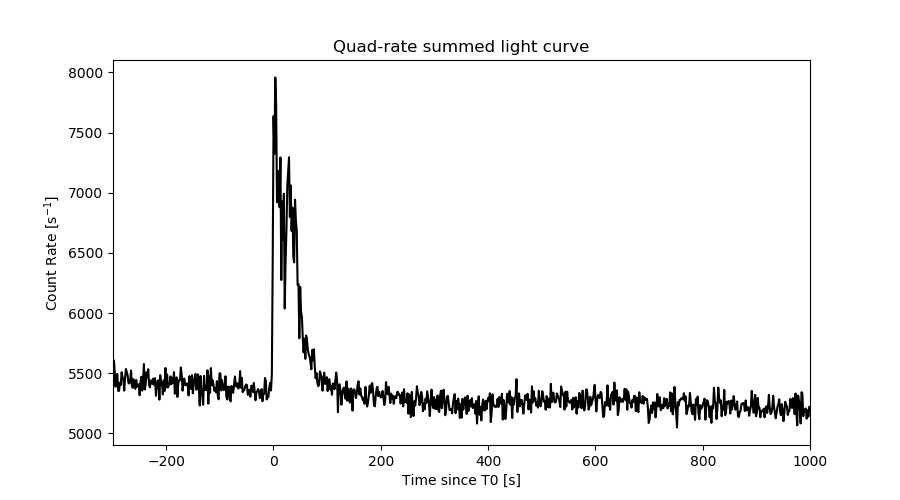
Quad-rate summed light curves (from T0-300s to T0+1000s)
Spectral Evolution
Spectra
Notes:
- 1) The fitting includes the systematic errors.
- 2) When the burst includes telescope slew time periods, the fitting uses an average response file made from multiple 5-s response files through out the slew time plus single time preiod for the non-slew times, and weighted by the total counts in the corresponding time period using addrmf. An average response file is needed becuase a spectral fit using the pre-slew DRM will introduce some errors in both a spectral shape and a normalization if the PHA file contains a lot of the slew/post-slew time interval.
- 3) For fits to more complicated models (e.g. a power-law over a cutoff power-law), the BAT team has decided to require a chi-square improvement of more than 6 for each extra dof.
Time averaged spectrum fit using the average DRM
Power-law model
Time interval is from   -0.828 sec. to   84.320 sec.

Spectral model in power-law:
------------------------------------------------------------
Parameters  : value       lower 90%   higher 90%
Photon index: 2.25484     ( -0.0525186   0.0529935 )
Norm@50keV  : 1.29244E-02    ( -0.000350335   0.000349037 )
------------------------------------------------------------
#Fit statistic : Chi-Squared =          58.03 using 59 PHA bins.
# Reduced chi-squared =          1.018 for     57 degrees of freedom
# Null hypothesis probability =   4.370189e-01

Photon flux (15-150 keV)    in 85.15 sec: 2.20354 ( -0.06683  0.06733 ) ph/cm2/s
Energy fluence (15-150 keV)             : 1.04362e-05 ( -2.59359e-07  2.59594e-07 ) ergs/cm2
Cutoff power-law model
Time interval is from   -0.828 sec. to   84.320 sec.
Spectral model in the cutoff power-law:
------------------------------------------------------------
Parameters  : value       lower 90%   higher 90%
Photon index: 1.99360     ( -0.194221   -1.9936 )
Epeak [keV] : 1.18857      ( -0.210851 0.311669 )
Norm@50keV  : 1.74665E-02    ( -0.000827872   0.0010213 )
------------------------------------------------------------
#Fit statistic : Chi-Squared =          54.51 using 59 PHA bins.
# Reduced chi-squared =         0.9735 for     56 degrees of freedom
# Null hypothesis probability =   5.312836e-01

Photon flux (15-150 keV)    in 85.15 sec: 2.14664 ( -0.0559  0.056 ) ph/cm2/s
Energy fluence (15-150 keV)             : 0 ( 0  0 ) ergs/cm2
Band function

Time interval is from   -0.828 sec. to   84.320 sec.


Spectral model in the Band function:
------------------------------------------------------------
Parameters  : value       lower 90%   higher 90%
alpha       :    (     )
beta        :     (     )
Epeak [keV] :       (   )
Norm@50keV   :     (     )
------------------------------------------------------------

Photon flux (15-150 keV)    in  sec:  (    ) ph/cm2/s
Energy fluence (15-150 keV)             : 0 ( 0  0 ) ergs/cm2
Single BB
Spectral model blackbody:
------------------------------------------------------------
Parameters  : value    Lower 90%  Upper 90%
kT [keV]    : 10.8739  (  )
R^2/D10^2   : 0.629287  (   )
(R is the radius in km and D10 is the distance to the source in units of 10 kpc)
------------------------------------------------------------
#Fit statistic : Chi-Squared =         404.75 using 59 PHA bins.
# Reduced chi-squared =         7.1009 for     57 degrees of freedom
# Null hypothesis probability =   6.803651e-54

Energy  Fluence     90% Error
[keV]   [erg/cm2]   [erg/cm2]
15- 25  1.321e-06   6.259e-08
25- 50  3.679e-06   1.013e-07
50-150  2.435e-06   1.371e-07
15-150  7.435e-06   1.937e-07
Thermal bremsstrahlung (OTTB)
Spectral model: thermal bremsstrahlung
------------------------------------------------------------
Parameters  : value         Lower 90%    Upper 90%
kT [keV]    : 56.3167       (-3.90664      4.3025)
Norm        : 11.0386       (-0.587825     0.499999)
------------------------------------------------------------
#Fit statistic : Chi-Squared =          78.05 using 59 PHA bins.
# Reduced chi-squared =          1.369 for     57 degrees of freedom
# Null hypothesis probability =   3.352537e-02

Energy  Fluence     90% Error
[keV]   [erg/cm2]   [erg/cm2]
15- 25  2.336e-06   1.069e-07
25- 50  3.486e-06   1.022e-07
50-150  3.758e-06   1.771e-07
15-150  9.580e-06   2.384e-07
Double BB
Spectral model: bbodyrad<1> + bbodyrad<2>
------------------------------------------------------------
Parameters  : value         Lower 90%    Upper 90%
kT1 [keV]   : 6.35837        (-0.496208      0.507692)
R1^2/D10^2  : 4.22246        (-1.08179      1.61686)
kT2 [keV]   : 21.2134        (-2.03387      2.54505)
R2^2/D10^2  : 2.99323E-02    (-0.0111273   0.0159907)
------------------------------------------------------------
#Fit statistic : Chi-Squared =          66.00 using 59 PHA bins.
# Reduced chi-squared =          1.200 for     55 degrees of freedom
# Null hypothesis probability =   1.471438e-01

Energy  Fluence     90% Error
[keV]   [erg/cm2]   [erg/cm2]
15- 25  2.305e-06   1.873e-07
25- 50  3.474e-06   1.950e-07
50-150  4.018e-06   3.564e-07
15-150  9.797e-06   5.364e-07
Peak spectrum fit
Power-law model
Time interval is from   -0.136 sec. to    0.864 sec.

Spectral model in power-law:
------------------------------------------------------------
Parameters  : value       lower 90%   higher 90%
Photon index: 1.87572     ( -0.123328   0.127486 )
Norm@50keV  : 4.01073E-02    ( -0.00326792   0.00323552 )
------------------------------------------------------------
#Fit statistic : Chi-Squared =          48.57 using 59 PHA bins.
# Reduced chi-squared =         0.8522 for     57 degrees of freedom
# Null hypothesis probability =   7.789149e-01

Photon flux (15-150 keV)    in 1 sec: 5.69774 ( -0.42911  0.42973 ) ph/cm2/s
Energy fluence (15-150 keV)             : 3.68765e-07 ( -2.9796e-08  3.00027e-08 ) ergs/cm2
Cutoff power-law model
Time interval is from   -0.136 sec. to    0.864 sec.
Spectral model in the cutoff power-law:
------------------------------------------------------------
Parameters  : value       lower 90%   higher 90%
Photon index: 0.804774     ( -0.636655   0.559719 )
Epeak [keV] : 53.5219      ( -7.37517 11.8432 )
Norm@50keV  : 0.145358    ( -0.070172   0.165065 )
------------------------------------------------------------
#Fit statistic : Chi-Squared =          36.80 using 59 PHA bins.
# Reduced chi-squared =         0.6571 for     56 degrees of freedom
# Null hypothesis probability =   9.778870e-01

Photon flux (15-150 keV)    in 1 sec: 5.46529 ( -0.44355  0.44479 ) ph/cm2/s
Energy fluence (15-150 keV)             : 3.48739e-07 ( -3.13148e-08  3.17131e-08 ) ergs/cm2
Band function

Time interval is from   -0.136 sec. to    0.864 sec.


Spectral model in the Band function:
------------------------------------------------------------
Parameters  : value       lower 90%   higher 90%
alpha       :    (     )
beta        :     (     )
Epeak [keV] :       (   )
Norm@50keV   :     (     )
------------------------------------------------------------

Photon flux (15-150 keV)    in  sec:  (    ) ph/cm2/s
Energy fluence (15-150 keV)             : 0 ( 0  0 ) ergs/cm2
Single BB
Spectral model blackbody:
------------------------------------------------------------
Parameters  : value    Lower 90%  Upper 90%
kT [keV]    : 12.3557  (-0.996753  1.07857)
R^2/D10^2   : 1.25216  (-0.338548   0.462802)
(R is the radius in km and D10 is the distance to the source in units of 10 kpc)
------------------------------------------------------------
#Fit statistic : Chi-Squared =          62.76 using 59 PHA bins.
# Reduced chi-squared =          1.101 for     57 degrees of freedom
# Null hypothesis probability =   2.795245e-01

Energy  Fluence     90% Error
[keV]   [erg/cm2]   [erg/cm2]
15- 25  4.051e-08   5.010e-09
25- 50  1.319e-07   1.200e-08
50-150  1.234e-07   1.972e-08
15-150  2.958e-07   2.695e-08
Thermal bremsstrahlung (OTTB)
Spectral model: thermal bremsstrahlung
------------------------------------------------------------
Parameters  : value         Lower 90%    Upper 90%
kT [keV]    : 89.3676       (-18.2189      26.2805)
Norm        : 26.0806       (-2.54681     3.01333)
------------------------------------------------------------
#Fit statistic : Chi-Squared =          38.96 using 59 PHA bins.
# Reduced chi-squared =         0.6835 for     57 degrees of freedom
# Null hypothesis probability =   9.675705e-01

Energy  Fluence     90% Error
[keV]   [erg/cm2]   [erg/cm2]
15- 25  6.804e-08   7.720e-09
25- 50  1.149e-07   9.100e-09
50-150  1.742e-07   5.815e-08
15-150  3.571e-07   6.020e-08
Double BB
Spectral model: bbodyrad<1> + bbodyrad<2>
------------------------------------------------------------
Parameters  : value         Lower 90%    Upper 90%
kT1 [keV]   : 6.07093        (-1.93647      2.00396)
R1^2/D10^2  : 9.33539        (-5.57687      31.1235)
kT2 [keV]   : 17.8636        (-2.99031      4.9161)
R2^2/D10^2  : 0.237298    (-0.159226   0.301431)
------------------------------------------------------------
#Fit statistic : Chi-Squared =          36.73 using 59 PHA bins.
# Reduced chi-squared =         0.6678 for     55 degrees of freedom
# Null hypothesis probability =   9.724542e-01

Energy  Fluence     90% Error
[keV]   [erg/cm2]   [erg/cm2]
15- 25  6.168e-08   2.714e-08
25- 50  1.174e-07   4.484e-08
50-150  1.661e-07   6.883e-08
15-150  3.452e-07   1.185e-07
Pre-slew spectrum (Pre-slew PHA with pre-slew DRM)
Power-law model

Spectral model in power-law:
------------------------------------------------------------
Parameters  : value       lower 90%   higher 90%
Photon index: 2.25484     ( -0.0525186   0.0529935 )
Norm@50keV  : 1.29244E-02    ( -0.000350335   0.000349037 )
------------------------------------------------------------
#Fit statistic : Chi-Squared =          58.03 using 59 PHA bins.
# Reduced chi-squared =          1.018 for     57 degrees of freedom
# Null hypothesis probability =   4.370189e-01

Photon flux (15-150 keV)    in 85.15 sec: 2.20330 ( -0.0668105  0.0673188 ) ph/cm2/s
Energy fluence (15-150 keV)             : 1.04342e-05 ( -2.59333e-07  2.59386e-07 ) ergs/cm2
Cutoff power-law model

Spectral model in the cutoff power-law:
------------------------------------------------------------
Parameters  : value       lower 90%   higher 90%
Photon index: 1.99422     ( -0.20782   -1.99422 )
Epeak [keV] : 1.07549      ( -0.191201 0.282893 )
Norm@50keV  : 1.74546E-02    ( -0.000826669   0.00103106 )
------------------------------------------------------------
#Fit statistic : Chi-Squared =          54.51 using 59 PHA bins.
# Reduced chi-squared =         0.9734 for     56 degrees of freedom
# Null hypothesis probability =   5.313643e-01

Photon flux (15-150 keV)    in 85.15 sec: 2.15238 ( -0.07939  0.08014 ) ph/cm2/s
Energy fluence (15-150 keV)             : 1.02154e-05 ( -3.25358e-07  3.24507e-07 ) ergs/cm2
Band function

Spectral model in the Band function:
------------------------------------------------------------
Parameters  : value       lower 90%   higher 90%
alpha       :    (     )
beta        :     (     )
Epeak [keV] :       (   )
Norm@50keV   :     (     )
------------------------------------------------------------

Photon flux (15-150 keV)    in  sec:  (    ) ph/cm2/s
Energy fluence (15-150 keV)             : 0 ( 0  0 ) ergs/cm2
S(25-50 keV) vs. S(50-100 keV) plot

S(25-50 keV)  = 3.34e-06
S(50-100 keV) = 2.80e-06
T90 vs. Hardness ratio plot

T90                                   = 64.3479999303818 sec.
Hardness ratio (energy fluence ratio) = 0.838323
Color vs. Color plot

Count Ratio  (25-50 keV) / (15-25 keV) = 1.02106
Count Ratio (50-100 keV) / (15-25 keV) = 0.478598
Mask shadow pattern
IMX = -9.691802042739096E-01, IMY = 1.621506513189872E-01
TIME vs. PHA plot around the trigger time

Blue+Cyan dotted lines: Time interval of the scaled map
From 0.000000 to 0.256000
TIME vs. DetID plot around the trigger time
Blue+Cyan dotted lines: Time interval of the scaled map
From 0.000000 to 0.256000
100 us light curve (15-350 keV)

Blue+Cyan dotted lines: Time interval of the scaled map
From 0.000000 to 0.256000
Spacecraft aspect plot
Bright source in the pre-burst/pre-slew/post-slew images
Pre-burst image of 15-350 keV band
Time interval of the image:
-239.408000 -0.828000

# RAcent  DECcent POSerr Theta    Phi  PeakCts   SNR AngSep     Name
#  [deg]    [deg]    ['] [deg]  [deg]                   [']
326.1419  38.2096    5.2  35.7  -75.5   1.2400   2.2    6.9	Cyg X-2
 50.9229  51.5467    3.3  48.0   16.5   1.8967   3.5 ------	UNKNOWN
318.5164 -13.1252    3.0  55.3 -146.5   5.2279   3.8 ------	UNKNOWN
Pre-slew background subtracted image of 15-350 keV band
Time interval of the image:
-0.828000 84.320000

# RAcent  DECcent POSerr Theta    Phi  PeakCts   SNR AngSep     Name
#  [deg]    [deg]    ['] [deg]  [deg]                   [']
326.1662  38.4455   24.2  35.7  -75.1  -0.2439  -0.5    7.4	Cyg X-2
 47.4717  38.4081    2.4  42.0   33.4   1.7784   4.8 ------	UNKNOWN
 62.0873  56.5575    3.3  55.7   12.9   3.2077   3.5 ------	UNKNOWN
340.0347 -17.3400    0.2  44.5 -170.5  18.9020  57.7 ------	UNKNOWN
 11.5020  63.7623    2.4  43.0  -16.5   1.4363   4.8 ------	UNKNOWN
339.0416  29.0276    2.4  22.8  -87.3   1.2534   4.8 ------	UNKNOWN
351.8325  76.5406    3.4  55.6  -25.2   2.3383   3.4 ------	UNKNOWN
318.4745  12.7231    3.4  43.0 -116.2   2.7329   3.4 ------	UNKNOWN
Post-slew image of 15-350 keV band
Time interval of the image:
537.092590 962.646400

# RAcent  DECcent POSerr Theta    Phi  PeakCts   SNR AngSep     Name
#  [deg]    [deg]    ['] [deg]  [deg]                   [']
108.7823  50.0293    3.5  40.8   98.0   4.7513   3.3 ------	UNKNOWN
123.1532  59.7090    3.5  35.9  116.9   2.6872   3.4 ------	UNKNOWN
147.0895  61.2472    2.4  29.4  135.3   2.7342   4.8 ------	UNKNOWN
157.2680  38.2457    2.4   5.6  126.9   1.8750   4.8 ------	UNKNOWN
Plot creation:
Wed Nov 27 16:25:28 EST 2019