Estimated redshift from machine learning (Ukwatta et al. 2016) - may take a few minute to calcaulte
Image
Pre-slew 15.0-350.0 keV image (Event data)
#   RAcent    DECcent   POSerr    Theta     Phi              Peak Cts       SNR   Name
  215.2925    22.8338   0.0188    17.5733  -124.5695         0.5719197     10.137 TRIG_00939079

Foreground time interval of the image:
 -3.048  16.613 (delta_t =  19.661 [sec])
Background time interval of the image:
-239.288  -3.048 (delta_t = 236.240 [sec])
Lightcurves
Notes:
- 1) The mask-weighted light curves are using the flight position.
- 2) Multiple plots of different time binning/intervals are shown to cover all scenarios of short/long GRBs, rate/image triggers, and real/false positives.
- 3) For all the mask-weighted lightcurves, the y-axis units are counts/sec/det where a det is 0.4 x 0.4 = 0.16 sq cm.
- 4) The verticle lines correspond to following: green dotted lines are T50 interval, black dotted lines are T90 interval, blue solid line(s) is a spacecraft slew start time, and orange solid line(s) is a spacecraft slew end time.
- 5) Time of each bin is in the middle of the bin.
1 s binning
From T0-310 s to T0+310 s

From T100_start - 20 s to T100_end + 30 s
Full time interval
64 ms binning
Full time interval

From T100_start to T100_end

From T0-5 sec to T0+5 sec

16 ms binning
From T100_start-5 s to T100_start+5 s

Blue+Cyan dotted lines: Time interval of the scaled map
From 0.000000 to 1.024000
8 ms binning
From T100_start-3 s to T100_start+3 s

Blue+Cyan dotted lines: Time interval of the scaled map
From 0.000000 to 1.024000
2 ms binning
From T100_start-1 s to T100_start+1 s

Blue+Cyan dotted lines: Time interval of the scaled map
From 0.000000 to 1.024000
SN=5 or 10 sec. binning (whichever binning is satisfied first)

SN=5 or 10 sec. binning (T < 200 sec)

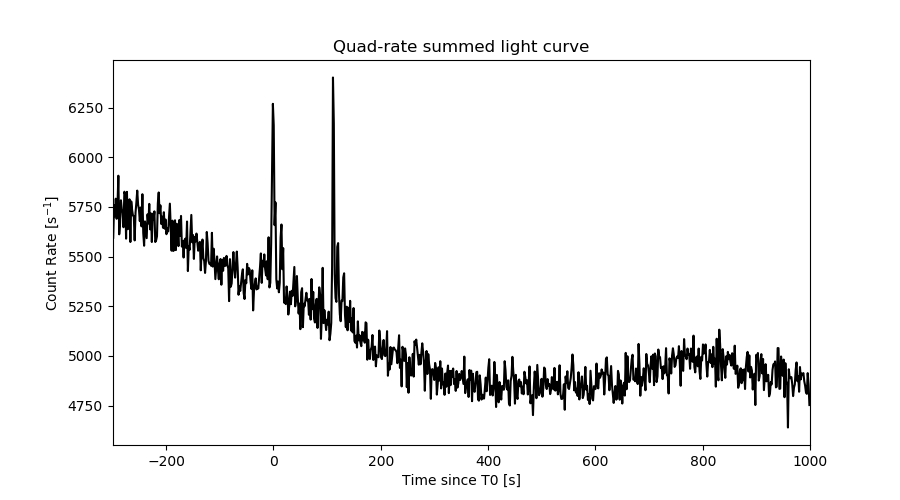
Quad-rate summed light curves (from T0-300s to T0+1000s)
Spectral Evolution

Spectra
Notes:
- 1) The fitting includes the systematic errors.
- 2) When the burst includes telescope slew time periods, the fitting uses an average response file made from multiple 5-s response files through out the slew time plus single time preiod for the non-slew times, and weighted by the total counts in the corresponding time period using addrmf. An average response file is needed becuase a spectral fit using the pre-slew DRM will introduce some errors in both a spectral shape and a normalization if the PHA file contains a lot of the slew/post-slew time interval.
- 3) For fits to more complicated models (e.g. a power-law over a cutoff power-law), the BAT team has decided to require a chi-square improvement of more than 6 for each extra dof.
Time averaged spectrum fit using the average DRM
Power-law model

Time interval is from   -3.048 sec. to  335.968 sec.

Spectral model in power-law:
------------------------------------------------------------
Parameters  : value       lower 90%   higher 90%
Photon index: 1.69125     ( -0.254097   0.264389 )
Norm@50keV  : 3.76634E-04    ( -6.49062e-05   6.34436e-05 )
------------------------------------------------------------
#Fit statistic : Chi-Squared =          52.61 using 59 PHA bins.
# Reduced chi-squared =         0.9230 for     57 degrees of freedom
# Null hypothesis probability =   6.401895e-01

Photon flux (15-150 keV)    in 339 sec: 4.98713E-02 ( -0.0073925  0.0073931 ) ph/cm2/s
Energy fluence (15-150 keV)             : 1.18315e-06 ( -2.11322e-07  2.17435e-07 ) ergs/cm2
Cutoff power-law model

Time interval is from   -3.048 sec. to  335.968 sec.
Spectral model in the cutoff power-law:
------------------------------------------------------------
Parameters  : value       lower 90%   higher 90%
Photon index: 0.945513     ( -1.78143   0.587802 )
Epeak [keV] : 57.8764      ( -15.4495 -57.8386 )
Norm@50keV  : 1.03562E-03    ( -0.00103767   0.0117425 )
------------------------------------------------------------
#Fit statistic : Chi-Squared =          51.48 using 59 PHA bins.
# Reduced chi-squared =         0.9193 for     56 degrees of freedom
# Null hypothesis probability =   6.464880e-01

Photon flux (15-150 keV)    in 339 sec: 4.85230E-02 ( -0.007741  0.0077128 ) ph/cm2/s
Energy fluence (15-150 keV)             : 1.07189e-06 ( -2.60236e-07  2.77105e-07 ) ergs/cm2
Band function

Time interval is from   -3.048 sec. to  335.968 sec.


Spectral model in the Band function:
------------------------------------------------------------
Parameters  : value       lower 90%   higher 90%
alpha       :    (     )
beta        :     (     )
Epeak [keV] :       (   )
Norm@50keV   :     (     )
------------------------------------------------------------

Photon flux (15-150 keV)    in  sec:  (    ) ph/cm2/s
Energy fluence (15-150 keV)             : 0 ( 0  0 ) ergs/cm2
Single BB

Spectral model blackbody:
------------------------------------------------------------
Parameters  : value    Lower 90%  Upper 90%
kT [keV]    : 10.5134  (-1.60733  2.01057)
R^2/D10^2   : 2.00991E-02  (-0.0096392   0.0171138)
(R is the radius in km and D10 is the distance to the source in units of 10 kpc)
------------------------------------------------------------
#Fit statistic : Chi-Squared =          56.16 using 59 PHA bins.
# Reduced chi-squared =         0.9852 for     57 degrees of freedom
# Null hypothesis probability =   5.066440e-01

Energy  Fluence     90% Error
[keV]   [erg/cm2]   [erg/cm2]
15- 25  1.557e-07   4.117e-08
25- 50  4.149e-07   9.373e-08
50-150  2.499e-07   9.953e-08
15-150  8.204e-07   1.710e-07
Thermal bremsstrahlung (OTTB)

Spectral model: thermal bremsstrahlung
------------------------------------------------------------
Parameters  : value         Lower 90%    Upper 90%
kT [keV]    : 108.621       (-46.4496      -109.924)
Norm        : 0.219442       (-0.0370062     0.0488499)
------------------------------------------------------------
#Fit statistic : Chi-Squared =          51.62 using 59 PHA bins.
# Reduced chi-squared =         0.9056 for     57 degrees of freedom
# Null hypothesis probability =   6.764181e-01

Energy  Fluence     90% Error
[keV]   [erg/cm2]   [erg/cm2]
15- 25  1.943e-07   4.053e-08
25- 50  3.414e-07   8.722e-08
50-150  5.790e-07   3.403e-07
15-150  1.115e-06   4.376e-07
Double BB

Spectral model: bbodyrad<1> + bbodyrad<2>
------------------------------------------------------------
Parameters  : value         Lower 90%    Upper 90%
kT1 [keV]   : 8.42197        (-2.19224      2.15813)
R1^2/D10^2  : 3.88811E-02        (-0.0171093      0.0529325)
kT2 [keV]   : 46.5137        (-39.6755      -58.5703)
R2^2/D10^2  : 7.11879E-05    (-3.79763e-05   0.00139555)
------------------------------------------------------------
#Fit statistic : Chi-Squared =          47.95 using 59 PHA bins.
# Reduced chi-squared =         0.8718 for     55 degrees of freedom
# Null hypothesis probability =   7.386340e-01

Energy  Fluence     90% Error
[keV]   [erg/cm2]   [erg/cm2]
15- 25  1.812e-07   1.020e-07
25- 50  3.774e-07   1.807e-07
50-150  5.899e-07   3.353e-07
15-150  1.148e-06   5.537e-07
Peak spectrum fit
Power-law model

Time interval is from  111.784 sec. to  112.784 sec.

Spectral model in power-law:
------------------------------------------------------------
Parameters  : value       lower 90%   higher 90%
Photon index: 1.33358     ( -0.21284   0.213255 )
Norm@50keV  : 1.01393E-02    ( -0.0013108   0.001304 )
------------------------------------------------------------
#Fit statistic : Chi-Squared =          59.83 using 59 PHA bins.
# Reduced chi-squared =          1.050 for     57 degrees of freedom
# Null hypothesis probability =   3.733398e-01

Photon flux (15-150 keV)    in 1 sec: 1.21747 ( -0.15439  0.15445 ) ph/cm2/s
Energy fluence (15-150 keV)             : 9.941e-08 ( -1.45037e-08  1.47174e-08 ) ergs/cm2
Cutoff power-law model

Time interval is from  111.784 sec. to  112.784 sec.
Spectral model in the cutoff power-law:
------------------------------------------------------------
Parameters  : value       lower 90%   higher 90%
Photon index: 0.907416     ( -1.03442   0.538347 )
Epeak [keV] : 123.409      ( -61.8974 -123.437 )
Norm@50keV  : 1.70026E-02    ( -0.00927934   0.041582 )
------------------------------------------------------------
#Fit statistic : Chi-Squared =          59.13 using 59 PHA bins.
# Reduced chi-squared =          1.056 for     56 degrees of freedom
# Null hypothesis probability =   3.618381e-01

Photon flux (15-150 keV)    in 1 sec: 1.19925 ( -0.15966  0.15894 ) ph/cm2/s
Energy fluence (15-150 keV)             : 9.54597e-08 ( -1.68873e-08  1.66802e-08 ) ergs/cm2
Band function

Time interval is from  111.784 sec. to  112.784 sec.


Spectral model in the Band function:
------------------------------------------------------------
Parameters  : value       lower 90%   higher 90%
alpha       :    (     )
beta        :     (     )
Epeak [keV] :       (   )
Norm@50keV   :     (     )
------------------------------------------------------------

Photon flux (15-150 keV)    in  sec:  (    ) ph/cm2/s
Energy fluence (15-150 keV)             : 0 ( 0  0 ) ergs/cm2
Single BB
Spectral model blackbody:
------------------------------------------------------------
Parameters  : value    Lower 90%  Upper 90%
kT [keV]    : 14.9554  (-2.30289  2.81822)
R^2/D10^2   : 0.144699  (-0.0643797   0.11162)
(R is the radius in km and D10 is the distance to the source in units of 10 kpc)
------------------------------------------------------------
#Fit statistic : Chi-Squared =          70.03 using 59 PHA bins.
# Reduced chi-squared =          1.229 for     57 degrees of freedom
# Null hypothesis probability =   1.152021e-01

Energy  Fluence     90% Error
[keV]   [erg/cm2]   [erg/cm2]
15- 25  6.779e-09   1.659e-09
25- 50  2.686e-08   4.345e-09
50-150  4.083e-08   1.098e-08
15-150  7.447e-08   1.530e-08
Thermal bremsstrahlung (OTTB)

Spectral model: thermal bremsstrahlung
------------------------------------------------------------
Parameters  : value         Lower 90%    Upper 90%
kT [keV]    : 200.000       (-56.1267      -200)
Norm        : 4.96064       (-0.631392     0.631392)
------------------------------------------------------------
#Fit statistic : Chi-Squared =          61.61 using 59 PHA bins.
# Reduced chi-squared =          1.081 for     57 degrees of freedom
# Null hypothesis probability =   3.147087e-01

Energy  Fluence     90% Error
[keV]   [erg/cm2]   [erg/cm2]
15- 25  1.241e-08   7.020e-09
25- 50  2.388e-08   1.307e-08
50-150  5.237e-08   2.906e-08
15-150  8.866e-08   4.893e-08
Double BB

Spectral model: bbodyrad<1> + bbodyrad<2>
------------------------------------------------------------
Parameters  : value         Lower 90%    Upper 90%
kT1 [keV]   : 9.65393        (-3.3791      3.21712)
R1^2/D10^2  : 0.487645        (-0.289558      1.10521)
kT2 [keV]   : 47.7476        (-28.0944      -49.317)
R2^2/D10^2  : 2.44109E-03    (-0.00197306   0.0323001)
------------------------------------------------------------
#Fit statistic : Chi-Squared =          57.18 using 59 PHA bins.
# Reduced chi-squared =          1.040 for     55 degrees of freedom
# Null hypothesis probability =   3.940562e-01

Energy  Fluence     90% Error
[keV]   [erg/cm2]   [erg/cm2]
15- 25  9.766e-09   4.598e-09
25- 50  2.609e-08   1.258e-08
50-150  6.270e-08   3.332e-08
15-150  9.856e-08   4.643e-08
Pre-slew spectrum (Pre-slew PHA with pre-slew DRM)
Power-law model

Spectral model in power-law:
------------------------------------------------------------
Parameters  : value       lower 90%   higher 90%
Photon index: 1.33718     ( -0.232039   0.231753 )
Norm@50keV  : 2.10642E-03    ( -0.000288332   0.000287259 )
------------------------------------------------------------
#Fit statistic : Chi-Squared =          54.36 using 59 PHA bins.
# Reduced chi-squared =         0.9536 for     57 degrees of freedom
# Null hypothesis probability =   5.748528e-01

Photon flux (15-150 keV)    in 19.66 sec: 0.253104 ( -0.0345192  0.0345614 ) ph/cm2/s
Energy fluence (15-150 keV)             : 4.05643e-07 ( -6.2162e-08  6.31178e-08 ) ergs/cm2
Cutoff power-law model

Spectral model in the cutoff power-law:
------------------------------------------------------------
Parameters  : value       lower 90%   higher 90%
Photon index: 0.744889     ( -1.10627   0.754545 )
Epeak [keV] : 106.314      (   )
Norm@50keV  : 4.19163E-03    (     )
------------------------------------------------------------
#Fit statistic : Chi-Squared =          53.12 using 59 PHA bins.
# Reduced chi-squared =         0.9485 for     56 degrees of freedom
# Null hypothesis probability =   5.846904e-01

Photon flux (15-150 keV)    in 19.66 sec: 0.246940 ( -0.035918  0.035827 ) ph/cm2/s
Energy fluence (15-150 keV)             : 3.8684e-07 ( -6.88179e-08  6.95296e-08 ) ergs/cm2
Band function

Spectral model in the Band function:
------------------------------------------------------------
Parameters  : value       lower 90%   higher 90%
alpha       :    (     )
beta        :     (     )
Epeak [keV] :       (   )
Norm@50keV   :     (     )
------------------------------------------------------------

Photon flux (15-150 keV)    in  sec:  (    ) ph/cm2/s
Energy fluence (15-150 keV)             : 0 ( 0  0 ) ergs/cm2
S(25-50 keV) vs. S(50-100 keV) plot

S(25-50 keV)  = 3.19e-07
S(50-100 keV) = 3.97e-07
T90 vs. Hardness ratio plot
T90                                   = 284.81199991703 sec.
Hardness ratio (energy fluence ratio) = 1.24451
Color vs. Color plot

Count Ratio  (25-50 keV) / (15-25 keV) = 1.48533
Count Ratio (50-100 keV) / (15-25 keV) = 0.726262
Mask shadow pattern

IMX = -1.797007330338441E-01, IMY = 2.607881449264923E-01
TIME vs. PHA plot around the trigger time

Blue+Cyan dotted lines: Time interval of the scaled map
From 0.000000 to 1.024000
TIME vs. DetID plot around the trigger time
Blue+Cyan dotted lines: Time interval of the scaled map
From 0.000000 to 1.024000
100 us light curve (15-350 keV)

Blue+Cyan dotted lines: Time interval of the scaled map
From 0.000000 to 1.024000
Spacecraft aspect plot

Bright source in the pre-burst/pre-slew/post-slew images
Pre-burst image of 15-350 keV band
Time interval of the image:
-239.288000 -3.048000

# RAcent  DECcent POSerr Theta    Phi  PeakCts   SNR AngSep     Name
#  [deg]    [deg]    ['] [deg]  [deg]                   [']
254.3053  35.2201    6.4  50.1 -156.2   1.2463   1.8   10.5	Her X-1
241.9393  69.8831    2.9  51.1  157.6   6.0402   4.0 ------	UNKNOWN
168.4745  13.8588    2.5  28.7   29.6   1.6743   4.6 ------	UNKNOWN
190.4028  -9.7581    2.7  36.2  -31.0   1.5002   4.2 ------	UNKNOWN
254.5405  31.2562    2.6  50.8 -151.2   3.2832   4.5 ------	UNKNOWN
212.6039 -14.6029    3.0  43.6  -64.1   4.4792   3.9 ------	UNKNOWN
249.5459  17.9912    2.2  49.7 -133.0   7.5901   5.2 ------	UNKNOWN
Pre-slew background subtracted image of 15-350 keV band
Time interval of the image:
-3.048000 16.612600

# RAcent  DECcent POSerr Theta    Phi  PeakCts   SNR AngSep     Name
#  [deg]    [deg]    ['] [deg]  [deg]                   [']
254.5987  35.5240    0.0  50.3 -156.7   0.1018   0.7   12.9	Her X-1
249.2607  69.4930    2.3  53.1  159.6   1.5900   4.9 ------	UNKNOWN
166.2955   9.4501    2.4  32.9   24.4   0.3382   4.7 ------	UNKNOWN
168.7248 -15.7146    2.6  49.6   -5.1   0.4925   4.4 ------	UNKNOWN
215.2926  22.8338    1.1  17.6 -124.6   0.5719  10.1 ------	UNKNOWN
Post-slew image of 15-350 keV band
Time interval of the image:
58.412590 962.853700

# RAcent  DECcent POSerr Theta    Phi  PeakCts   SNR AngSep     Name
#  [deg]    [deg]    ['] [deg]  [deg]                   [']
254.6370  35.3769   11.0  36.3 -179.2   1.0793   1.0    9.0	Her X-1
267.0744  53.2112    3.9  49.3  158.3  10.7267   3.0 ------	UNKNOWN
164.6854  -5.5459    2.7  57.0    6.4  15.9785   4.3 ------	UNKNOWN
176.1582 -15.6699    3.6  54.3  -11.7   5.3127   3.2 ------	UNKNOWN
218.7775   0.6415    3.3  22.5  -69.4   2.9276   3.5 ------	UNKNOWN
205.6240 -25.1515    2.4  48.9  -48.5  14.7432   4.8 ------	UNKNOWN
259.1557   0.8365    2.6  48.0 -129.1  15.2985   4.5 ------	UNKNOWN
Plot creation:
Tue Dec 17 16:48:28 EST 2019