Special notes of this burst
Image
Pre-slew 15.0-350.0 keV image (Event data)
#   RAcent    DECcent   POSerr    Theta     Phi              Peak Cts       SNR   Name
  154.8306   -38.1520   0.0076    39.7720   119.3195        24.4156116     25.040 TRIG_00945521

Foreground time interval of the image:
-15.280  14.821 (delta_t =  30.101 [sec])
Background time interval of the image:
-239.280 -15.280 (delta_t = 224.000 [sec])
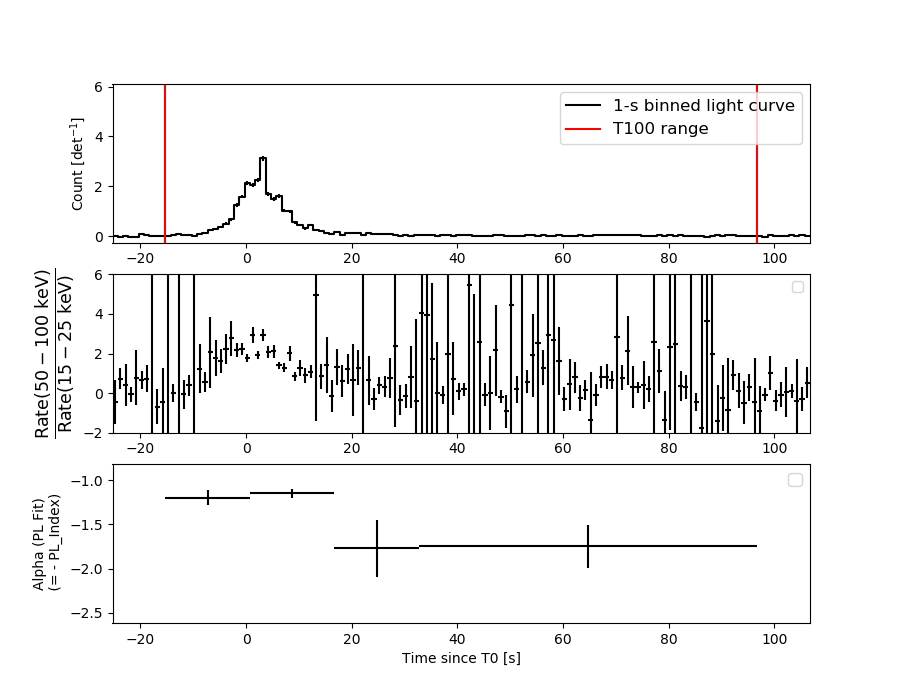
Lightcurves
Notes:
- 1) The mask-weighted light curves are using the flight position.
- 2) Multiple plots of different time binning/intervals are shown to cover all scenarios of short/long GRBs, rate/image triggers, and real/false positives.
- 3) For all the mask-weighted lightcurves, the y-axis units are counts/sec/det where a det is 0.4 x 0.4 = 0.16 sq cm.
- 4) The verticle lines correspond to following: green dotted lines are T50 interval, black dotted lines are T90 interval, blue solid line(s) is a spacecraft slew start time, and orange solid line(s) is a spacecraft slew end time.
- 5) Time of each bin is in the middle of the bin.
1 s binning
From T0-310 s to T0+310 s
From T100_start - 20 s to T100_end + 30 s
Full time interval
64 ms binning
Full time interval

From T100_start to T100_end

From T0-5 sec to T0+5 sec
16 ms binning
From T100_start-5 s to T100_start+5 s
Blue+Cyan dotted lines: Time interval of the scaled map
From 0.000000 to 1.024000
8 ms binning
From T100_start-3 s to T100_start+3 s

Blue+Cyan dotted lines: Time interval of the scaled map
From 0.000000 to 1.024000
2 ms binning
From T100_start-1 s to T100_start+1 s

Blue+Cyan dotted lines: Time interval of the scaled map
From 0.000000 to 1.024000
SN=5 or 10 sec. binning (whichever binning is satisfied first)
SN=5 or 10 sec. binning (T < 200 sec)

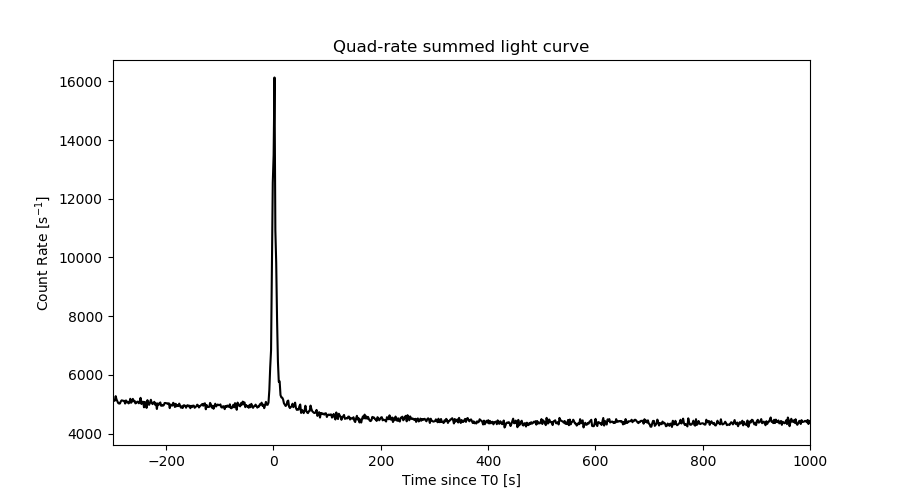
Quad-rate summed light curves (from T0-300s to T0+1000s)
Spectral Evolution
Spectra
Notes:
- 1) The fitting includes the systematic errors.
- 2) When the burst includes telescope slew time periods, the fitting uses an average response file made from multiple 5-s response files through out the slew time plus single time preiod for the non-slew times, and weighted by the total counts in the corresponding time period using addrmf. An average response file is needed becuase a spectral fit using the pre-slew DRM will introduce some errors in both a spectral shape and a normalization if the PHA file contains a lot of the slew/post-slew time interval.
- 3) For fits to more complicated models (e.g. a power-law over a cutoff power-law), the BAT team has decided to require a chi-square improvement of more than 6 for each extra dof.
Time averaged spectrum fit using the average DRM
Power-law model

Time interval is from  -15.280 sec. to   96.720 sec.
XSPEC12>exit
 XSPEC: quit


Spectral model in power-law:
------------------------------------------------------------
Parameters  : value       lower 90%   higher 90%
Photon index: 1.23195     ( -0.0461953   0.0459914 )
Norm@50keV  : 1.70440E-02    ( -0.000437285   0.000436964 )
------------------------------------------------------------

Photon flux (15-150 keV)    in 112 sec: 2.01009 ( -0.05571  0.05584 ) ph/cm2/s
Energy fluence (15-150 keV)             : 1.91989e-05 ( -5.09844e-07  5.10228e-07 ) ergs/cm2
Cutoff power-law model

Time interval is from  -15.280 sec. to   96.720 sec.
 XSPEC: quit


Spectral model in the cutoff power-law:
------------------------------------------------------------
Parameters  : value       lower 90%   higher 90%
Photon index: 0.993190     ( -0.188447   0.180811 )
Epeak [keV] : 245.349      ( -82.2239 514.241 )
Norm@50keV  : 2.16774E-02    ( -0.00352686   0.00438649 )
------------------------------------------------------------

Photon flux (15-150 keV)    in 112 sec: 1.98230 ( -0.05912  0.05928 ) ph/cm2/s
Energy fluence (15-150 keV)             : 1.89893e-05 ( -5.37919e-07  5.36499e-07 ) ergs/cm2
Band function

Time interval is from  -15.280 sec. to   96.720 sec.


Spectral model in the Band function:
------------------------------------------------------------
Parameters  : value       lower 90%   higher 90%
alpha       :    (     )
beta        :     (     )
Epeak [keV] :       (   )
Norm@50keV   :     (     )
------------------------------------------------------------

Photon flux (15-150 keV)    in  sec:  (    ) ph/cm2/s
Energy fluence (15-150 keV)             : 0 ( 0  0 ) ergs/cm2
Single BB

XSPEC12>exit
 XSPEC: quit


Spectral model blackbody:
------------------------------------------------------------
Parameters  : value    Lower 90%  Upper 90%
kT [keV]    : 20.0574  (  )
R^2/D10^2   : 8.97035E-02  (   )
(R is the radius in km and D10 is the distance to the source in units of 10 kpc)
------------------------------------------------------------

Energy  Fluence     90% Error
[keV]   [erg/cm2]   [erg/cm2]
15- 25  7.783e-07   4.110e-08
25- 50  3.884e-06   1.518e-07
50-150  1.159e-05   4.698e-07
15-150  1.625e-05   4.984e-07
Thermal bremsstrahlung (OTTB)

XSPEC12>/*
XSPEC12>exit
 XSPEC: quit


Spectral model: thermal bremsstrahlung
------------------------------------------------------------
Parameters  : value         Lower 90%    Upper 90%
kT [keV]    : 199.363       (      )
Norm        : 8.59546       (     )
------------------------------------------------------------

Energy  Fluence     90% Error
[keV]   [erg/cm2]   [erg/cm2]
15- 25  2.397e-06   7.168e-08
25- 50  4.611e-06   1.294e-07
50-150  1.011e-05   2.811e-07
15-150  1.712e-05   4.928e-07
Double BB

XSPEC12>/*
XSPEC12>exit
 XSPEC: quit


Spectral model: bbodyrad<1> + bbodyrad<2>
------------------------------------------------------------
Parameters  : value         Lower 90%    Upper 90%
kT1 [keV]   : 9.06745        (-0.870991      0.939529)
R1^2/D10^2  : 0.748481        (-0.189339      0.273187)
kT2 [keV]   : 35.3832        (-3.70294      5.18362)
R2^2/D10^2  : 1.14015E-02    (-0.00403394   0.00511021)
------------------------------------------------------------

Energy  Fluence     90% Error
[keV]   [erg/cm2]   [erg/cm2]
15- 25  1.572e-06   1.406e-07
25- 50  4.371e-06   2.498e-07
50-150  1.314e-05   1.014e-06
15-150  1.908e-05   1.215e-06
Peak spectrum fit
Power-law model

Time interval is from    8.220 sec. to    9.220 sec.
XSPEC12>exit
 XSPEC: quit


Spectral model in power-law:
------------------------------------------------------------
Parameters  : value       lower 90%   higher 90%
Photon index: 1.76585     ( -0.230927   0.242967 )
Norm@50keV  : 3.56247E-02    ( -0.00582387   0.0057321 )
------------------------------------------------------------

Photon flux (15-150 keV)    in 1 sec: 4.84575 ( -0.74278  0.74343 ) ph/cm2/s
Energy fluence (15-150 keV)             : 3.28488e-07 ( -5.45073e-08  5.48483e-08 ) ergs/cm2
Cutoff power-law model

Time interval is from    8.220 sec. to    9.220 sec.
 XSPEC: quit


Spectral model in the cutoff power-law:
------------------------------------------------------------
Parameters  : value       lower 90%   higher 90%
Photon index: 0.521373     ( -1.40567   1.14 )
Epeak [keV] : 57.3426      ( -12.4055 86.1173 )
Norm@50keV  : 0.161939    ( -0.161955   0.680768 )
------------------------------------------------------------

Photon flux (15-150 keV)    in 1 sec: 4.30882 ( -1.089  0.69372 ) ph/cm2/s
Energy fluence (15-150 keV)             : 3.15762e-07 ( -5.49485e-08  5.60128e-08 ) ergs/cm2
Band function

Time interval is from    8.220 sec. to    9.220 sec.


Spectral model in the Band function:
------------------------------------------------------------
Parameters  : value       lower 90%   higher 90%
alpha       :    (     )
beta        :     (     )
Epeak [keV] :       (   )
Norm@50keV   :     (     )
------------------------------------------------------------

Photon flux (15-150 keV)    in  sec:  (    ) ph/cm2/s
Energy fluence (15-150 keV)             : 0 ( 0  0 ) ergs/cm2
Single BB
XSPEC12>exit
 XSPEC: quit


Spectral model blackbody:
------------------------------------------------------------
Parameters  : value    Lower 90%  Upper 90%
kT [keV]    : 13.3413  (-1.98575  2.20387)
R^2/D10^2   : 0.874995  (-0.382251   0.694554)
(R is the radius in km and D10 is the distance to the source in units of 10 kpc)
------------------------------------------------------------

Energy  Fluence     90% Error
[keV]   [erg/cm2]   [erg/cm2]
15- 25  3.301e-08   9.475e-09
25- 50  1.169e-07   2.618e-08
50-150  1.335e-07   4.024e-08
15-150  2.833e-07   5.410e-08
Thermal bremsstrahlung (OTTB)

XSPEC12>/*
XSPEC12>exit
 XSPEC: quit


Spectral model: thermal bremsstrahlung
------------------------------------------------------------
Parameters  : value         Lower 90%    Upper 90%
kT [keV]    : 107.630       (-39.4647      -107.868)
Norm        : 21.6112       (-3.97445     4.73162)
------------------------------------------------------------

Energy  Fluence     90% Error
[keV]   [erg/cm2]   [erg/cm2]
15- 25  5.646e-08   1.121e-08
25- 50  9.904e-08   1.908e-08
50-150  1.671e-07   8.854e-08
15-150  3.226e-07   1.034e-07
Double BB

XSPEC12>/*
XSPEC12>exit
 XSPEC: quit


Spectral model: bbodyrad<1> + bbodyrad<2>
------------------------------------------------------------
Parameters  : value         Lower 90%    Upper 90%
kT1 [keV]   : 2.18069        (-2.17767      34.7103)
R1^2/D10^2  : 1009.56        (-1021.34      -1022.7)
kT2 [keV]   : 14.5273        (-2.35094      -14.5244)
R2^2/D10^2  : 0.607478    (-0.604907   0.349724)
------------------------------------------------------------

Energy  Fluence     90% Error
[keV]   [erg/cm2]   [erg/cm2]
15- 25  4.628e-08   1.772e-08
25- 50  1.048e-07   2.847e-08
50-150  1.472e-07   4.602e-08
15-150  2.982e-07   7.340e-08
Pre-slew spectrum (Pre-slew PHA with pre-slew DRM)
Power-law model
XSPEC12>exit
 XSPEC: quit


Spectral model in power-law:
------------------------------------------------------------
Parameters  : value       lower 90%   higher 90%
Photon index: 1.16859     ( -0.0447686   0.0445527 )
Norm@50keV  : 5.74474E-02    ( -0.00144246   0.001441 )
------------------------------------------------------------

Photon flux (15-150 keV)    in 30.1 sec: 6.71486 ( -0.17986  0.180184 ) ph/cm2/s
Energy fluence (15-150 keV)             : 1.77026e-05 ( -4.58128e-07  4.58507e-07 ) ergs/cm2
Cutoff power-law model

 XSPEC: quit


Spectral model in the cutoff power-law:
------------------------------------------------------------
Parameters  : value       lower 90%   higher 90%
Photon index: 0.943111     ( -0.182255   0.175125 )
Epeak [keV] : 276.654      ( -96.6944 657.375 )
Norm@50keV  : 7.18944E-02    ( -0.0112392   0.0138581 )
------------------------------------------------------------

Photon flux (15-150 keV)    in 30.1 sec: 6.63224 ( -0.18954  0.19003 ) ph/cm2/s
Energy fluence (15-150 keV)             : 1.75499e-05 ( -4.80185e-07  4.77266e-07 ) ergs/cm2
Band function
Spectral model in the Band function:
------------------------------------------------------------
Parameters  : value       lower 90%   higher 90%
alpha       :    (     )
beta        :     (     )
Epeak [keV] :       (   )
Norm@50keV   :     (     )
------------------------------------------------------------

Photon flux (15-150 keV)    in  sec:  (    ) ph/cm2/s
Energy fluence (15-150 keV)             : 0 ( 0  0 ) ergs/cm2
S(25-50 keV) vs. S(50-100 keV) plot

S(25-50 keV)  = 4.11e-06
S(50-100 keV) = 7.00e-06
T90 vs. Hardness ratio plot
T90                                   = 48 sec.
Hardness ratio (energy fluence ratio) = 1.70316
Color vs. Color plot

Count Ratio  (25-50 keV) / (15-25 keV) = 1.85019
Count Ratio (50-100 keV) / (15-25 keV) = 1.74622
Mask shadow pattern

IMX = -4.075790955843092E-01, IMY = -7.257198588464503E-01
TIME vs. PHA plot around the trigger time

Blue+Cyan dotted lines: Time interval of the scaled map
From 0.000000 to 1.024000
TIME vs. DetID plot around the trigger time

Blue+Cyan dotted lines: Time interval of the scaled map
From 0.000000 to 1.024000
100 us light curve (15-350 keV)
Blue+Cyan dotted lines: Time interval of the scaled map
From 0.000000 to 1.024000
Spacecraft aspect plot
Bright source in the pre-burst/pre-slew/post-slew images
Pre-burst image of 15-350 keV band
Time interval of the image:
-239.280000 -15.280000

# RAcent  DECcent POSerr Theta    Phi  PeakCts   SNR AngSep     Name
#  [deg]    [deg]    ['] [deg]  [deg]                   [']
170.3416 -60.6632    1.9  17.2   97.5   1.8289   6.0    2.5	Cen X-3
186.6993 -62.7729    1.7   9.2   99.5   1.9368   6.9    1.2	GX 301-2
255.7834 -37.9029  332.6  38.5  -92.1  -0.0293  -0.0   10.2	4U 1700-377
256.5086 -36.5322    7.5  40.0  -92.5   1.7290   1.5    7.4	GX 349+2
264.7375 -44.4476    8.4  37.2  -76.9   0.8631   1.4    0.3	4U 1735-44
180.1652 -24.7010    2.5  42.5  158.1   2.4472   4.5 ------	UNKNOWN
154.6428 -70.9801    3.0  20.9   61.7   1.2186   3.9 ------	UNKNOWN
 20.2088 -72.2302    2.8  44.4   12.5   1.9482   4.2 ------	UNKNOWN
258.7018 -36.6429    2.2  40.8  -90.1   6.4912   5.3 ------	UNKNOWN
Pre-slew background subtracted image of 15-350 keV band
Time interval of the image:
-15.280000 14.820590

# RAcent  DECcent POSerr Theta    Phi  PeakCts   SNR AngSep     Name
#  [deg]    [deg]    ['] [deg]  [deg]                   [']
170.5513 -60.5514  129.1  17.1   98.0   0.0193   0.1    8.2	Cen X-3
186.6655 -62.7773   78.1   9.2   99.5   0.0264   0.1    0.5	GX 301-2
255.8533 -37.7898   12.4  38.6  -92.1   0.3462   0.9    7.1	4U 1700-377
256.4538 -36.6005   23.6  39.9  -92.5   0.2252   0.5   10.7	GX 349+2
264.6661 -44.5894  208.7  37.0  -76.9   0.0135   0.1    9.0	4U 1735-44
154.8306 -38.1520    0.5  39.8  119.3  24.4156  25.0 ------	UNKNOWN
 95.7438 -70.4472    3.9  38.1   45.9   1.4941   3.0 ------	UNKNOWN
174.4749 -30.4895    3.0  38.8  147.7   1.5072   3.8 ------	UNKNOWN
223.3407 -46.7797    2.4  18.8 -127.9   0.6795   4.8 ------	UNKNOWN
257.7558 -51.7384    3.0  28.7  -74.1   0.5414   3.9 ------	UNKNOWN
248.1429 -46.3982    3.0  28.3  -91.5   0.5240   3.8 ------	UNKNOWN
257.3732 -36.1131    2.9  40.7  -91.9   1.7777   3.9 ------	UNKNOWN
253.5533 -33.7726    2.8  41.1  -97.9   1.7494   4.2 ------	UNKNOWN
Post-slew image of 15-350 keV band
Time interval of the image:
73.020590 962.857900

# RAcent  DECcent POSerr Theta    Phi  PeakCts   SNR AngSep     Name
#  [deg]    [deg]    ['] [deg]  [deg]                   [']
135.5102 -40.5734    2.1  15.1   41.5   3.9132   5.5    1.4	Vela X-1
170.2959 -60.6176    1.1  24.5  -51.7   8.3520  10.2    0.7	Cen X-3
186.6537 -62.7678    0.9  31.2  -61.0  12.3720  12.9    0.2	GX 301-2
141.6316 -23.4796    2.5  18.5  105.4   4.1437   4.6 ------	UNKNOWN
188.0697  -2.6167    4.2  46.7 -164.5   4.3044   2.8 ------	UNKNOWN
170.6473 -67.1294    2.4  30.3  -45.4   4.0859   4.9 ------	UNKNOWN
176.8721 -69.1982    2.4  33.2  -47.3   4.2223   4.9 ------	UNKNOWN
207.0744 -20.7444    2.7  48.0 -129.1  12.7414   4.3 ------	UNKNOWN
207.8071 -27.0007    3.0  45.4 -121.2  10.0345   3.9 ------	UNKNOWN
209.8116 -42.8407    3.0  41.3  -98.7  10.9373   3.8 ------	UNKNOWN
Plot creation:
Mon Jun  1 00:48:14 EDT 2020