Estimated redshift from machine learning (Ukwatta et al. 2016) - may take a few minute to calcaulte
Image
Pre-slew 15.0-350.0 keV image (Event data)

#   RAcent    DECcent   POSerr    Theta     Phi              Peak Cts       SNR   Name
  210.0117    27.5474   0.0034    31.0486  -156.8966         5.5724251     57.295 TRIG_00950330

Foreground time interval of the image:
 -8.820  10.229 (delta_t =  19.049 [sec])
Background time interval of the image:
-239.672  -8.820 (delta_t = 230.852 [sec])
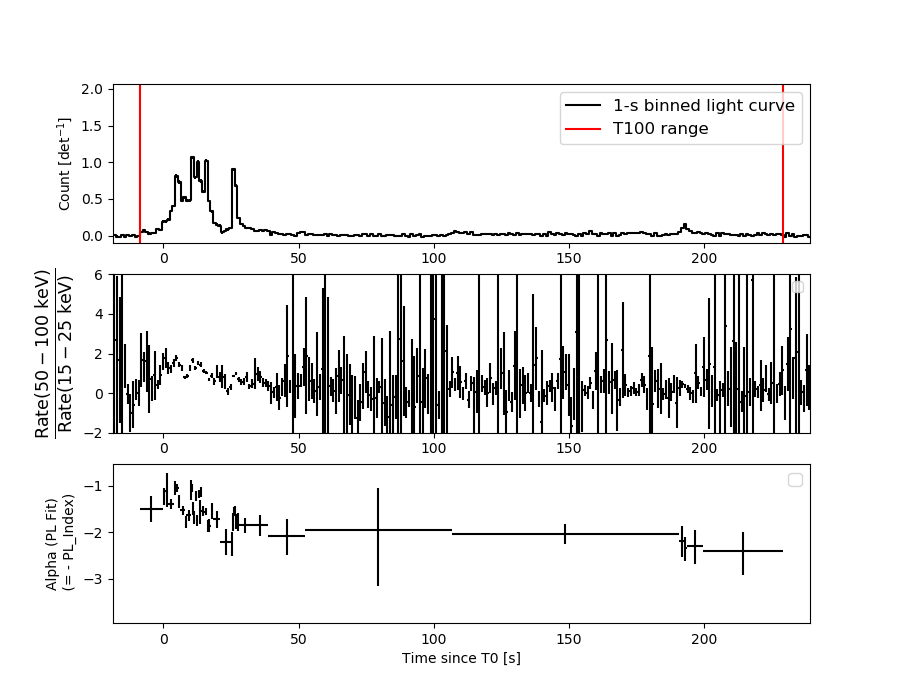
Lightcurves
Notes:
- 1) The mask-weighted light curves are using the flight position.
- 2) Multiple plots of different time binning/intervals are shown to cover all scenarios of short/long GRBs, rate/image triggers, and real/false positives.
- 3) For all the mask-weighted lightcurves, the y-axis units are counts/sec/det where a det is 0.4 x 0.4 = 0.16 sq cm.
- 4) The verticle lines correspond to following: green dotted lines are T50 interval, black dotted lines are T90 interval, blue solid line(s) is a spacecraft slew start time, and orange solid line(s) is a spacecraft slew end time.
- 5) Time of each bin is in the middle of the bin.
1 s binning
From T0-310 s to T0+310 s
From T100_start - 20 s to T100_end + 30 s

Full time interval

64 ms binning
Full time interval

From T100_start to T100_end
From T0-5 sec to T0+5 sec
16 ms binning
From T100_start-5 s to T100_start+5 s

Blue+Cyan dotted lines: Time interval of the scaled map
From 0.000000 to 0.512000
8 ms binning
From T100_start-3 s to T100_start+3 s

Blue+Cyan dotted lines: Time interval of the scaled map
From 0.000000 to 0.512000
2 ms binning
From T100_start-1 s to T100_start+1 s

Blue+Cyan dotted lines: Time interval of the scaled map
From 0.000000 to 0.512000
SN=5 or 10 sec. binning (whichever binning is satisfied first)

SN=5 or 10 sec. binning (T < 200 sec)

Quad-rate summed light curves (from T0-300s to T0+1000s)

Spectral Evolution
Spectra
Notes:
- 1) The fitting includes the systematic errors.
- 2) When the burst includes telescope slew time periods, the fitting uses an average response file made from multiple 5-s response files through out the slew time plus single time preiod for the non-slew times, and weighted by the total counts in the corresponding time period using addrmf. An average response file is needed becuase a spectral fit using the pre-slew DRM will introduce some errors in both a spectral shape and a normalization if the PHA file contains a lot of the slew/post-slew time interval.
- 3) For fits to more complicated models (e.g. a power-law over a cutoff power-law), the BAT team has decided to require a chi-square improvement of more than 6 for each extra dof.
Time averaged spectrum fit using the average DRM
Power-law model

Time interval is from   -8.820 sec. to  229.076 sec.
XSPEC12>exit
 XSPEC: quit


Spectral model in power-law:
------------------------------------------------------------
Parameters  : value       lower 90%   higher 90%
Photon index: 1.60790     ( -0.046169   0.0462334 )
Norm@50keV  : 5.03621E-03    ( -0.000117471   0.000117463 )
------------------------------------------------------------

Photon flux (15-150 keV)    in 237.9 sec: 0.648793 ( -0.017439  0.017513 ) ph/cm2/s
Energy fluence (15-150 keV)             : 1.11958e-05 ( -2.70461e-07  2.70806e-07 ) ergs/cm2
Cutoff power-law model

Time interval is from   -8.820 sec. to  229.076 sec.
 XSPEC: quit


Spectral model in the cutoff power-law:
------------------------------------------------------------
Parameters  : value       lower 90%   higher 90%
Photon index: 1.53349     ( -0.184252   0.101333 )
Epeak [keV] : 345.794      ( -345.801 -345.801 )
Norm@50keV  : 5.44326E-03    ( -0.000496635   0.00112127 )
------------------------------------------------------------

Photon flux (15-150 keV)    in 237.9 sec: 0.644519 ( -0.02001  0.019447 ) ph/cm2/s
Energy fluence (15-150 keV)             : 1.11354e-05 ( -3.05961e-07  3.04598e-07 ) ergs/cm2
Band function

Time interval is from   -8.820 sec. to  229.076 sec.


Spectral model in the Band function:
------------------------------------------------------------
Parameters  : value       lower 90%   higher 90%
alpha       :    (     )
beta        :     (     )
Epeak [keV] :       (   )
Norm@50keV   :     (     )
------------------------------------------------------------

Photon flux (15-150 keV)    in  sec:  (    ) ph/cm2/s
Energy fluence (15-150 keV)             : 0 ( 0  0 ) ergs/cm2
Single BB

XSPEC12>exit
 XSPEC: quit


Spectral model blackbody:
------------------------------------------------------------
Parameters  : value    Lower 90%  Upper 90%
kT [keV]    : 16.1034  (  )
R^2/D10^2   : 5.27601E-02  (   )
(R is the radius in km and D10 is the distance to the source in units of 10 kpc)
------------------------------------------------------------

Energy  Fluence     90% Error
[keV]   [erg/cm2]   [erg/cm2]
15- 25  6.720e-07   3.342e-08
25- 50  2.843e-06   9.397e-08
50-150  5.166e-06   2.367e-07
15-150  8.682e-06   2.343e-07
Thermal bremsstrahlung (OTTB)

XSPEC12>/*
XSPEC12>exit
 XSPEC: quit


Spectral model: thermal bremsstrahlung
------------------------------------------------------------
Parameters  : value         Lower 90%    Upper 90%
kT [keV]    : 198.426       (-25.0213      -198.447)
Norm        : 2.58490       (-0.0611641     0.0716681)
------------------------------------------------------------

Energy  Fluence     90% Error
[keV]   [erg/cm2]   [erg/cm2]
15- 25  1.532e-06   4.080e-08
25- 50  2.946e-06   8.564e-08
50-150  6.451e-06   1.832e-07
15-150  1.093e-05   3.009e-07
Double BB

XSPEC12>/*
XSPEC12>exit
 XSPEC: quit


Spectral model: bbodyrad<1> + bbodyrad<2>
------------------------------------------------------------
Parameters  : value         Lower 90%    Upper 90%
kT1 [keV]   : 7.34980        (-0.667007      0.710838)
R1^2/D10^2  : 0.579400        (-0.157608      0.238986)
kT2 [keV]   : 27.8743        (-2.41929      3.0984)
R2^2/D10^2  : 6.07433E-03    (-0.00190131   0.00240538)
------------------------------------------------------------

Energy  Fluence     90% Error
[keV]   [erg/cm2]   [erg/cm2]
15- 25  1.438e-06   1.211e-07
25- 50  2.983e-06   1.463e-07
50-150  6.546e-06   4.413e-07
15-150  1.097e-05   5.186e-07
Peak spectrum fit
Power-law model
Time interval is from   10.180 sec. to   11.180 sec.
XSPEC12>exit
 XSPEC: quit


Spectral model in power-law:
------------------------------------------------------------
Parameters  : value       lower 90%   higher 90%
Photon index: 1.13804     ( -0.0715814   0.0712034 )
Norm@50keV  : 7.81800E-02    ( -0.00323421   0.00323324 )
------------------------------------------------------------

Photon flux (15-150 keV)    in 1 sec: 0.476923 (    ) ph/cm2/s
Energy fluence (15-150 keV)             : 8.0783e-07 ( -3.63761e-08  3.64568e-08 ) ergs/cm2
Cutoff power-law model

Time interval is from   10.180 sec. to   11.180 sec.
 XSPEC: quit


Spectral model in the cutoff power-law:
------------------------------------------------------------
Parameters  : value       lower 90%   higher 90%
Photon index: 0.772387     ( -0.306874   0.287296 )
Epeak [keV] : 190.276      ( -61.5992 427.094 )
Norm@50keV  : 0.114545    ( -0.0290724   0.0417011 )
------------------------------------------------------------

Photon flux (15-150 keV)    in 1 sec: 8.97285 ( -0.4025  0.40272 ) ph/cm2/s
Energy fluence (15-150 keV)             : 7.94877e-07 ( -3.83403e-08  3.82093e-08 ) ergs/cm2
Band function

Time interval is from   10.180 sec. to   11.180 sec.


Spectral model in the Band function:
------------------------------------------------------------
Parameters  : value       lower 90%   higher 90%
alpha       :    (     )
beta        :     (     )
Epeak [keV] :       (   )
Norm@50keV   :     (     )
------------------------------------------------------------

Photon flux (15-150 keV)    in  sec:  (    ) ph/cm2/s
Energy fluence (15-150 keV)             : 0 ( 0  0 ) ergs/cm2
Single BB

XSPEC12>exit
 XSPEC: quit


Spectral model blackbody:
------------------------------------------------------------
Parameters  : value    Lower 90%  Upper 90%
kT [keV]    : 20.1583  (  )
R^2/D10^2   : 0.420437  (   )
(R is the radius in km and D10 is the distance to the source in units of 10 kpc)
------------------------------------------------------------

Energy  Fluence     90% Error
[keV]   [erg/cm2]   [erg/cm2]
15- 25  3.283e-08   2.865e-09
25- 50  1.644e-07   1.030e-08
50-150  4.957e-07   3.545e-08
15-150  6.930e-07   3.345e-08
Thermal bremsstrahlung (OTTB)

XSPEC12>/*
XSPEC12>exit
 XSPEC: quit


Spectral model: thermal bremsstrahlung
------------------------------------------------------------
Parameters  : value         Lower 90%    Upper 90%
kT [keV]    : 199.363       (      )
Norm        : 37.7272       (     )
------------------------------------------------------------

Energy  Fluence     90% Error
[keV]   [erg/cm2]   [erg/cm2]
15- 25  9.394e-08   3.945e-09
25- 50  1.807e-07   8.300e-09
50-150  3.963e-07   1.715e-08
15-150  6.710e-07   3.135e-08
Double BB

XSPEC12>/*
XSPEC12>exit
 XSPEC: quit


Spectral model: bbodyrad<1> + bbodyrad<2>
------------------------------------------------------------
Parameters  : value         Lower 90%    Upper 90%
kT1 [keV]   : 8.68463        (-1.74917      2.03426)
R1^2/D10^2  : 3.39756        (-1.47219      3.30444)
kT2 [keV]   : 32.2667        (-4.87461      9.21134)
R2^2/D10^2  : 7.54045E-02    (-0.0425917   0.0587019)
------------------------------------------------------------

Energy  Fluence     90% Error
[keV]   [erg/cm2]   [erg/cm2]
15- 25  6.065e-08   1.200e-08
25- 50  1.727e-07   2.135e-08
50-150  5.640e-07   1.121e-07
15-150  7.974e-07   1.207e-07
Pre-slew spectrum (Pre-slew PHA with pre-slew DRM)
Power-law model

XSPEC12>exit
 XSPEC: quit


Spectral model in power-law:
------------------------------------------------------------
Parameters  : value       lower 90%   higher 90%
Photon index: 1.36768     ( -0.0533483   0.0532349 )
Norm@50keV  : 1.85042E-02    ( -0.000520878   0.00052078 )
------------------------------------------------------------

Photon flux (15-150 keV)    in 19.05 sec: 2.23750 ( -0.0692369  0.0695119 ) ph/cm2/s
Energy fluence (15-150 keV)             : 3.42942e-06 ( -1.02038e-07  1.02232e-07 ) ergs/cm2
Cutoff power-law model
 XSPEC: quit


Spectral model in the cutoff power-law:
------------------------------------------------------------
Parameters  : value       lower 90%   higher 90%
Photon index: 1.36412     ( -0.178956   0.0546549 )
Epeak [keV] : 1.00000E+04      ( -10000 -10000 )
Norm@50keV  : 1.85740E-02    ( -0.000522712   0.000521803 )
------------------------------------------------------------

Photon flux (15-150 keV)    in 19.05 sec: 2.23792 ( -0.07001  0.06797 ) ph/cm2/s
Energy fluence (15-150 keV)             : 3.42889e-06 ( -9.89838e-08  1.02337e-07 ) ergs/cm2
Band function
Spectral model in the Band function:
------------------------------------------------------------
Parameters  : value       lower 90%   higher 90%
alpha       :    (     )
beta        :     (     )
Epeak [keV] :       (   )
Norm@50keV   :     (     )
------------------------------------------------------------

Photon flux (15-150 keV)    in  sec:  (    ) ph/cm2/s
Energy fluence (15-150 keV)             : 0 ( 0  0 ) ergs/cm2
S(25-50 keV) vs. S(50-100 keV) plot

S(25-50 keV)  = 2.90e-06
S(50-100 keV) = 3.83e-06
T90 vs. Hardness ratio plot
T90                                   = 190.595999956131 sec.
Hardness ratio (energy fluence ratio) = 1.32069
Color vs. Color plot

Count Ratio  (25-50 keV) / (15-25 keV) = 1.23029
Count Ratio (50-100 keV) / (15-25 keV) = 0.899009
Mask shadow pattern
IMX = -5.537327771790653E-01, IMY = 2.362261566597713E-01
TIME vs. PHA plot around the trigger time

Blue+Cyan dotted lines: Time interval of the scaled map
From 0.000000 to 0.512000
TIME vs. DetID plot around the trigger time

Blue+Cyan dotted lines: Time interval of the scaled map
From 0.000000 to 0.512000
100 us light curve (15-350 keV)
Blue+Cyan dotted lines: Time interval of the scaled map
From 0.000000 to 0.512000
Spacecraft aspect plot

Bright source in the pre-burst/pre-slew/post-slew images
Pre-burst image of 15-350 keV band
Time interval of the image:
-239.672000 -8.820000

# RAcent  DECcent POSerr Theta    Phi  PeakCts   SNR AngSep     Name
#  [deg]    [deg]    ['] [deg]  [deg]                   [']
158.3950 -28.9222    3.5  44.2   30.4   1.9804   3.3 ------	UNKNOWN
Pre-slew background subtracted image of 15-350 keV band
Time interval of the image:
-8.820000 10.228620

# RAcent  DECcent POSerr Theta    Phi  PeakCts   SNR AngSep     Name
#  [deg]    [deg]    ['] [deg]  [deg]                   [']
157.9719 -30.4025    2.6  45.4   29.1   1.1057   4.5 ------	UNKNOWN
210.0116  27.5474    0.2  31.0 -156.9   5.5723  57.3 ------	UNKNOWN
214.8421  41.2873    2.5  44.4 -165.5   0.6891   4.7 ------	UNKNOWN
231.7206   0.8079    1.8  41.1  -99.9   2.3308   6.2 ------	UNKNOWN
Post-slew image of 15-350 keV band
Time interval of the image:
61.428590 962.400600
1772.328000 1862.424800

# RAcent  DECcent POSerr Theta    Phi  PeakCts   SNR AngSep     Name
#  [deg]    [deg]    ['] [deg]  [deg]                   [']
254.3911  35.3357    3.6  38.4 -129.0   4.5909   3.2    3.3	Her X-1
190.7315 -15.2267    3.7  46.7    9.9   5.0916   3.2 ------	UNKNOWN
218.0990  52.4126    2.5  25.6  175.6   4.9276   4.6 ------	UNKNOWN
266.9944  35.4583    3.7  48.6 -130.3  12.4742   3.2 ------	UNKNOWN
267.9977  36.5887    2.4  49.3 -131.9  20.5655   4.8 ------	UNKNOWN
Plot creation:
Mon Jun  1 00:38:29 EDT 2020