Estimated redshift from machine learning (Ukwatta et al. 2016) - may take a few minute to calcaulte
Image
Pre-slew 15.0-350.0 keV image (Event data)
#   RAcent    DECcent   POSerr    Theta     Phi              Peak Cts       SNR   Name
  295.2070    44.9327   0.0225    37.4705   -38.1741         3.6752889      8.558 TRIG_00952791

Foreground time interval of the image:
-144.312  72.901 (delta_t = 217.213 [sec])
Background time interval of the image:
-365.699 -346.468 (delta_t =  19.232 [sec])
-239.000 -144.312 (delta_t =  94.688 [sec])
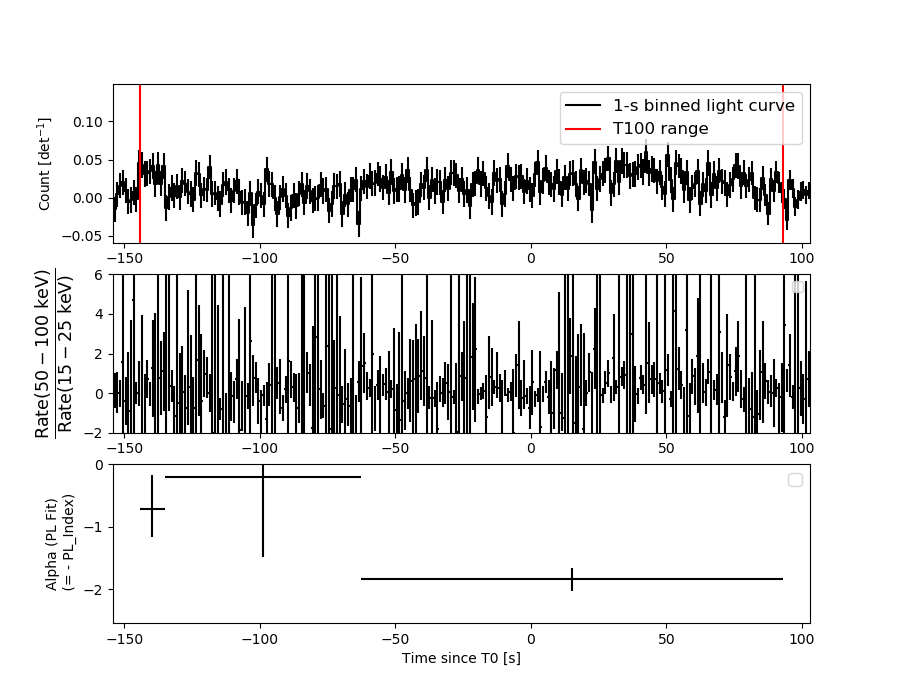
Lightcurves
Notes:
- 1) The mask-weighted light curves are using the flight position.
- 2) Multiple plots of different time binning/intervals are shown to cover all scenarios of short/long GRBs, rate/image triggers, and real/false positives.
- 3) For all the mask-weighted lightcurves, the y-axis units are counts/sec/det where a det is 0.4 x 0.4 = 0.16 sq cm.
- 4) The verticle lines correspond to following: green dotted lines are T50 interval, black dotted lines are T90 interval, blue solid line(s) is a spacecraft slew start time, and orange solid line(s) is a spacecraft slew end time.
- 5) Time of each bin is in the middle of the bin.
1 s binning
From T0-310 s to T0+310 s
From T100_start - 20 s to T100_end + 30 s

Full time interval

64 ms binning
Full time interval

From T100_start to T100_end

From T0-5 sec to T0+5 sec

16 ms binning
From T100_start-5 s to T100_start+5 s

Blue+Cyan dotted lines: Time interval of the scaled map
From 0.000000 to 64.000000
8 ms binning
From T100_start-3 s to T100_start+3 s

Blue+Cyan dotted lines: Time interval of the scaled map
From 0.000000 to 64.000000
2 ms binning
From T100_start-1 s to T100_start+1 s
Blue+Cyan dotted lines: Time interval of the scaled map
From 0.000000 to 64.000000
SN=5 or 10 sec. binning (whichever binning is satisfied first)

SN=5 or 10 sec. binning (T < 200 sec)

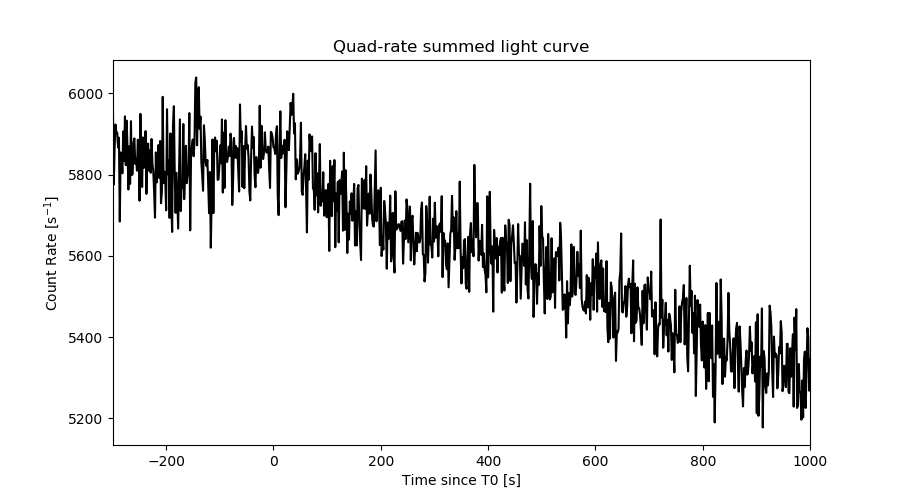
Quad-rate summed light curves (from T0-300s to T0+1000s)
Spectral Evolution
Spectra
Notes:
- 1) The fitting includes the systematic errors.
- 2) When the burst includes telescope slew time periods, the fitting uses an average response file made from multiple 5-s response files through out the slew time plus single time preiod for the non-slew times, and weighted by the total counts in the corresponding time period using addrmf. An average response file is needed becuase a spectral fit using the pre-slew DRM will introduce some errors in both a spectral shape and a normalization if the PHA file contains a lot of the slew/post-slew time interval.
- 3) For fits to more complicated models (e.g. a power-law over a cutoff power-law), the BAT team has decided to require a chi-square improvement of more than 6 for each extra dof.
Time averaged spectrum fit using the average DRM
Power-law model

Time interval is from -144.312 sec. to   92.936 sec.
XSPEC12>exit
 XSPEC: quit


Spectral model in power-law:
------------------------------------------------------------
Parameters  : value       lower 90%   higher 90%
Photon index: 1.63711     ( -0.195305   0.19912 )
Norm@50keV  : 1.06888E-03    ( -0.000124075   0.000122314 )
------------------------------------------------------------

Photon flux (15-150 keV)    in 237.2 sec: 0.138986 ( -0.015174  0.015199 ) ph/cm2/s
Energy fluence (15-150 keV)             : 2.36148e-06 ( -2.91414e-07  2.94987e-07 ) ergs/cm2
Cutoff power-law model

Time interval is from -144.312 sec. to   92.936 sec.
 XSPEC: quit


Spectral model in the cutoff power-law:
------------------------------------------------------------
Parameters  : value       lower 90%   higher 90%
Photon index: 1.63542     ( -0.638454   0.912524 )
Epeak [keV] : 1.00000E+04      ( -10000 -10000 )
Norm@50keV  : 1.07120E-03    ( -0.000124867   0.000114741 )
------------------------------------------------------------

Photon flux (15-150 keV)    in 237.2 sec: 0.139475 ( -0.017366  0.016135 ) ph/cm2/s
Energy fluence (15-150 keV)             : 2.37812e-06 ( -3.77314e-07  2.39368e-07 ) ergs/cm2
Band function

Time interval is from -144.312 sec. to   92.936 sec.


Spectral model in the Band function:
------------------------------------------------------------
Parameters  : value       lower 90%   higher 90%
alpha       :    (     )
beta        :     (     )
Epeak [keV] :       (   )
Norm@50keV   :     (     )
------------------------------------------------------------

Photon flux (15-150 keV)    in  sec:  (    ) ph/cm2/s
Energy fluence (15-150 keV)             : 0 ( 0  0 ) ergs/cm2
Single BB

XSPEC12>exit
 XSPEC: quit


Spectral model blackbody:
------------------------------------------------------------
Parameters  : value    Lower 90%  Upper 90%
kT [keV]    : 13.1322  (-1.9907  2.39026)
R^2/D10^2   : 2.38327E-02  (-0.0107111   0.0194338)
(R is the radius in km and D10 is the distance to the source in units of 10 kpc)
------------------------------------------------------------

Energy  Fluence     90% Error
[keV]   [erg/cm2]   [erg/cm2]
15- 25  2.067e-07   4.513e-08
25- 50  7.198e-07   1.140e-07
50-150  7.894e-07   1.974e-07
15-150  1.716e-06   2.706e-07
Thermal bremsstrahlung (OTTB)

XSPEC12>/*
XSPEC12>exit
 XSPEC: quit


Spectral model: thermal bremsstrahlung
------------------------------------------------------------
Parameters  : value         Lower 90%    Upper 90%
kT [keV]    : 163.252       (-66.7474      -163.626)
Norm        : 0.566033       (-0.0667063     0.0778279)
------------------------------------------------------------

Energy  Fluence     90% Error
[keV]   [erg/cm2]   [erg/cm2]
15- 25  3.422e-07   1.785e-07
25- 50  6.418e-07   3.447e-07
50-150  1.310e-06   7.443e-07
15-150  2.294e-06   1.271e-06
Double BB

XSPEC12>/*
XSPEC12>exit
 XSPEC: quit


Spectral model: bbodyrad<1> + bbodyrad<2>
------------------------------------------------------------
Parameters  : value         Lower 90%    Upper 90%
kT1 [keV]   : 6.48431        (-1.59016      1.91227)
R1^2/D10^2  : 0.224370        (-0.133162      0.418339)
kT2 [keV]   : 28.0060        (-7.87647      20.8192)
R2^2/D10^2  : 1.30275E-03    (-0.00105859   0.00287072)
------------------------------------------------------------

Energy  Fluence     90% Error
[keV]   [erg/cm2]   [erg/cm2]
15- 25  3.692e-07   1.779e-07
25- 50  6.242e-07   2.585e-07
50-150  1.391e-06   7.495e-07
15-150  2.384e-06   9.572e-07
Peak spectrum fit
Power-law model

Time interval is from   41.844 sec. to   42.844 sec.
XSPEC12>exit
 XSPEC: quit


Spectral model in power-law:
------------------------------------------------------------
Parameters  : value       lower 90%   higher 90%
Photon index: 1.30920     ( -0.493775   0.485391 )
Norm@50keV  : 5.73765E-03    ( -0.0018173   0.00181728 )
------------------------------------------------------------

Photon flux (15-150 keV)    in 1 sec: 0.685393 ( -0.222695  0.226143 ) ph/cm2/s
Energy fluence (15-150 keV)             : 5.66096e-08 ( -1.88393e-08  1.92499e-08 ) ergs/cm2
Cutoff power-law model

Time interval is from   41.844 sec. to   42.844 sec.
 XSPEC: quit


Spectral model in the cutoff power-law:
------------------------------------------------------------
Parameters  : value       lower 90%   higher 90%
Photon index: -1.51040     ( -5.11519   2.36325 )
Epeak [keV] : 65.2321      ( -18.6144 71.9345 )
Norm@50keV  : 0.123562    ( -0.123069   50.5871 )
------------------------------------------------------------

Photon flux (15-150 keV)    in 1 sec: 0.621415 ( -0.21221  0.226551 ) ph/cm2/s
Energy fluence (15-150 keV)             : 4.95256e-08 ( -1.83554e-08  1.9924e-08 ) ergs/cm2
Band function

Time interval is from   41.844 sec. to   42.844 sec.


Spectral model in the Band function:
------------------------------------------------------------
Parameters  : value       lower 90%   higher 90%
alpha       :    (     )
beta        :     (     )
Epeak [keV] :       (   )
Norm@50keV   :     (     )
------------------------------------------------------------

Photon flux (15-150 keV)    in  sec:  (    ) ph/cm2/s
Energy fluence (15-150 keV)             : 0 ( 0  0 ) ergs/cm2
Single BB

XSPEC12>exit
 XSPEC: quit


Spectral model blackbody:
------------------------------------------------------------
Parameters  : value    Lower 90%  Upper 90%
kT [keV]    : 16.8330  (-4.44974  6.59102)
R^2/D10^2   : 6.00454E-02  (-0.0600454   0.114652)
(R is the radius in km and D10 is the distance to the source in units of 10 kpc)
------------------------------------------------------------

Energy  Fluence     90% Error
[keV]   [erg/cm2]   [erg/cm2]
15- 25  3.474e-09   2.112e-09
25- 50  1.525e-08   9.260e-09
50-150  3.075e-08   1.965e-08
15-150  4.948e-08   2.999e-08
Thermal bremsstrahlung (OTTB)

XSPEC12>/*
XSPEC12>exit
 XSPEC: quit


Spectral model: thermal bremsstrahlung
------------------------------------------------------------
Parameters  : value         Lower 90%    Upper 90%
kT [keV]    : 199.363       (-117.475      -199.363)
Norm        : 2.91233       (-0.917511     0.917512)
------------------------------------------------------------

Energy  Fluence     90% Error
[keV]   [erg/cm2]   [erg/cm2]
15- 25  7.252e-09   4.574e-09
25- 50  1.395e-08   8.450e-09
50-150  3.059e-08   1.925e-08
15-150  5.180e-08   3.208e-08
Double BB

XSPEC12>/*
XSPEC12>exit
 XSPEC: quit


Spectral model: bbodyrad<1> + bbodyrad<2>
------------------------------------------------------------
Parameters  : value         Lower 90%    Upper 90%
kT1 [keV]   : 1.00003E-04        (4.56543e-09      -0.000100003)
R1^2/D10^2  : 7.26684E+06        (-7.26684e+06      -7.26684e+06)
kT2 [keV]   : 16.8315        (-4.44821      6.59259)
R2^2/D10^2  : 6.00638E-02    (-0.0600638   0.114633)
------------------------------------------------------------

Energy  Fluence     90% Error
[keV]   [erg/cm2]   [erg/cm2]
15- 25  3.626e-09   1.697e+03
25- 50  1.557e-08   1.728e+04
50-150  2.958e-08   3.246e+05
15-150  4.878e-08   3.380e+05
Pre-slew spectrum (Pre-slew PHA with pre-slew DRM)
Power-law model

XSPEC12>exit
 XSPEC: quit


Spectral model in power-law:
------------------------------------------------------------
Parameters  : value       lower 90%   higher 90%
Photon index: 1.65232     ( -0.205285   0.210098 )
Norm@50keV  : 1.06596E-03    ( -0.000130907   0.000128796 )
------------------------------------------------------------

Photon flux (15-150 keV)    in 217.2 sec: 0.139295 ( -0.0159366  0.0159605 ) ph/cm2/s
Energy fluence (15-150 keV)             : 2.15278e-06 ( -2.79656e-07  2.83481e-07 ) ergs/cm2
Cutoff power-law model

 XSPEC: quit


Spectral model in the cutoff power-law:
------------------------------------------------------------
Parameters  : value       lower 90%   higher 90%
Photon index: 1.65861     ( -0.211477   0.206415 )
Epeak [keV] : 9999.36      ( -9999.35 -9999.36 )
Norm@50keV  : 1.06268E-03    (     )
------------------------------------------------------------

Photon flux (15-150 keV)    in 217.2 sec: 0.139261 ( -0.016016  0.015933 ) ph/cm2/s
Energy fluence (15-150 keV)             : 2.15179e-06 ( -2.89969e-07  2.82238e-07 ) ergs/cm2
Band function

Spectral model in the Band function:
------------------------------------------------------------
Parameters  : value       lower 90%   higher 90%
alpha       :    (     )
beta        :     (     )
Epeak [keV] :       (   )
Norm@50keV   :     (     )
------------------------------------------------------------

Photon flux (15-150 keV)    in  sec:  (    ) ph/cm2/s
Energy fluence (15-150 keV)             : 0 ( 0  0 ) ergs/cm2
S(25-50 keV) vs. S(50-100 keV) plot

S(25-50 keV)  = 6.21e-07
S(50-100 keV) = 7.99e-07
T90 vs. Hardness ratio plot

T90                                   = 217.023999810219 sec.
Hardness ratio (energy fluence ratio) = 1.28663
Color vs. Color plot

Count Ratio  (25-50 keV) / (15-25 keV) = 1.30701
Count Ratio (50-100 keV) / (15-25 keV) = 0.99184
Mask shadow pattern

IMX = 6.025803937470950E-01, IMY = 4.737434617925653E-01
TIME vs. PHA plot around the trigger time

Blue+Cyan dotted lines: Time interval of the scaled map
From 0.000000 to 64.000000
TIME vs. DetID plot around the trigger time

Blue+Cyan dotted lines: Time interval of the scaled map
From 0.000000 to 64.000000
100 us light curve (15-350 keV)

Blue+Cyan dotted lines: Time interval of the scaled map
From 0.000000 to 64.000000
Spacecraft aspect plot

Bright source in the pre-burst/pre-slew/post-slew images
Pre-burst image of 15-350 keV band
Time interval of the image:
-365.699400 -346.467700
-239.000000 -144.312000

# RAcent  DECcent POSerr Theta    Phi  PeakCts   SNR AngSep     Name
#  [deg]    [deg]    ['] [deg]  [deg]                   [']
299.5170  35.3285    7.3  42.8  -51.6   0.5747   1.6    8.4	Cyg X-1
308.2042  40.9325    4.1  34.2  -54.9   0.6411   2.8    4.4	Cyg X-3
326.0422  38.4075    6.4  28.5  -79.6   0.3741   1.8    8.0	Cyg X-2
341.8536  45.8081    2.4  16.7  -99.1   0.7414   4.9 ------	UNKNOWN
 19.4724   6.6882    2.5  57.3 -160.9   3.6111   4.7 ------	UNKNOWN
272.3737  34.8817    3.0  56.3  -28.3   2.8075   3.9 ------	UNKNOWN
Pre-slew background subtracted image of 15-350 keV band
Time interval of the image:
-144.312000 72.900630

# RAcent  DECcent POSerr Theta    Phi  PeakCts   SNR AngSep     Name
#  [deg]    [deg]    ['] [deg]  [deg]                   [']
299.5698  35.0665    5.2  43.0  -51.9   1.6908   2.2    8.2	Cyg X-1
308.2785  40.9173    3.0  34.2  -55.0  -1.7098  -3.9    7.9	Cyg X-3
326.0063  38.3504    6.6  28.6  -79.6  -0.7529  -1.8    8.0	Cyg X-2
236.1860  66.5387    2.3  44.8   19.4   3.0546   5.2 ------	UNKNOWN
 17.5869  20.1191    2.2  43.8 -163.1   2.4526   5.3 ------	UNKNOWN
295.2069  44.9327    1.3  37.5  -38.2   3.6750   8.6 ------	UNKNOWN
325.3063  32.4653    2.4  34.1  -83.8   2.6723   4.8 ------	UNKNOWN
Post-slew image of 15-350 keV band
Time interval of the image:
129.500600 963.116100
965.000000 965.600600

# RAcent  DECcent POSerr Theta    Phi  PeakCts   SNR AngSep     Name
#  [deg]    [deg]    ['] [deg]  [deg]                   [']
254.4323  35.5016    4.0  32.2   12.6   1.8407   2.9    9.6	Her X-1
268.2694  -1.4465   14.4  52.2  -39.8  -2.5320  -0.8    5.9	SW J1753.5-0127
288.7689  11.0026    4.1  34.4  -63.5   2.6017   2.8    3.8	GRS 1915+105
299.4458  35.0981    5.2  10.3  -94.5   1.0999   2.2    9.4	Cyg X-1
308.0754  40.9727 1114.8  10.2 -146.6   0.0048   0.0    2.0	Cyg X-3
326.3493  38.3633    4.3  24.0 -160.0   1.5148   2.7    8.7	Cyg X-2
231.0932  27.6823    4.2  53.0   19.2   8.4410   2.7 ------	UNKNOWN
266.9269  56.9386    3.0  21.3   59.8   2.3504   3.8 ------	UNKNOWN
356.0426  42.7402    3.2  42.9  175.6   3.2376   3.6 ------	UNKNOWN
313.3523  44.4490    3.5  12.9 -169.2   1.6568   3.3 ------	UNKNOWN
256.7675  18.9898    2.6  41.0  -11.2   3.4103   4.4 ------	UNKNOWN
335.3435  18.7804    3.4  42.3 -139.9   3.4989   3.4 ------	UNKNOWN
354.3604  15.7793    3.0  57.2 -154.1  13.6089   3.9 ------	UNKNOWN
332.9147   9.5496    2.7  48.0 -129.1  10.1724   4.2 ------	UNKNOWN
Plot creation:
Mon Jun  1 00:35:08 EDT 2020