Special notes of this burst
Image
Pre-slew 15.0-350.0 keV image (Event data)
#   RAcent    DECcent   POSerr    Theta     Phi              Peak Cts       SNR   Name
  342.5947   -59.1012   0.0218    17.4796    -0.9238         0.5972333      8.872 TRIG_00957271

Foreground time interval of the image:
-15.600  15.501 (delta_t =  31.101 [sec])
Background time interval of the image:
-116.099 -15.600 (delta_t = 100.499 [sec])
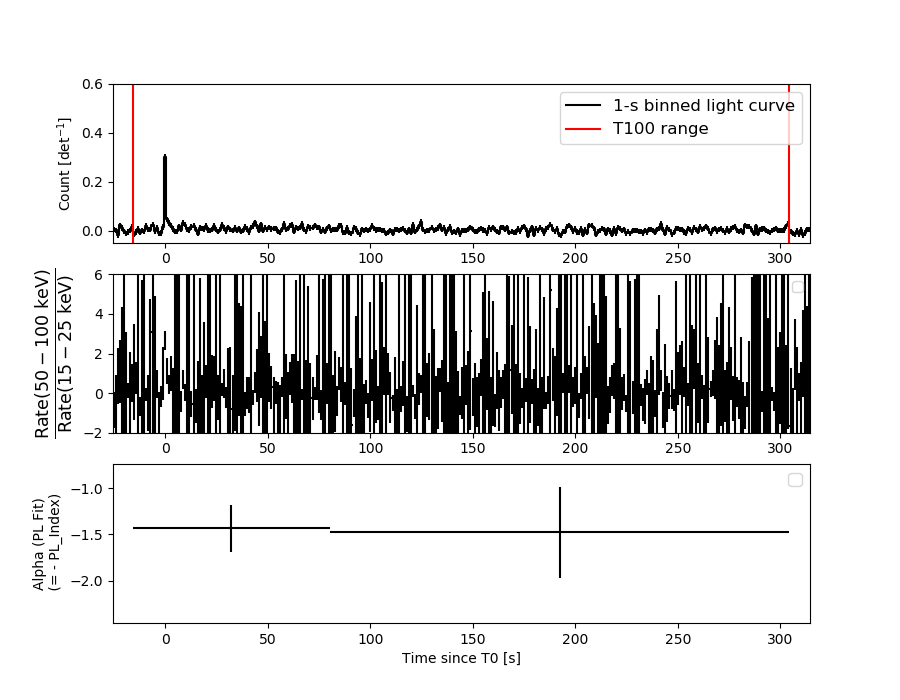
Lightcurves
Notes:
- 1) The mask-weighted light curves are using the flight position.
- 2) Multiple plots of different time binning/intervals are shown to cover all scenarios of short/long GRBs, rate/image triggers, and real/false positives.
- 3) For all the mask-weighted lightcurves, the y-axis units are counts/sec/det where a det is 0.4 x 0.4 = 0.16 sq cm.
- 4) The verticle lines correspond to following: green dotted lines are T50 interval, black dotted lines are T90 interval, blue solid line(s) is a spacecraft slew start time, and orange solid line(s) is a spacecraft slew end time.
- 5) Time of each bin is in the middle of the bin.
1 s binning
From T0-310 s to T0+310 s

From T100_start - 20 s to T100_end + 30 s

Full time interval
64 ms binning
Full time interval

From T100_start to T100_end

From T0-5 sec to T0+5 sec

16 ms binning
From T100_start-5 s to T100_start+5 s

Blue+Cyan dotted lines: Time interval of the scaled map
From 0.000000 to 0.256000
8 ms binning
From T100_start-3 s to T100_start+3 s
Blue+Cyan dotted lines: Time interval of the scaled map
From 0.000000 to 0.256000
2 ms binning
From T100_start-1 s to T100_start+1 s
Blue+Cyan dotted lines: Time interval of the scaled map
From 0.000000 to 0.256000
SN=5 or 10 sec. binning (whichever binning is satisfied first)
SN=5 or 10 sec. binning (T < 200 sec)

Quad-rate summed light curves (from T0-300s to T0+1000s)

Spectral Evolution
Spectra
Notes:
- 1) The fitting includes the systematic errors.
- 2) When the burst includes telescope slew time periods, the fitting uses an average response file made from multiple 5-s response files through out the slew time plus single time preiod for the non-slew times, and weighted by the total counts in the corresponding time period using addrmf. An average response file is needed becuase a spectral fit using the pre-slew DRM will introduce some errors in both a spectral shape and a normalization if the PHA file contains a lot of the slew/post-slew time interval.
- 3) For fits to more complicated models (e.g. a power-law over a cutoff power-law), the BAT team has decided to require a chi-square improvement of more than 6 for each extra dof.
Time averaged spectrum fit using the average DRM
Power-law model
Time interval is from  -15.600 sec. to  304.400 sec.
XSPEC12>exit
 XSPEC: quit


Spectral model in power-law:
------------------------------------------------------------
Parameters  : value       lower 90%   higher 90%
Photon index: 1.44423     ( -0.251554   0.254625 )
Norm@50keV  : 4.10939E-04    ( -6.1078e-05   6.06002e-05 )
------------------------------------------------------------

Photon flux (15-150 keV)    in 320 sec: 5.05716E-02 ( -0.0073815  0.0073931 ) ph/cm2/s
Energy fluence (15-150 keV)             : 1.25988e-06 ( -2.06465e-07  2.09721e-07 ) ergs/cm2
Cutoff power-law model

Time interval is from  -15.600 sec. to  304.400 sec.
 XSPEC: quit


Spectral model in the cutoff power-law:
------------------------------------------------------------
Parameters  : value       lower 90%   higher 90%
Photon index: 0.795898     ( -1.51618   0.923494 )
Epeak [keV] : 92.2716      ( -35.3773 -92.2445 )
Norm@50keV  : 8.74891E-04    ( -0.000512772   0.00408932 )
------------------------------------------------------------

Photon flux (15-150 keV)    in 320 sec: 4.90771E-02 ( -0.007987  0.0078622 ) ph/cm2/s
Energy fluence (15-150 keV)             : 1.19498e-06 ( -2.36329e-07  2.38165e-07 ) ergs/cm2
Band function

Time interval is from  -15.600 sec. to  304.400 sec.


Spectral model in the Band function:
------------------------------------------------------------
Parameters  : value       lower 90%   higher 90%
alpha       :    (     )
beta        :     (     )
Epeak [keV] :       (   )
Norm@50keV   :     (     )
------------------------------------------------------------

Photon flux (15-150 keV)    in  sec:  (    ) ph/cm2/s
Energy fluence (15-150 keV)             : 0 ( 0  0 ) ergs/cm2
Single BB

XSPEC12>exit
 XSPEC: quit


Spectral model blackbody:
------------------------------------------------------------
Parameters  : value    Lower 90%  Upper 90%
kT [keV]    : 14.9580  (-2.26465  2.85171)
R^2/D10^2   : 5.93928E-03  (-0.00272634   0.0046467)
(R is the radius in km and D10 is the distance to the source in units of 10 kpc)
------------------------------------------------------------

Energy  Fluence     90% Error
[keV]   [erg/cm2]   [erg/cm2]
15- 25  8.907e-08   2.283e-08
25- 50  3.530e-07   9.426e-08
50-150  5.368e-07   1.568e-07
15-150  9.789e-07   2.224e-07
Thermal bremsstrahlung (OTTB)
XSPEC12>/*
XSPEC12>exit
 XSPEC: quit


Spectral model: thermal bremsstrahlung
------------------------------------------------------------
Parameters  : value         Lower 90%    Upper 90%
kT [keV]    : 199.363       (-80.8921      -199.363)
Norm        : 0.207902       (-0.029859     0.029859)
------------------------------------------------------------

Energy  Fluence     90% Error
[keV]   [erg/cm2]   [erg/cm2]
15- 25  1.657e-07   9.411e-08
25- 50  3.187e-07   1.813e-07
50-150  6.989e-07   3.958e-07
15-150  1.183e-06   6.592e-07
Double BB
XSPEC12>/*
XSPEC12>exit
 XSPEC: quit


Spectral model: bbodyrad<1> + bbodyrad<2>
------------------------------------------------------------
Parameters  : value         Lower 90%    Upper 90%
kT1 [keV]   : 1.65072        (-1.18438      1.59001)
R1^2/D10^2  : 122.111        (-153.448      -154.322)
kT2 [keV]   : 16.2828        (-2.63287      3.5222)
R2^2/D10^2  : 4.25829E-03    (-0.00214996   0.00374123)
------------------------------------------------------------

Energy  Fluence     90% Error
[keV]   [erg/cm2]   [erg/cm2]
15- 25  1.317e-07   4.360e-08
25- 50  3.183e-07   1.005e-07
50-150  5.927e-07   1.940e-07
15-150  1.043e-06   2.720e-07
Peak spectrum fit
Power-law model
Time interval is from   -8.100 sec. to   -7.100 sec.
XSPEC12>exit
 XSPEC: quit


Spectral model in power-law:
------------------------------------------------------------
Parameters  : value       lower 90%   higher 90%
Photon index: 1.50000     ( -1.5   -1.5 )
Norm@50keV  : 0.0    ( 0   0.000803549 )
------------------------------------------------------------

Photon flux (15-150 keV)    in 1 sec: 4.47484E-09 ( -4.47484e-09  0.10162 ) ph/cm2/s
Energy fluence (15-150 keV)             : 1.00231e-30 ( 1  8.78658e-09 ) ergs/cm2
Cutoff power-law model

Time interval is from   -8.100 sec. to   -7.100 sec.
 XSPEC: quit


Spectral model in the cutoff power-law:
------------------------------------------------------------
Parameters  : value       lower 90%   higher 90%
Photon index: 1.00000     ( -1   -1 )
Epeak [keV] : 80.0000      ( -80 -80 )
Norm@50keV  : 0.0    (     )
------------------------------------------------------------

Photon flux (15-150 keV)    in 1 sec: 5.95983E-02 ( -0.0595983  0.106183 ) ph/cm2/s
Energy fluence (15-150 keV)             : 1.0074e-30 ( 1  7.97793e-09 ) ergs/cm2
Band function

Time interval is from   -8.100 sec. to   -7.100 sec.


Spectral model in the Band function:
------------------------------------------------------------
Parameters  : value       lower 90%   higher 90%
alpha       :    (     )
beta        :     (     )
Epeak [keV] :       (   )
Norm@50keV   :     (     )
------------------------------------------------------------

Photon flux (15-150 keV)    in  sec:  (    ) ph/cm2/s
Energy fluence (15-150 keV)             : 0 ( 0  0 ) ergs/cm2
Single BB
XSPEC12>exit
 XSPEC: quit


Spectral model blackbody:
------------------------------------------------------------
Parameters  : value    Lower 90%  Upper 90%
kT [keV]    : 5.00000  (-5  -5)
R^2/D10^2   : 0.0  (0   0)
(R is the radius in km and D10 is the distance to the source in units of 10 kpc)
------------------------------------------------------------

Energy  Fluence     90% Error
[keV]   [erg/cm2]   [erg/cm2]
15- 25  0.000e+00   0.000e+00
25- 50  0.000e+00   0.000e+00
50-150  0.000e+00   0.000e+00
15-150  0.000e+00   0.000e+00
Thermal bremsstrahlung (OTTB)

XSPEC12>/*
XSPEC12>exit
 XSPEC: quit


Spectral model: thermal bremsstrahlung
------------------------------------------------------------
Parameters  : value         Lower 90%    Upper 90%
kT [keV]    : 7.00000       (-7      -7)
Norm        : 0.0       (0     0)
------------------------------------------------------------

Energy  Fluence     90% Error
[keV]   [erg/cm2]   [erg/cm2]
15- 25  0.000e+00   0.000e+00
25- 50  0.000e+00   0.000e+00
50-150  0.000e+00   0.000e+00
15-150  0.000e+00   0.000e+00
Double BB
XSPEC12>/*
XSPEC12>exit
 XSPEC: quit


Spectral model: bbodyrad<1> + bbodyrad<2>
------------------------------------------------------------
Parameters  : value         Lower 90%    Upper 90%
kT1 [keV]   : 4.00000        (-4      -4)
R1^2/D10^2  : 0.0        (0      0)
kT2 [keV]   : 7.75413        (-7.82831      -7.82831)
R2^2/D10^2  : 1.63998E-02    (-0.0147932   -0.0147932)
------------------------------------------------------------

Energy  Fluence     90% Error
[keV]   [erg/cm2]   [erg/cm2]
15- 25  0.000e+00   0.000e+00
25- 50  0.000e+00   0.000e+00
50-150  0.000e+00   0.000e+00
15-150  0.000e+00   0.000e+00
Pre-slew spectrum (Pre-slew PHA with pre-slew DRM)
Power-law model
XSPEC12>exit
 XSPEC: quit


Spectral model in power-law:
------------------------------------------------------------
Parameters  : value       lower 90%   higher 90%
Photon index: 1.25433     ( -0.311591   0.301252 )
Norm@50keV  : 1.20606E-03    ( -0.000202819   0.000202795 )
------------------------------------------------------------

Photon flux (15-150 keV)    in 31.1 sec: 0.142744 ( -0.0248547  0.0249688 ) ph/cm2/s
Energy fluence (15-150 keV)             : 3.74954e-07 ( -6.96242e-08  7.05404e-08 ) ergs/cm2
Cutoff power-law model

 XSPEC: quit


Spectral model in the cutoff power-law:
------------------------------------------------------------
Parameters  : value       lower 90%   higher 90%
Photon index: 1.18901     ( -1.20185   2.75317 )
Epeak [keV] : 635.618      ( -9995.39 -9995.39 )
Norm@50keV  : 1.29931E-03    ( -0.000203699   0.00321931 )
------------------------------------------------------------

Photon flux (15-150 keV)    in 31.1 sec: 0.142795 ( -0.025158  0.024715 ) ph/cm2/s
Energy fluence (15-150 keV)             : 3.74665e-07 ( -7.46378e-08  7.03886e-08 ) ergs/cm2
Band function

Spectral model in the Band function:
------------------------------------------------------------
Parameters  : value       lower 90%   higher 90%
alpha       :    (     )
beta        :     (     )
Epeak [keV] :       (   )
Norm@50keV   :     (     )
------------------------------------------------------------

Photon flux (15-150 keV)    in  sec:  (    ) ph/cm2/s
Energy fluence (15-150 keV)             : 0 ( 0  0 ) ergs/cm2
S(25-50 keV) vs. S(50-100 keV) plot

S(25-50 keV)  = 3.03e-07
S(50-100 keV) = 4.45e-07
T90 vs. Hardness ratio plot
T90                                   = 288 sec.
Hardness ratio (energy fluence ratio) = 1.46865
Color vs. Color plot

Count Ratio  (25-50 keV) / (15-25 keV) = 1.69758
Count Ratio (50-100 keV) / (15-25 keV) = 1.14885
Mask shadow pattern

IMX = 3.148667134259973E-01, IMY = 5.077342664083662E-03
TIME vs. PHA plot around the trigger time
Blue+Cyan dotted lines: Time interval of the scaled map
From 0.000000 to 0.256000
TIME vs. DetID plot around the trigger time

Blue+Cyan dotted lines: Time interval of the scaled map
From 0.000000 to 0.256000
100 us light curve (15-350 keV)

Blue+Cyan dotted lines: Time interval of the scaled map
From 0.000000 to 0.256000
Spacecraft aspect plot
Bright source in the pre-burst/pre-slew/post-slew images
Pre-burst image of 15-350 keV band
Time interval of the image:
-116.099370 -15.600000

# RAcent  DECcent POSerr Theta    Phi  PeakCts   SNR AngSep     Name
#  [deg]    [deg]    ['] [deg]  [deg]                   [']
255.9839 -37.8465    1.2  39.8  160.5   2.4722   9.7    0.2	4U 1700-377
256.5427 -36.3191    7.0  40.6  162.7   0.4390   1.7    8.1	GX 349+2
263.1956 -24.8126    0.0  46.0  179.7  -0.0159  -0.1   10.9	GX 1+4
264.6734 -44.5274   11.8  30.5  159.6   0.1735   1.0    5.5	4U 1735-44
270.4072 -25.1816  338.2  42.2 -172.7  -0.0075  -0.0    9.1	GX 5-1
270.3988 -25.7777    5.3  41.7 -173.2   0.4648   2.2    5.6	GRS 1758-258
273.9916 -14.0713    4.7  50.4 -161.3   0.8903   2.4    2.3	GX 17+2
276.0750 -30.4165    4.1  35.1 -170.4   0.4569   2.8    8.3	H1820-303
284.9486 -24.7951    9.8  36.4 -153.9  -0.1979  -1.2    8.9	HT1900.1-2455
263.0852 -33.7369    3.6  39.0  171.6  -0.6735  -3.2    7.6	GX 354-0
 18.1480 -80.1137    2.5  31.2   48.5   0.8795   4.5 ------	UNKNOWN
333.7285 -46.6250    2.7  17.6  -47.0   0.5455   4.3 ------	UNKNOWN
264.4000 -12.0755    2.5  56.4 -170.6   2.8563   4.7 ------	UNKNOWN
295.1485  -7.9692    2.6  49.7 -133.0   3.0398   4.5 ------	UNKNOWN
Pre-slew background subtracted image of 15-350 keV band
Time interval of the image:
-15.600000 15.500590

# RAcent  DECcent POSerr Theta    Phi  PeakCts   SNR AngSep     Name
#  [deg]    [deg]    ['] [deg]  [deg]                   [']
255.8468 -37.7380    9.2  40.0  160.5   0.1501   1.2    9.2	4U 1700-377
256.5041 -36.5610    5.4  40.4  162.4   0.2606   2.1    8.9	GX 349+2
262.9388 -24.6819    5.3  46.3  179.5  -0.3300  -2.2    5.4	GX 1+4
264.8801 -44.5201    8.1  30.4  159.8  -0.1210  -1.4    7.2	4U 1735-44
270.1528 -25.1129   10.9  42.4 -173.0  -0.1148  -1.1    7.4	GX 5-1
270.4376 -25.7112   22.4  41.7 -173.1  -0.0567  -0.5    7.5	GRS 1758-258
274.1466 -14.0107    3.7  50.4 -161.1  -0.5591  -3.1    8.3	GX 17+2
275.7169 -30.3239   94.4  35.3 -170.7   0.0117   0.1   11.1	H1820-303
284.9016 -24.8373   36.2  36.3 -154.0   0.0303   0.3    8.9	HT1900.1-2455
262.8258 -33.8324   36.4  39.0  171.2   0.0344   0.3    8.1	GX 354-0
 46.2839 -54.2479    2.2  50.2   17.3   1.0545   5.2 ------	UNKNOWN
342.5943 -59.1018    1.3  17.5   -0.9   0.5988   8.9 ------	UNKNOWN
357.6837 -21.8645    2.2  49.0  -48.1   1.5445   5.2 ------	UNKNOWN
Post-slew image of 15-350 keV band
Time interval of the image:
56.700590 962.448000

# RAcent  DECcent POSerr Theta    Phi  PeakCts   SNR AngSep     Name
#  [deg]    [deg]    ['] [deg]  [deg]                   [']
255.9485 -37.8477    3.3  56.6  174.7  11.3776   3.5    1.8	4U 1700-377
264.9785 -44.5042    0.0  47.2  175.7   2.7241   1.7   10.6	4U 1735-44
276.1613 -30.3641    0.0  52.4 -163.5  -1.2591  -0.7   12.2	H1820-303
285.0631 -24.9402    5.0  52.3 -151.4   4.6301   2.3    1.9	HT1900.1-2455
262.9451 -33.9184    4.8  56.3 -177.1  -7.5956  -2.4    5.5	GX 354-0
255.2001 -38.1348    2.3  56.8  173.9  16.1175   5.1 ------	UNKNOWN
279.6192 -51.7113    3.7  35.1  177.6   2.8342   3.2 ------	UNKNOWN
264.0837 -32.5222    2.7  56.8 -175.2  12.4080   4.3 ------	UNKNOWN
299.0252 -28.8309    3.2  42.3 -139.9   4.2953   3.6 ------	UNKNOWN
303.3843 -20.1779    2.3  48.0 -129.1  14.2438   5.0 ------	UNKNOWN
Plot creation:
Mon Jun  1 00:27:50 EDT 2020