Estimated redshift from machine learning (Ukwatta et al. 2016) - may take a few minute to calcaulte
Image
Pre-slew 15.0-350.0 keV image (Event data)
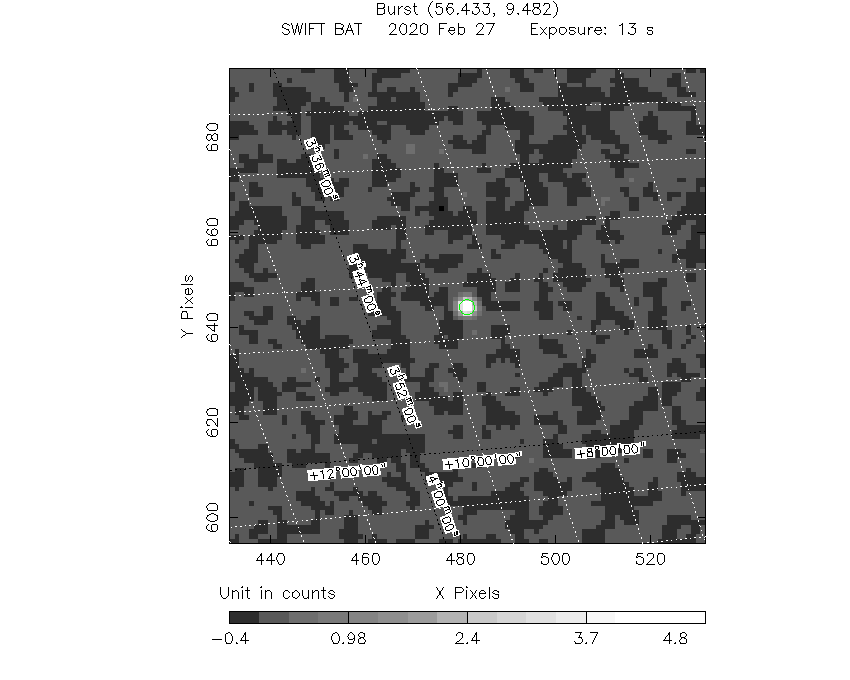
#   RAcent    DECcent   POSerr    Theta     Phi              Peak Cts       SNR   Name
   56.4329     9.4899   0.0035    42.2337   -22.8252         5.7524282     54.357 TRIG_00958592

Foreground time interval of the image:
 -0.496  12.189 (delta_t =  12.685 [sec])
Background time interval of the image:
-239.512  -0.496 (delta_t = 239.016 [sec])
Lightcurves
Notes:
- 1) The mask-weighted light curves are using the flight position.
- 2) Multiple plots of different time binning/intervals are shown to cover all scenarios of short/long GRBs, rate/image triggers, and real/false positives.
- 3) For all the mask-weighted lightcurves, the y-axis units are counts/sec/det where a det is 0.4 x 0.4 = 0.16 sq cm.
- 4) The verticle lines correspond to following: green dotted lines are T50 interval, black dotted lines are T90 interval, blue solid line(s) is a spacecraft slew start time, and orange solid line(s) is a spacecraft slew end time.
- 5) Time of each bin is in the middle of the bin.
1 s binning
From T0-310 s to T0+310 s

From T100_start - 20 s to T100_end + 30 s

Full time interval

64 ms binning
Full time interval

From T100_start to T100_end

From T0-5 sec to T0+5 sec

16 ms binning
From T100_start-5 s to T100_start+5 s

Blue+Cyan dotted lines: Time interval of the scaled map
From 0.000000 to 1.024000
8 ms binning
From T100_start-3 s to T100_start+3 s

Blue+Cyan dotted lines: Time interval of the scaled map
From 0.000000 to 1.024000
2 ms binning
From T100_start-1 s to T100_start+1 s

Blue+Cyan dotted lines: Time interval of the scaled map
From 0.000000 to 1.024000
SN=5 or 10 sec. binning (whichever binning is satisfied first)

SN=5 or 10 sec. binning (T < 200 sec)

Quad-rate summed light curves (from T0-300s to T0+1000s)

Spectral Evolution

Spectra
Notes:
- 1) The fitting includes the systematic errors.
- 2) When the burst includes telescope slew time periods, the fitting uses an average response file made from multiple 5-s response files through out the slew time plus single time preiod for the non-slew times, and weighted by the total counts in the corresponding time period using addrmf. An average response file is needed becuase a spectral fit using the pre-slew DRM will introduce some errors in both a spectral shape and a normalization if the PHA file contains a lot of the slew/post-slew time interval.
- 3) For fits to more complicated models (e.g. a power-law over a cutoff power-law), the BAT team has decided to require a chi-square improvement of more than 6 for each extra dof.
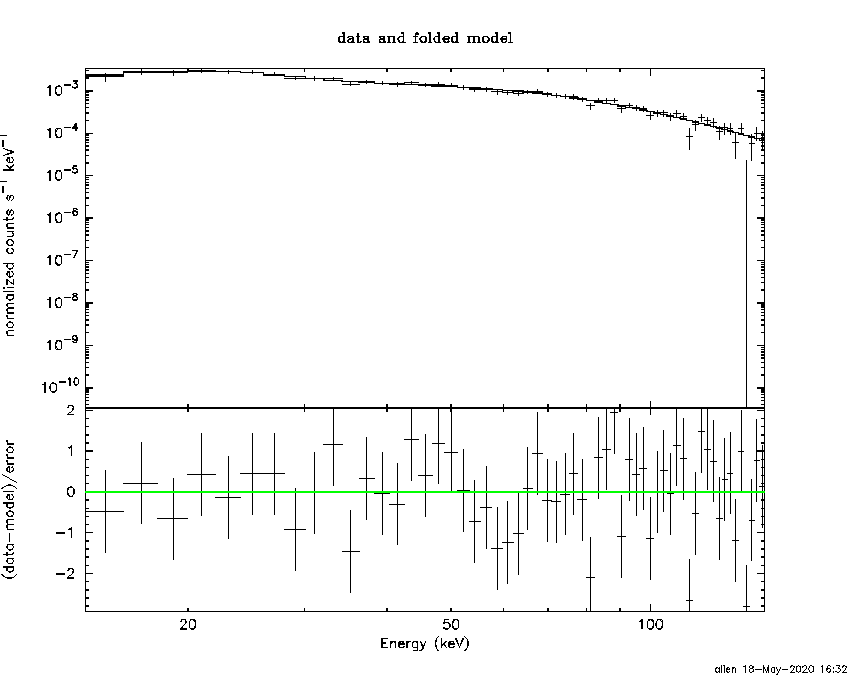
Time averaged spectrum fit using the average DRM
Power-law model

Time interval is from   -0.496 sec. to   87.732 sec.
XSPEC12>exit
 XSPEC: quit


Spectral model in power-law:
------------------------------------------------------------
Parameters  : value       lower 90%   higher 90%
Photon index: 1.44912     ( -0.0466994   0.046623 )
Norm@50keV  : 8.46144E-03    ( -0.000216413   0.00021637 )
------------------------------------------------------------

Photon flux (15-150 keV)    in 88.23 sec: 1.04255 ( -0.03014  0.03024 ) ph/cm2/s
Energy fluence (15-150 keV)             : 7.14606e-06 ( -1.87707e-07  1.87696e-07 ) ergs/cm2
Cutoff power-law model
Time interval is from   -0.496 sec. to   87.732 sec.
 XSPEC: quit


Spectral model in the cutoff power-law:
------------------------------------------------------------
Parameters  : value       lower 90%   higher 90%
Photon index: 1.16034     ( -0.195166   0.187185 )
Epeak [keV] : 166.787      ( -44.6231 185.998 )
Norm@50keV  : 1.13510E-02    ( -0.00192299   0.00241714 )
------------------------------------------------------------

Photon flux (15-150 keV)    in 88.23 sec: 1.02148 ( -0.032686  0.03283 ) ph/cm2/s
Energy fluence (15-150 keV)             : 7.04493e-06 ( -1.99882e-07  1.99203e-07 ) ergs/cm2
Band function

Time interval is from   -0.496 sec. to   87.732 sec.


Spectral model in the Band function:
------------------------------------------------------------
Parameters  : value       lower 90%   higher 90%
alpha       :    (     )
beta        :     (     )
Epeak [keV] :       (   )
Norm@50keV   :     (     )
------------------------------------------------------------

Photon flux (15-150 keV)    in  sec:  (    ) ph/cm2/s
Energy fluence (15-150 keV)             : 0 ( 0  0 ) ergs/cm2
Single BB

XSPEC12>exit
 XSPEC: quit


Spectral model blackbody:
------------------------------------------------------------
Parameters  : value    Lower 90%  Upper 90%
kT [keV]    : 18.0660  (  )
R^2/D10^2   : 6.15171E-02  (   )
(R is the radius in km and D10 is the distance to the source in units of 10 kpc)
------------------------------------------------------------

Energy  Fluence     90% Error
[keV]   [erg/cm2]   [erg/cm2]
15- 25  3.543e-07   1.945e-08
25- 50  1.643e-06   5.956e-08
50-150  3.896e-06   1.676e-07
15-150  5.893e-06   1.637e-07
Thermal bremsstrahlung (OTTB)

XSPEC12>/*
XSPEC12>exit
 XSPEC: quit


Spectral model: thermal bremsstrahlung
------------------------------------------------------------
Parameters  : value         Lower 90%    Upper 90%
kT [keV]    : 200.000       (-5.24382      -200)
Norm        : 4.35598       (-0.111247     0.111247)
------------------------------------------------------------

Energy  Fluence     90% Error
[keV]   [erg/cm2]   [erg/cm2]
15- 25  9.573e-07   2.691e-08
25- 50  1.842e-06   5.382e-08
50-150  4.039e-06   1.143e-07
15-150  6.838e-06   1.932e-07
Double BB

XSPEC12>/*
XSPEC12>exit
 XSPEC: quit


Spectral model: bbodyrad<1> + bbodyrad<2>
------------------------------------------------------------
Parameters  : value         Lower 90%    Upper 90%
kT1 [keV]   : 7.98694        (-0.809703      0.864584)
R1^2/D10^2  : 0.627136        (-0.177005      0.273838)
kT2 [keV]   : 29.3108        (-2.5582      3.3552)
R2^2/D10^2  : 9.30076E-03    (-0.00299565   0.00372736)
------------------------------------------------------------

Energy  Fluence     90% Error
[keV]   [erg/cm2]   [erg/cm2]
15- 25  7.494e-07   6.154e-08
25- 50  1.796e-06   9.529e-08
50-150  4.474e-06   3.450e-07
15-150  7.020e-06   3.931e-07
Peak spectrum fit
Power-law model

Time interval is from    8.544 sec. to    9.544 sec.
XSPEC12>exit
 XSPEC: quit


Spectral model in power-law:
------------------------------------------------------------
Parameters  : value       lower 90%   higher 90%
Photon index: 1.24552     ( -0.112096   0.111678 )
Norm@50keV  : 4.76973E-02    ( -0.00306929   0.0030685 )
------------------------------------------------------------

Photon flux (15-150 keV)    in 1 sec: 5.63726 ( -0.38047  0.38139 ) ph/cm2/s
Energy fluence (15-150 keV)             : 4.77969e-07 ( -3.31944e-08  3.33006e-08 ) ergs/cm2
Cutoff power-law model

Time interval is from    8.544 sec. to    9.544 sec.
 XSPEC: quit


Spectral model in the cutoff power-law:
------------------------------------------------------------
Parameters  : value       lower 90%   higher 90%
Photon index: 1.14502     ( -0.446119   0.156135 )
Epeak [keV] : 489.958      ( -489.939 -489.939 )
Norm@50keV  : 5.29438E-02    ( -0.0133553   0.0297316 )
------------------------------------------------------------

Photon flux (15-150 keV)    in 1 sec: 5.61476 ( -0.39136  0.39148 ) ph/cm2/s
Energy fluence (15-150 keV)             : 4.76508e-07 ( -3.394e-08  3.28698e-08 ) ergs/cm2
Band function

Time interval is from    8.544 sec. to    9.544 sec.


Spectral model in the Band function:
------------------------------------------------------------
Parameters  : value       lower 90%   higher 90%
alpha       :    (     )
beta        :     (     )
Epeak [keV] :       (   )
Norm@50keV   :     (     )
------------------------------------------------------------

Photon flux (15-150 keV)    in  sec:  (    ) ph/cm2/s
Energy fluence (15-150 keV)             : 0 ( 0  0 ) ergs/cm2
Single BB

XSPEC12>exit
 XSPEC: quit


Spectral model blackbody:
------------------------------------------------------------
Parameters  : value    Lower 90%  Upper 90%
kT [keV]    : 20.3165  (-1.68616  1.8696)
R^2/D10^2   : 0.245687  (-0.0620378   0.0815936)
(R is the radius in km and D10 is the distance to the source in units of 10 kpc)
------------------------------------------------------------

Energy  Fluence     90% Error
[keV]   [erg/cm2]   [erg/cm2]
15- 25  1.943e-08   2.555e-09
25- 50  9.777e-08   1.036e-08
50-150  2.998e-07   3.015e-08
15-150  4.170e-07   3.250e-08
Thermal bremsstrahlung (OTTB)

XSPEC12>/*
XSPEC12>exit
 XSPEC: quit


Spectral model: thermal bremsstrahlung
------------------------------------------------------------
Parameters  : value         Lower 90%    Upper 90%
kT [keV]    : 200.000       (-12.9439      -200)
Norm        : 23.5881       (-1.54455     1.54455)
------------------------------------------------------------

Energy  Fluence     90% Error
[keV]   [erg/cm2]   [erg/cm2]
15- 25  5.872e-08   4.425e-09
25- 50  1.130e-07   9.600e-09
50-150  2.478e-07   5.945e-08
15-150  4.195e-07   6.225e-08
Double BB

XSPEC12>/*
XSPEC12>exit
 XSPEC: quit


Spectral model: bbodyrad<1> + bbodyrad<2>
------------------------------------------------------------
Parameters  : value         Lower 90%    Upper 90%
kT1 [keV]   : 6.04722        (-1.3506      1.77439)
R1^2/D10^2  : 8.06018        (-4.84809      14.1717)
kT2 [keV]   : 28.1082        (-3.67784      5.60172)
R2^2/D10^2  : 7.45424E-02    (-0.0343064   0.0462152)
------------------------------------------------------------

Energy  Fluence     90% Error
[keV]   [erg/cm2]   [erg/cm2]
15- 25  4.919e-08   1.835e-08
25- 50  9.765e-08   2.120e-08
50-150  3.319e-07   5.145e-08
15-150  4.788e-07   7.660e-08
Pre-slew spectrum (Pre-slew PHA with pre-slew DRM)
Power-law model

XSPEC12>exit
 XSPEC: quit


Spectral model in power-law:
------------------------------------------------------------
Parameters  : value       lower 90%   higher 90%
Photon index: 1.27995     ( -0.0467772   0.0465967 )
Norm@50keV  : 3.15013E-02    ( -0.00085613   0.000855545 )
------------------------------------------------------------

Photon flux (15-150 keV)    in 12.68 sec: 3.74465 ( -0.110652  0.110887 ) ph/cm2/s
Energy fluence (15-150 keV)             : 3.96682e-06 ( -1.10448e-07  1.10517e-07 ) ergs/cm2
Cutoff power-law model

 XSPEC: quit


Spectral model in the cutoff power-law:
------------------------------------------------------------
Parameters  : value       lower 90%   higher 90%
Photon index: 0.757001     ( -0.207025   0.198244 )
Epeak [keV] : 139.898      ( -23.5922 48.3175 )
Norm@50keV  : 5.30921E-02    ( -0.00929516   0.011755 )
------------------------------------------------------------

Photon flux (15-150 keV)    in 12.68 sec: 3.63980 ( -0.11601  0.1164 ) ph/cm2/s
Energy fluence (15-150 keV)             : 3.89816e-06 ( -1.15426e-07  1.14995e-07 ) ergs/cm2
Band function

Spectral model in the Band function:
------------------------------------------------------------
Parameters  : value       lower 90%   higher 90%
alpha       :    (     )
beta        :     (     )
Epeak [keV] :       (   )
Norm@50keV   :     (     )
------------------------------------------------------------

Photon flux (15-150 keV)    in  sec:  (    ) ph/cm2/s
Energy fluence (15-150 keV)             : 0 ( 0  0 ) ergs/cm2
S(25-50 keV) vs. S(50-100 keV) plot

S(25-50 keV)  = 1.72e-06
S(50-100 keV) = 2.52e-06
T90 vs. Hardness ratio plot

T90                                   = 30.3279999494553 sec.
Hardness ratio (energy fluence ratio) = 1.46512
Color vs. Color plot

Count Ratio  (25-50 keV) / (15-25 keV) = 1.59948
Count Ratio (50-100 keV) / (15-25 keV) = 1.34562
Mask shadow pattern

IMX = 8.367282578017127E-01, IMY = 3.521618226826512E-01
TIME vs. PHA plot around the trigger time

Blue+Cyan dotted lines: Time interval of the scaled map
From 0.000000 to 1.024000
TIME vs. DetID plot around the trigger time

Blue+Cyan dotted lines: Time interval of the scaled map
From 0.000000 to 1.024000
100 us light curve (15-350 keV)

Blue+Cyan dotted lines: Time interval of the scaled map
From 0.000000 to 1.024000
Spacecraft aspect plot

Bright source in the pre-burst/pre-slew/post-slew images
Pre-burst image of 15-350 keV band
Time interval of the image:
-239.512000 -0.496000

# RAcent  DECcent POSerr Theta    Phi  PeakCts   SNR AngSep     Name
#  [deg]    [deg]    ['] [deg]  [deg]                   [']
 83.6278  22.0228    0.8  47.6   18.0   8.7800  15.3    0.6	Crab
135.5599 -40.4912    4.6  47.5  137.0   2.6648   2.5    4.1	Vela X-1
114.5740  -0.2997    2.3  41.2   72.0   4.7828   5.1 ------	UNKNOWN
108.8312 -19.8679    3.2  26.4   98.0   1.3134   3.5 ------	UNKNOWN
Pre-slew background subtracted image of 15-350 keV band
Time interval of the image:
-0.496000 12.188600

# RAcent  DECcent POSerr Theta    Phi  PeakCts   SNR AngSep     Name
#  [deg]    [deg]    ['] [deg]  [deg]                   [']
 83.7605  22.0082    6.4  47.6   18.1  -0.2985  -1.8    7.1	Crab
135.4717 -40.3836    6.8  47.5  136.9  -0.4467  -1.7   10.6	Vela X-1
101.2947  12.4514    2.9  42.9   44.6   0.6398   4.0 ------	UNKNOWN
 59.4592  21.3000    2.4  51.1  -11.4   0.7304   4.8 ------	UNKNOWN
 56.4330   9.4899    0.2  42.2  -22.8   5.7514  54.3 ------	UNKNOWN
Post-slew image of 15-350 keV band
Time interval of the image:
71.388600 962.557200

# RAcent  DECcent POSerr Theta    Phi  PeakCts   SNR AngSep     Name
#  [deg]    [deg]    ['] [deg]  [deg]                   [']
 83.6453  22.0246    0.4  29.0   72.1  34.4727  29.2    0.9	Crab
 42.2419 -45.5017    3.6  56.5 -157.1  14.3821   3.2 ------	UNKNOWN
 34.7670 -27.2918    3.6  42.4 -139.9   4.6566   3.2 ------	UNKNOWN
 24.1345 -26.8574    2.5  48.0 -129.1  17.5300   4.7 ------	UNKNOWN
Plot creation:
Mon Jun  1 00:24:33 EDT 2020