Estimated redshift from machine learning (Ukwatta et al. 2016) - may take a few minute to calcaulte
Image
Pre-slew 15.0-350.0 keV image (Event data)

#   RAcent    DECcent   POSerr    Theta     Phi              Peak Cts       SNR   Name
   60.5556   -50.2446   0.0263    19.5270   -69.3260         0.4516108      7.354 TRIG_00965484

Foreground time interval of the image:
 -0.512  16.789 (delta_t =  17.301 [sec])
Background time interval of the image:
-239.512  -0.512 (delta_t = 239.000 [sec])
Lightcurves
Notes:
- 1) The mask-weighted light curves are using the flight position.
- 2) Multiple plots of different time binning/intervals are shown to cover all scenarios of short/long GRBs, rate/image triggers, and real/false positives.
- 3) For all the mask-weighted lightcurves, the y-axis units are counts/sec/det where a det is 0.4 x 0.4 = 0.16 sq cm.
- 4) The verticle lines correspond to following: green dotted lines are T50 interval, black dotted lines are T90 interval, blue solid line(s) is a spacecraft slew start time, and orange solid line(s) is a spacecraft slew end time.
- 5) Time of each bin is in the middle of the bin.
1 s binning
From T0-310 s to T0+310 s
From T100_start - 20 s to T100_end + 30 s

Full time interval

64 ms binning
Full time interval
From T100_start to T100_end
From T0-5 sec to T0+5 sec
16 ms binning
From T100_start-5 s to T100_start+5 s

Blue+Cyan dotted lines: Time interval of the scaled map
From 0.000000 to 0.512000
8 ms binning
From T100_start-3 s to T100_start+3 s

Blue+Cyan dotted lines: Time interval of the scaled map
From 0.000000 to 0.512000
2 ms binning
From T100_start-1 s to T100_start+1 s
Blue+Cyan dotted lines: Time interval of the scaled map
From 0.000000 to 0.512000
SN=5 or 10 sec. binning (whichever binning is satisfied first)
SN=5 or 10 sec. binning (T < 200 sec)
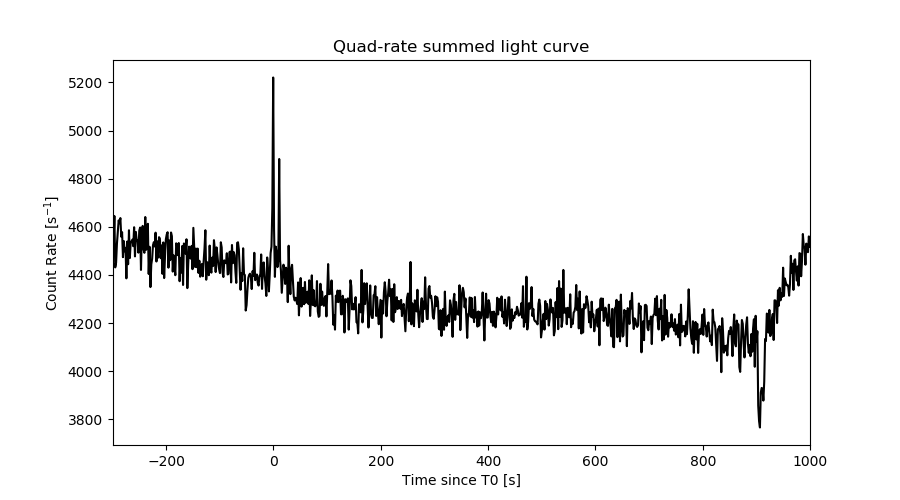
Quad-rate summed light curves (from T0-300s to T0+1000s)
Spectral Evolution

Spectra
Notes:
- 1) The fitting includes the systematic errors.
- 2) When the burst includes telescope slew time periods, the fitting uses an average response file made from multiple 5-s response files through out the slew time plus single time preiod for the non-slew times, and weighted by the total counts in the corresponding time period using addrmf. An average response file is needed becuase a spectral fit using the pre-slew DRM will introduce some errors in both a spectral shape and a normalization if the PHA file contains a lot of the slew/post-slew time interval.
- 3) For fits to more complicated models (e.g. a power-law over a cutoff power-law), the BAT team has decided to require a chi-square improvement of more than 6 for each extra dof.
Time averaged spectrum fit using the average DRM
Power-law model

Time interval is from   -0.512 sec. to   19.488 sec.

Spectral model in power-law:
------------------------------------------------------------
Parameters  : value       lower 90%   higher 90%
Photon index: 2.11733     ( -0.418263   0.481696 )
Norm@50keV  : 1.23946E-03    ( -0.000397747   0.000378088 )
------------------------------------------------------------
#Fit statistic  : Chi-Squared                   43.65     using 59 bins.
 Reduced chi-squared = 0.765789
# Null hypothesis probability of 9.03e-01 with 57 degrees of freedom

Photon flux (15-150 keV)    in 20 sec: 0.196701 ( -0.039995  0.040024 ) ph/cm2/s
Energy fluence (15-150 keV)             : 2.30766e-07 ( -6.22156e-08  6.6695e-08 ) ergs/cm2
Cutoff power-law model

Time interval is from   -0.512 sec. to   19.488 sec.
Spectral model in the cutoff power-law:
------------------------------------------------------------
Parameters  : value       lower 90%   higher 90%
Photon index: 2.57162     ( -1.282   0.244805 )
Epeak [keV] : 198.699      (   )
Norm@50keV  : 7.10627E-04    (     )
------------------------------------------------------------
#Fit statistic  : Chi-Squared                   42.81     using 59 bins.
 Reduced chi-squared = 0.764464
# Null hypothesis probability of 9.03e-01 with 56 degrees of freedom

Photon flux (15-150 keV)    in 20 sec: 0.156090 ( -0.0565071  0.074096 ) ph/cm2/s
Energy fluence (15-150 keV)             : 1.82448e-07 ( -1.10558e-07  1.82776e-07 ) ergs/cm2
Band function

Time interval is from   -0.512 sec. to   19.488 sec.


Spectral model in the Band function:
------------------------------------------------------------
Parameters  : value       lower 90%   higher 90%
alpha       :    (     )
beta        :     (     )
Epeak [keV] :       (   )
Norm@50keV   :     (     )
------------------------------------------------------------

Photon flux (15-150 keV)    in  sec:  (    ) ph/cm2/s
Energy fluence (15-150 keV)             : 0 ( 0  0 ) ergs/cm2
Single BB

Spectral model blackbody:
------------------------------------------------------------
Parameters  : value    Lower 90%  Upper 90%
kT [keV]    : 7.16181  (-1.64692  2.14126)
R^2/D10^2   : 0.327473  (-0.212138   0.623559)
(R is the radius in km and D10 is the distance to the source in units of 10 kpc)
------------------------------------------------------------
#Fit statistic  : Chi-Squared                   49.90     using 59 bins.
 Reduced chi-squared =
# Null hypothesis probability of 7.36e-01 with 57 degrees of freedom

Energy  Fluence     90% Error
[keV]   [erg/cm2]   [erg/cm2]
15- 25  5.523e-08   2.452e-08
25- 50  7.903e-08   3.826e-08
50-150  1.421e-08   1.033e-08
15-150  1.485e-07   6.709e-08
Thermal bremsstrahlung (OTTB)

Spectral model: thermal bremsstrahlung
------------------------------------------------------------
Parameters  : value         Lower 90%    Upper 90%
kT [keV]    : 47.4466       (-23.318      78.2451)
Norm        : 1.13420       (-0.385763     0.723724)
------------------------------------------------------------
#Fit statistic  : Chi-Squared                   45.42     using 59 bins.
 Reduced chi-squared =
# Null hypothesis probability of 8.65e-01 with 57 degrees of freedom

Energy  Fluence     90% Error
[keV]   [erg/cm2]   [erg/cm2]
15- 25  5.477e-08   1.676e-08
25- 50  7.717e-08   2.846e-08
50-150  7.125e-08   4.530e-08
15-150  2.032e-07   8.078e-08
Double BB

Spectral model: bbodyrad<1> + bbodyrad<2>
------------------------------------------------------------
Parameters  : value         Lower 90%    Upper 90%
kT1 [keV]   : 5.99318        (-1.57399      1.85233)
R1^2/D10^2  : 0.620265        (-0.447855      1.4107)
kT2 [keV]   : 77.5699        (-75.6965      -98.5808)
R2^2/D10^2  : 1.11358E-04    (-6.38871e-05   0.00249238)
------------------------------------------------------------
#Fit statistic  : Chi-Squared                   40.54     using 59 bins.
 Reduced chi-squared =
# Null hypothesis probability of 9.27e-01 with 55 degrees of freedom

Energy  Fluence     90% Error
[keV]   [erg/cm2]   [erg/cm2]
15- 25  6.013e-08   3.459e-08
25- 50  6.677e-08   3.875e-08
50-150  1.423e-07   9.577e-08
15-150  2.692e-07   1.424e-07
Peak spectrum fit
Power-law model

Time interval is from   -0.512 sec. to    0.488 sec.

Spectral model in power-law:
------------------------------------------------------------
Parameters  : value       lower 90%   higher 90%
Photon index: 1.48238     ( -0.431521   0.445604 )
Norm@50keV  : 5.75025E-03    ( -0.00160642   0.00158344 )
------------------------------------------------------------
#Fit statistic  : Chi-Squared                   44.77     using 59 bins.
 Reduced chi-squared = 0.785439
# Null hypothesis probability of 8.80e-01 with 57 degrees of freedom

Photon flux (15-150 keV)    in 1 sec: 0.714538 ( -0.191964  0.19232 ) ph/cm2/s
Energy fluence (15-150 keV)             : 5.47142e-08 ( -1.63603e-08  1.68556e-08 ) ergs/cm2
Cutoff power-law model

Time interval is from   -0.512 sec. to    0.488 sec.
Spectral model in the cutoff power-law:
------------------------------------------------------------
Parameters  : value       lower 90%   higher 90%
Photon index: 0.265333     ( -2.68119   1.51817 )
Epeak [keV] : 68.7967      ( -23.6805 -68.7967 )
Norm@50keV  : 2.47084E-02    ( -0.0247084   0.52205 )
------------------------------------------------------------
#Fit statistic  : Chi-Squared                   43.36     using 59 bins.
 Reduced chi-squared = 0.774286
# Null hypothesis probability of 8.91e-01 with 56 degrees of freedom

Photon flux (15-150 keV)    in 1 sec: 0.687666 ( -0.196083  0.19642 ) ph/cm2/s
Energy fluence (15-150 keV)             : 5.03002e-08 ( -1.66095e-08  1.80359e-08 ) ergs/cm2
Band function

Time interval is from   -0.512 sec. to    0.488 sec.


Spectral model in the Band function:
------------------------------------------------------------
Parameters  : value       lower 90%   higher 90%
alpha       :    (     )
beta        :     (     )
Epeak [keV] :       (   )
Norm@50keV   :     (     )
------------------------------------------------------------

Photon flux (15-150 keV)    in  sec:  (    ) ph/cm2/s
Energy fluence (15-150 keV)             : 0 ( 0  0 ) ergs/cm2
Single BB
Spectral model blackbody:
------------------------------------------------------------
Parameters  : value    Lower 90%  Upper 90%
kT [keV]    : 14.8569  (-4.07297  5.58234)
R^2/D10^2   : 8.82116E-02  (-0.0594967   0.180993)
(R is the radius in km and D10 is the distance to the source in units of 10 kpc)
------------------------------------------------------------
#Fit statistic  : Chi-Squared                   44.75     using 59 bins.
 Reduced chi-squared =
# Null hypothesis probability of 8.81e-01 with 57 degrees of freedom

Energy  Fluence     90% Error
[keV]   [erg/cm2]   [erg/cm2]
15- 25  4.083e-09   2.501e-09
25- 50  1.608e-08   9.795e-09
50-150  2.405e-08   1.500e-08
15-150  4.421e-08   2.199e-08
Thermal bremsstrahlung (OTTB)
Spectral model: thermal bremsstrahlung
------------------------------------------------------------
Parameters  : value         Lower 90%    Upper 90%
kT [keV]    : 199.363       (-199.363      -199.363)
Norm        : 2.95313       (-0.780975     0.930354)
------------------------------------------------------------
#Fit statistic  : Chi-Squared                   44.19     using 59 bins.
 Reduced chi-squared =
# Null hypothesis probability of 8.93e-01 with 57 degrees of freedom

Energy  Fluence     90% Error
[keV]   [erg/cm2]   [erg/cm2]
15- 25  7.354e-09   4.288e-09
25- 50  1.415e-08   8.595e-09
50-150  3.102e-08   1.880e-08
15-150  5.252e-08   3.096e-08
Double BB

Spectral model: bbodyrad<1> + bbodyrad<2>
------------------------------------------------------------
Parameters  : value         Lower 90%    Upper 90%
kT1 [keV]   : 6.05350        (-6.09119      -6.09119)
R1^2/D10^2  : 0.883465        (-0.880581      -0.880581)
kT2 [keV]   : 19.3354        (-19.3754      -19.3754)
R2^2/D10^2  : 2.91864E-02    (-0.0290833   0.141889)
------------------------------------------------------------
#Fit statistic  : Chi-Squared                   43.02     using 59 bins.
 Reduced chi-squared =
# Null hypothesis probability of 8.79e-01 with 55 degrees of freedom

Energy  Fluence     90% Error
[keV]   [erg/cm2]   [erg/cm2]
15- 25  6.487e-09   3.746e-09
25- 50  1.480e-08   7.515e-09
50-150  2.902e-08   1.800e-08
15-150  5.031e-08   2.860e-08
Pre-slew spectrum (Pre-slew PHA with pre-slew DRM)
Power-law model

Spectral model in power-law:
------------------------------------------------------------
Parameters  : value       lower 90%   higher 90%
Photon index: 2.11846     ( -0.401217   0.461112 )
Norm@50keV  : 1.35807E-03    ( -0.00042231   0.00040363 )
------------------------------------------------------------
#Fit statistic  : Chi-Squared                   41.91     using 59 bins.
 Reduced chi-squared =
# Null hypothesis probability of 9.33e-01 with 57 degrees of freedom

Photon flux (15-150 keV)    in 17.3 sec: 0.215627 ( -0.0431665  0.0431883 ) ph/cm2/s
Energy fluence (15-150 keV)             : 2.18696e-07 ( -5.74194e-08  6.14781e-08 ) ergs/cm2
Cutoff power-law model

Spectral model in the cutoff power-law:
------------------------------------------------------------
Parameters  : value       lower 90%   higher 90%
Photon index: 2.42333     ( -1.85111   0.198314 )
Epeak [keV] : 157.631      (   )
Norm@50keV  : 9.23034E-04    (     )
------------------------------------------------------------
#Fit statistic  : Chi-Squared                   41.53     using 59 bins.
 Reduced chi-squared =
# Null hypothesis probability of 9.25e-01 with 56 degrees of freedom

Photon flux (15-150 keV)    in 17.3 sec: 0.215244 ( -0.042922  0.043122 ) ph/cm2/s
Energy fluence (15-150 keV)             : 2.18881e-07 ( -6.69588e-08  5.95328e-08 ) ergs/cm2
Band function

Spectral model in the Band function:
------------------------------------------------------------
Parameters  : value       lower 90%   higher 90%
alpha       :    (     )
beta        :     (     )
Epeak [keV] :       (   )
Norm@50keV   :     (     )
------------------------------------------------------------

Photon flux (15-150 keV)    in  sec:  (    ) ph/cm2/s
Energy fluence (15-150 keV)             : 0 ( 0  0 ) ergs/cm2
S(25-50 keV) vs. S(50-100 keV) plot
S(25-50 keV)  = 7.18e-08
S(50-100 keV) = 6.62e-08
T90 vs. Hardness ratio plot
T90                                   = 16 sec.
Hardness ratio (energy fluence ratio) = 0.922006
Color vs. Color plot

Count Ratio  (25-50 keV) / (15-25 keV) = 0.725094
Count Ratio (50-100 keV) / (15-25 keV) = 0.304899
Mask shadow pattern

IMX = 1.252090946347269E-01, IMY = 3.318117338568732E-01
TIME vs. PHA plot around the trigger time
Blue+Cyan dotted lines: Time interval of the scaled map
From 0.000000 to 0.512000
TIME vs. DetID plot around the trigger time

Blue+Cyan dotted lines: Time interval of the scaled map
From 0.000000 to 0.512000
100 us light curve (15-350 keV)
Blue+Cyan dotted lines: Time interval of the scaled map
From 0.000000 to 0.512000
Spacecraft aspect plot

Bright source in the pre-burst/pre-slew/post-slew images
Pre-burst image of 15-350 keV band
Time interval of the image:
-239.512000 -0.512000

# RAcent  DECcent POSerr Theta    Phi  PeakCts   SNR AngSep     Name
#  [deg]    [deg]    ['] [deg]  [deg]                   [']
135.5369 -40.5455    1.6  39.0   51.3   4.3505   7.2    0.7	Vela X-1
170.3296 -60.4467   10.5  36.5   99.6  -0.6844  -1.1   10.6	Cen X-3
186.8066 -62.8850    6.3  39.7  111.9   1.6613   1.8    8.0	GX 301-2
151.9471 -66.4892    2.6  26.4   98.3   1.6877   4.4 ------	UNKNOWN
 93.6940  -9.3473    2.7  57.6  -11.0   4.9364   4.2 ------	UNKNOWN
Pre-slew background subtracted image of 15-350 keV band
Time interval of the image:
-0.512000 16.788590

# RAcent  DECcent POSerr Theta    Phi  PeakCts   SNR AngSep     Name
#  [deg]    [deg]    ['] [deg]  [deg]                   [']
135.5210 -40.6905    5.8  38.9   51.4   0.2494   2.0    8.2	Vela X-1
170.4362 -60.6734    8.1  36.4  100.0   0.1840   1.4    4.7	Cen X-3
186.9356 -62.7399    7.8  39.8  111.8   0.2840   1.5    7.9	GX 301-2
178.4574 -57.8453    2.6  41.2  102.1   1.0220   4.4 ------	UNKNOWN
 94.5950 -27.8991    3.1  39.2   -7.0   0.2639   3.7 ------	UNKNOWN
 60.5557 -50.2446    1.6  19.5  -69.3   0.4491   7.3 ------	UNKNOWN
Post-slew image of 15-350 keV band
Time interval of the image:
57.788590 898.988600

# RAcent  DECcent POSerr Theta    Phi  PeakCts   SNR AngSep     Name
#  [deg]    [deg]    ['] [deg]  [deg]                   [']
309.0769 -62.7506    3.9  54.8  167.4   9.7764   3.0 ------	UNKNOWN
 13.4701 -60.4045    3.2  27.9 -173.4   2.6384   3.6 ------	UNKNOWN
  2.7497 -37.7794    2.7  42.3 -139.8   5.8876   4.4 ------	UNKNOWN
Plot creation:
Wed May  5 20:16:23 EDT 2021