Estimated redshift from machine learning (Ukwatta et al. 2016) - may take a few minute to calcaulte
Image
Pre-slew 15.0-350.0 keV image (Event data)

#   RAcent    DECcent   POSerr    Theta     Phi              Peak Cts       SNR   Name
  299.6441    51.7420   0.0288    39.2156  -178.3785         1.8402942      6.704 TRIG_00965638

Foreground time interval of the image:
-90.880  27.733 (delta_t = 118.613 [sec])
Background time interval of the image:
-239.168 -90.880 (delta_t = 148.288 [sec])
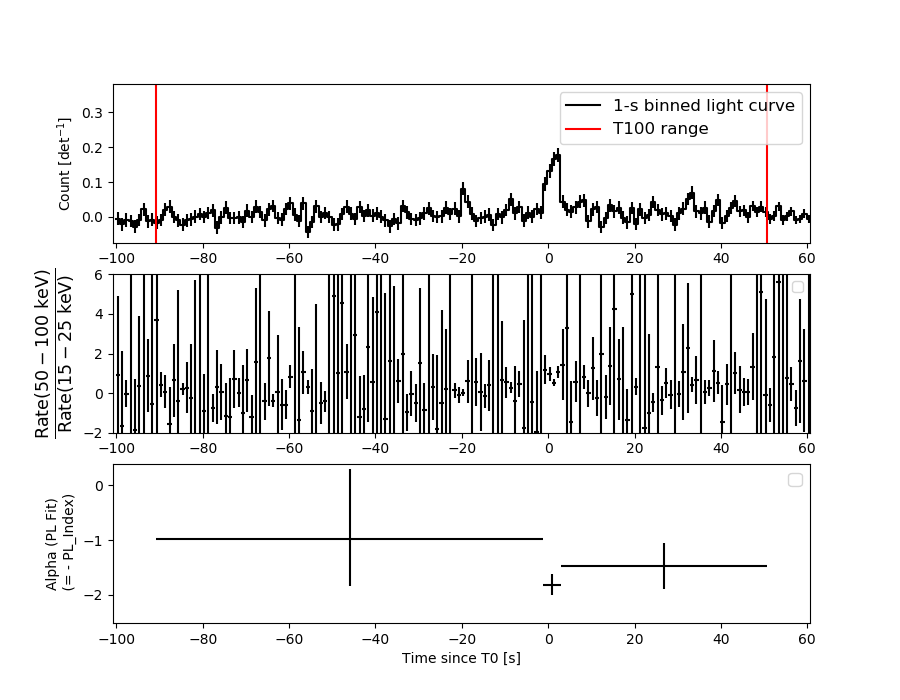
Lightcurves
Notes:
- 1) The mask-weighted light curves are using the flight position.
- 2) Multiple plots of different time binning/intervals are shown to cover all scenarios of short/long GRBs, rate/image triggers, and real/false positives.
- 3) For all the mask-weighted lightcurves, the y-axis units are counts/sec/det where a det is 0.4 x 0.4 = 0.16 sq cm.
- 4) The verticle lines correspond to following: green dotted lines are T50 interval, black dotted lines are T90 interval, blue solid line(s) is a spacecraft slew start time, and orange solid line(s) is a spacecraft slew end time.
- 5) Time of each bin is in the middle of the bin.
1 s binning
From T0-310 s to T0+310 s

From T100_start - 20 s to T100_end + 30 s
Full time interval

64 ms binning
Full time interval
From T100_start to T100_end
From T0-5 sec to T0+5 sec

16 ms binning
From T100_start-5 s to T100_start+5 s

Blue+Cyan dotted lines: Time interval of the scaled map
From 0.000000 to 2.048000
8 ms binning
From T100_start-3 s to T100_start+3 s

Blue+Cyan dotted lines: Time interval of the scaled map
From 0.000000 to 2.048000
2 ms binning
From T100_start-1 s to T100_start+1 s
Blue+Cyan dotted lines: Time interval of the scaled map
From 0.000000 to 2.048000
SN=5 or 10 sec. binning (whichever binning is satisfied first)

SN=5 or 10 sec. binning (T < 200 sec)

Quad-rate summed light curves (from T0-300s to T0+1000s)

Spectral Evolution
Spectra
Notes:
- 1) The fitting includes the systematic errors.
- 2) When the burst includes telescope slew time periods, the fitting uses an average response file made from multiple 5-s response files through out the slew time plus single time preiod for the non-slew times, and weighted by the total counts in the corresponding time period using addrmf. An average response file is needed becuase a spectral fit using the pre-slew DRM will introduce some errors in both a spectral shape and a normalization if the PHA file contains a lot of the slew/post-slew time interval.
- 3) For fits to more complicated models (e.g. a power-law over a cutoff power-law), the BAT team has decided to require a chi-square improvement of more than 6 for each extra dof.
Time averaged spectrum fit using the average DRM
Power-law model
Time interval is from  -90.880 sec. to   50.624 sec.
XSPEC12>exit
 XSPEC: quit


Spectral model in power-law:
------------------------------------------------------------
Parameters  : value       lower 90%   higher 90%
Photon index: 1.40317     ( -0.309379   0.300579 )
Norm@50keV  : 9.15706E-04    ( -0.000162308   0.000162129 )
------------------------------------------------------------

Photon flux (15-150 keV)    in 141.5 sec: 0.111599 ( -0.0208011  0.020923 ) ph/cm2/s
Energy fluence (15-150 keV)             : 1.25134e-06 ( -2.36295e-07  2.3828e-07 ) ergs/cm2
Cutoff power-law model

Time interval is from  -90.880 sec. to   50.624 sec.
 XSPEC: quit


Spectral model in the cutoff power-law:
------------------------------------------------------------
Parameters  : value       lower 90%   higher 90%
Photon index: 1.15998     ( -1.2571   1.31201 )
Epeak [keV] : 174.747      ( -174.718 -174.718 )
Norm@50keV  : 1.21601E-03    ( -0.000452911   0.00389644 )
------------------------------------------------------------

Photon flux (15-150 keV)    in 141.5 sec: 0.110642 ( -0.0211664  0.010839 ) ph/cm2/s
Energy fluence (15-150 keV)             : 1.23026e-06 ( -2.58236e-07  2.51223e-07 ) ergs/cm2
Band function

Time interval is from  -90.880 sec. to   50.624 sec.


Spectral model in the Band function:
------------------------------------------------------------
Parameters  : value       lower 90%   higher 90%
alpha       :    (     )
beta        :     (     )
Epeak [keV] :       (   )
Norm@50keV   :     (     )
------------------------------------------------------------

Photon flux (15-150 keV)    in  sec:  (    ) ph/cm2/s
Energy fluence (15-150 keV)             : 0 ( 0  0 ) ergs/cm2
Single BB

XSPEC12>exit
 XSPEC: quit


Spectral model blackbody:
------------------------------------------------------------
Parameters  : value    Lower 90%  Upper 90%
kT [keV]    : 15.5271  (-3.73935  5.31939)
R^2/D10^2   : 1.12703E-02  (-0.00717889   0.0187472)
(R is the radius in km and D10 is the distance to the source in units of 10 kpc)
------------------------------------------------------------

Energy  Fluence     90% Error
[keV]   [erg/cm2]   [erg/cm2]
15- 25  8.000e-08   3.103e-08
25- 50  3.279e-07   1.125e-07
50-150  5.461e-07   2.196e-07
15-150  9.540e-07   3.111e-07
Thermal bremsstrahlung (OTTB)
XSPEC12>/*
XSPEC12>exit
 XSPEC: quit


Spectral model: thermal bremsstrahlung
------------------------------------------------------------
Parameters  : value         Lower 90%    Upper 90%
kT [keV]    : 199.363       (-85.1964      -199.363)
Norm        : 0.466161       (-0.0827149     0.0827175)
------------------------------------------------------------

Energy  Fluence     90% Error
[keV]   [erg/cm2]   [erg/cm2]
15- 25  1.643e-07   9.480e-08
25- 50  3.160e-07   1.812e-07
50-150  6.930e-07   3.904e-07
15-150  1.173e-06   6.647e-07
Double BB

XSPEC12>/*
XSPEC12>exit
 XSPEC: quit


Spectral model: bbodyrad<1> + bbodyrad<2>
------------------------------------------------------------
Parameters  : value         Lower 90%    Upper 90%
kT1 [keV]   : 8.23884        (-2.41185      3.39948)
R1^2/D10^2  : 7.82483E-02        (-0.053658      0.0874836)
kT2 [keV]   : 39.4965        (-17.2115      -39.555)
R2^2/D10^2  : 3.93037E-04    (-0.000354866   0.00215104)
------------------------------------------------------------

Energy  Fluence     90% Error
[keV]   [erg/cm2]   [erg/cm2]
15- 25  1.501e-07   8.582e-08
25- 50  3.322e-07   1.869e-07
50-150  7.962e-07   4.365e-07
15-150  1.278e-06   6.484e-07
Peak spectrum fit
Power-law model
Time interval is from    1.428 sec. to    2.428 sec.
XSPEC12>exit
 XSPEC: quit


Spectral model in power-law:
------------------------------------------------------------
Parameters  : value       lower 90%   higher 90%
Photon index: 2.16331     ( -0.31486   0.356182 )
Norm@50keV  : 1.08658E-02    ( -0.00256125   0.00244327 )
------------------------------------------------------------

Photon flux (15-150 keV)    in 1 sec: 1.76504 ( -0.29527  0.29535 ) ph/cm2/s
Energy fluence (15-150 keV)             : 1.01683e-07 ( -2.03868e-08  2.09733e-08 ) ergs/cm2
Cutoff power-law model

Time interval is from    1.428 sec. to    2.428 sec.
 XSPEC: quit


Spectral model in the cutoff power-law:
------------------------------------------------------------
Parameters  : value       lower 90%   higher 90%
Photon index: 1.86754     ( -1.51609   0.182087 )
Epeak [keV] : 19.3001      (   )
Norm@50keV  : 1.60773E-02    (     )
------------------------------------------------------------

Photon flux (15-150 keV)    in 1 sec: 1.75043 ( -0.30328  0.29607 ) ph/cm2/s
Energy fluence (15-150 keV)             : 0 ( 0  0 ) ergs/cm2
Band function

Time interval is from    1.428 sec. to    2.428 sec.


Spectral model in the Band function:
------------------------------------------------------------
Parameters  : value       lower 90%   higher 90%
alpha       :    (     )
beta        :     (     )
Epeak [keV] :       (   )
Norm@50keV   :     (     )
------------------------------------------------------------

Photon flux (15-150 keV)    in  sec:  (    ) ph/cm2/s
Energy fluence (15-150 keV)             : 0 ( 0  0 ) ergs/cm2
Single BB

XSPEC12>exit
 XSPEC: quit


Spectral model blackbody:
------------------------------------------------------------
Parameters  : value    Lower 90%  Upper 90%
kT [keV]    : 9.33904  (-1.9362  2.34728)
R^2/D10^2   : 1.03757  (-0.600369   1.53136)
(R is the radius in km and D10 is the distance to the source in units of 10 kpc)
------------------------------------------------------------

Energy  Fluence     90% Error
[keV]   [erg/cm2]   [erg/cm2]
15- 25  1.794e-08   5.686e-09
25- 50  4.036e-08   1.178e-08
50-150  1.722e-08   8.428e-09
15-150  7.551e-08   2.083e-08
Thermal bremsstrahlung (OTTB)
XSPEC12>/*
XSPEC12>exit
 XSPEC: quit


Spectral model: thermal bremsstrahlung
------------------------------------------------------------
Parameters  : value         Lower 90%    Upper 90%
kT [keV]    : 54.3746       (-20.7684      40.4657)
Norm        : 9.64750       (-2.50992     3.6261)
------------------------------------------------------------

Energy  Fluence     90% Error
[keV]   [erg/cm2]   [erg/cm2]
15- 25  2.382e-08   5.960e-09
25- 50  3.513e-08   1.688e-08
50-150  3.672e-08   2.932e-08
15-150  9.567e-08   4.702e-08
Double BB
XSPEC12>/*
XSPEC12>exit
 XSPEC: quit


Spectral model: bbodyrad<1> + bbodyrad<2>
------------------------------------------------------------
Parameters  : value         Lower 90%    Upper 90%
kT1 [keV]   : 3.68403        (-2.324      3.61592)
R1^2/D10^2  : 30.4674        (-28.6863      35611.6)
kT2 [keV]   : 13.9859        (-4.36237      15.6662)
R2^2/D10^2  : 0.175771    (-0.169905   0.479108)
------------------------------------------------------------

Energy  Fluence     90% Error
[keV]   [erg/cm2]   [erg/cm2]
15- 25  2.560e-08   1.380e-08
25- 50  3.219e-08   1.722e-08
50-150  3.478e-08   2.136e-08
15-150  9.256e-08   4.782e-08
Pre-slew spectrum (Pre-slew PHA with pre-slew DRM)
Power-law model

XSPEC12>exit
 XSPEC: quit


Spectral model in power-law:
------------------------------------------------------------
Parameters  : value       lower 90%   higher 90%
Photon index: 1.31942     ( -0.380075   0.358487 )
Norm@50keV  : 8.62803E-04    ( -0.000179381   0.000179214 )
------------------------------------------------------------

Photon flux (15-150 keV)    in 118.6 sec: 0.103312 ( -0.0229135  0.0231058 ) ph/cm2/s
Energy fluence (15-150 keV)             : 1.00649e-06 ( -2.20335e-07  2.22176e-07 ) ergs/cm2
Cutoff power-law model
 XSPEC: quit


Spectral model in the cutoff power-law:
------------------------------------------------------------
Parameters  : value       lower 90%   higher 90%
Photon index: 1.31570     ( -1.27156   1.70512 )
Epeak [keV] : 9995.76      ( -9994.22 -9994.22 )
Norm@50keV  : 8.66400E-04    ( -0.000179707   0.00300813 )
------------------------------------------------------------

Photon flux (15-150 keV)    in 118.6 sec: 0.103281 ( -0.023097  0.023099 ) ph/cm2/s
Energy fluence (15-150 keV)             : 1.0067e-06 ( -2.34546e-07  2.21188e-07 ) ergs/cm2
Band function
Spectral model in the Band function:
------------------------------------------------------------
Parameters  : value       lower 90%   higher 90%
alpha       :    (     )
beta        :     (     )
Epeak [keV] :       (   )
Norm@50keV   :     (     )
------------------------------------------------------------

Photon flux (15-150 keV)    in  sec:  (    ) ph/cm2/s
Energy fluence (15-150 keV)             : 0 ( 0  0 ) ergs/cm2
S(25-50 keV) vs. S(50-100 keV) plot
S(25-50 keV)  = 2.94e-07
S(50-100 keV) = 4.46e-07
T90 vs. Hardness ratio plot

T90                                   = 108.72000002861 sec.
Hardness ratio (energy fluence ratio) = 1.51701
Color vs. Color plot
Count Ratio  (25-50 keV) / (15-25 keV) = 1.64099
Count Ratio (50-100 keV) / (15-25 keV) = 1.07348
Mask shadow pattern
IMX = -8.157074404106014E-01, IMY = 2.309132682059138E-02
TIME vs. PHA plot around the trigger time
Blue+Cyan dotted lines: Time interval of the scaled map
From 0.000000 to 2.048000
TIME vs. DetID plot around the trigger time

Blue+Cyan dotted lines: Time interval of the scaled map
From 0.000000 to 2.048000
100 us light curve (15-350 keV)

Blue+Cyan dotted lines: Time interval of the scaled map
From 0.000000 to 2.048000
Spacecraft aspect plot

Bright source in the pre-burst/pre-slew/post-slew images
Pre-burst image of 15-350 keV band
Time interval of the image:
-239.168000 -90.880000

# RAcent  DECcent POSerr Theta    Phi  PeakCts   SNR AngSep     Name
#  [deg]    [deg]    ['] [deg]  [deg]                   [']
268.4281  -1.3937    4.6  33.7   69.2   0.9596   2.5    5.0	SW J1753.5-0127
270.2037 -25.2002    8.9  47.2   38.3  -0.7656  -1.3    8.5	GX 5-1
270.2554 -25.6217    4.9  47.5   37.8   1.4887   2.4    7.7	GRS 1758-258
274.0131 -13.9472    5.5  36.5   45.7   0.7380   2.1    5.4	GX 17+2
276.0724 -30.4570    6.5  48.5   28.4  -1.0228  -1.8    9.3	H1820-303
285.0628 -24.9103   18.5  40.0   21.8   0.1904   0.6    1.6	HT1900.1-2455
288.6671  10.7902   12.5  10.6   83.1   0.1754   0.9   12.1	GRS 1915+105
299.6230  35.1782    1.8  22.7 -178.1   1.2066   6.4    2.1	Cyg X-1
308.1268  40.9429    2.8  29.4 -165.1   0.8747   4.2    0.9	Cyg X-3
326.0863  38.1955    7.9  35.0 -140.6   0.3925   1.5    8.6	Cyg X-2
257.3945  17.4834    2.2  40.8  103.7   3.7814   5.2 ------	UNKNOWN
272.7775  64.0892    2.8  54.8  167.5   3.8173   4.2 ------	UNKNOWN
275.5969  59.6247    2.4  50.3  166.0   3.0561   4.8 ------	UNKNOWN
327.6133  -3.4890    2.6  32.3  -60.7   1.2675   4.5 ------	UNKNOWN
345.7323  41.3040    3.0  49.5 -133.0   3.3711   3.9 ------	UNKNOWN
Pre-slew background subtracted image of 15-350 keV band
Time interval of the image:
-90.880000 27.732600

# RAcent  DECcent POSerr Theta    Phi  PeakCts   SNR AngSep     Name
#  [deg]    [deg]    ['] [deg]  [deg]                   [']
268.3159  -1.3694    7.5  33.8   69.3  -0.5365  -1.5    5.9	SW J1753.5-0127
270.1398 -25.0372    8.6  47.2   38.5   0.8071   1.3    8.2	GX 5-1
270.2346 -25.6507    5.9  47.6   37.8  -1.2679  -2.0    6.6	GRS 1758-258
273.8628 -14.0255    5.6  36.7   45.8  -0.7100  -2.1    8.4	GX 17+2
275.7741 -30.2439    9.2  48.4   28.9  -0.7499  -1.3   10.8	H1820-303
285.1217 -24.8145    5.0  39.8   21.8  -0.6530  -2.3    7.9	HT1900.1-2455
288.7883  10.8803    7.5  10.5   83.4  -0.2813  -1.5    4.0	GRS 1915+105
299.4348  35.3485    3.8  22.8 -178.5   0.5788   3.1   11.6	Cyg X-1
307.9424  40.9559    5.8  29.4 -165.4  -0.4007  -2.0    7.6	Cyg X-3
326.1525  38.2661   18.0  35.1 -140.6  -0.1580  -0.6    3.5	Cyg X-2
283.9684  66.1487    2.6  54.6  173.8   3.7597   4.5 ------	UNKNOWN
299.6442  51.7420    1.7  39.2 -178.4   1.8407   6.7 ------	UNKNOWN
316.5215  59.9848    2.0  49.1 -167.4   2.3246   5.7 ------	UNKNOWN
323.5100 -35.1727    2.0  52.9  -23.4   2.9484   5.7 ------	UNKNOWN
336.1659  62.1402    2.3  56.1 -159.0   4.4217   5.0 ------	UNKNOWN
330.1634   9.2225    3.4  30.4  -85.5   0.9939   3.5 ------	UNKNOWN
Post-slew image of 15-350 keV band
Time interval of the image:
85.332620 712.593600
720.832000 839.023800
840.832000 962.887000

# RAcent  DECcent POSerr Theta    Phi  PeakCts   SNR AngSep     Name
#  [deg]    [deg]    ['] [deg]  [deg]                   [']
254.4027  35.4575   14.4  35.8   78.0   1.4208   0.8    7.4	Her X-1
288.7556  11.0103   19.0  41.7   13.1  -0.6854  -0.6    4.6	GRS 1915+105
299.5737  35.2173    1.1  16.5   -2.9   8.1627  11.0    1.2	Cyg X-1
308.1378  40.9515    1.8  12.3  -34.8   4.4289   6.4    1.2	Cyg X-3
326.1289  38.3692    4.1  22.8  -67.5   2.5197   2.8    3.5	Cyg X-2
244.9833  40.8713    2.7  38.3   92.7   9.0643   4.2 ------	UNKNOWN
257.6224  49.2850    2.8  26.4   98.4   4.4828   4.1 ------	UNKNOWN
252.5923  54.4480    2.6  27.8  111.3   4.6981   4.5 ------	UNKNOWN
302.0842  -1.1827    2.7  53.0   -6.1   6.3846   4.3 ------	UNKNOWN
312.8344  48.0301    3.1   9.3  -74.6   2.4724   3.7 ------	UNKNOWN
309.5562  27.7462    3.5  25.1  -24.1   2.6027   3.3 ------	UNKNOWN
 42.1530  66.3846    3.0  48.3 -151.4   6.7242   3.8 ------	UNKNOWN
 31.7126  55.0163    3.3  50.9 -135.4  14.5741   3.5 ------	UNKNOWN
Plot creation:
Mon Jun  1 00:14:50 EDT 2020