Estimated redshift from machine learning (Ukwatta et al. 2016) - may take a few minute to calcaulte
Image
Pre-slew 15.0-350.0 keV image (Event data)

#   RAcent    DECcent   POSerr    Theta     Phi              Peak Cts       SNR   Name
    5.6678    -0.2639   0.0123    24.8303   170.5365         0.1881012     15.644 TRIG_00973628

Foreground time interval of the image:
 -0.016   0.672 (delta_t =   0.688 [sec])
Background time interval of the image:
-239.104  -0.016 (delta_t = 239.088 [sec])
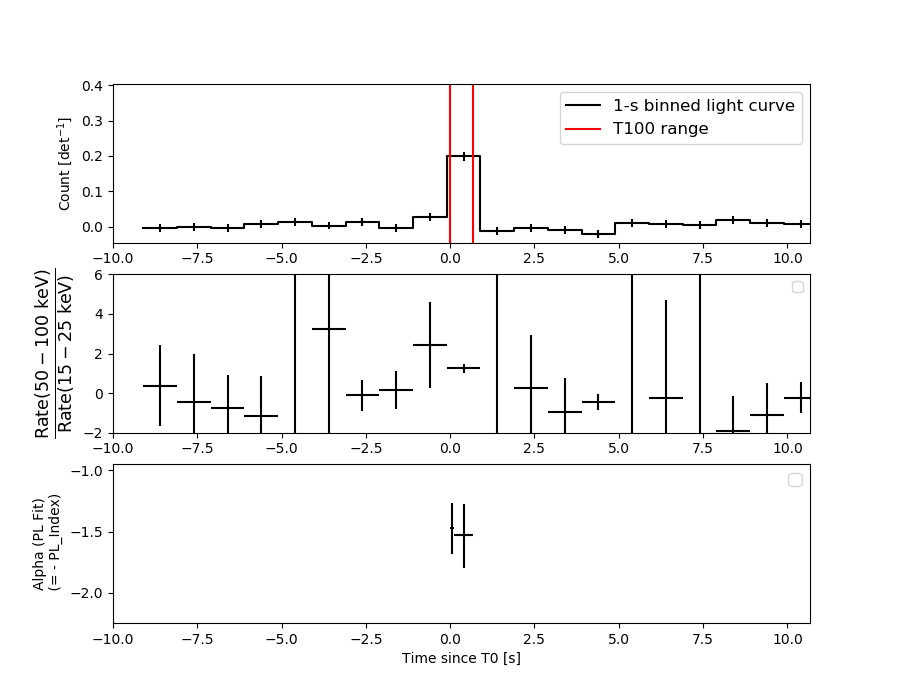
Lightcurves
Notes:
- 1) The mask-weighted light curves are using the flight position.
- 2) Multiple plots of different time binning/intervals are shown to cover all scenarios of short/long GRBs, rate/image triggers, and real/false positives.
- 3) For all the mask-weighted lightcurves, the y-axis units are counts/sec/det where a det is 0.4 x 0.4 = 0.16 sq cm.
- 4) The verticle lines correspond to following: green dotted lines are T50 interval, black dotted lines are T90 interval, blue solid line(s) is a spacecraft slew start time, and orange solid line(s) is a spacecraft slew end time.
- 5) Time of each bin is in the middle of the bin.
1 s binning
From T0-310 s to T0+310 s

From T100_start - 20 s to T100_end + 30 s
Full time interval
64 ms binning
Full time interval

From T100_start to T100_end

From T0-5 sec to T0+5 sec

16 ms binning
From T100_start-5 s to T100_start+5 s

8 ms binning
From T100_start-3 s to T100_start+3 s

2 ms binning
From T100_start-1 s to T100_start+1 s
SN=5 or 10 sec. binning (whichever binning is satisfied first)

SN=5 or 10 sec. binning (T < 200 sec)

Quad-rate summed light curves (from T0-300s to T0+1000s)

Spectral Evolution
Spectra
Notes:
- 1) The fitting includes the systematic errors.
- 2) When the burst includes telescope slew time periods, the fitting uses an average response file made from multiple 5-s response files through out the slew time plus single time preiod for the non-slew times, and weighted by the total counts in the corresponding time period using addrmf. An average response file is needed becuase a spectral fit using the pre-slew DRM will introduce some errors in both a spectral shape and a normalization if the PHA file contains a lot of the slew/post-slew time interval.
- 3) For fits to more complicated models (e.g. a power-law over a cutoff power-law), the BAT team has decided to require a chi-square improvement of more than 6 for each extra dof.
Time averaged spectrum fit using the average DRM
Power-law model

Time interval is from   -0.016 sec. to    0.672 sec.
XSPEC12>exit
 XSPEC: quit


Spectral model in power-law:
------------------------------------------------------------
Parameters  : value       lower 90%   higher 90%
Photon index: 1.45184     ( -0.168983   0.171227 )
Norm@50keV  : 1.68135E-02    ( -0.00183456   0.00182433 )
------------------------------------------------------------

Photon flux (15-150 keV)    in 0.688 sec: 2.07303 ( -0.2197  0.21981 ) ph/cm2/s
Energy fluence (15-150 keV)             : 1.10672e-07 ( -1.32635e-08  1.34009e-08 ) ergs/cm2
Cutoff power-law model

Time interval is from   -0.016 sec. to    0.672 sec.
 XSPEC: quit


Spectral model in the cutoff power-law:
------------------------------------------------------------
Parameters  : value       lower 90%   higher 90%
Photon index: 0.534902     ( -0.829632   0.694607 )
Epeak [keV] : 77.7636      ( -18.3751 86.7387 )
Norm@50keV  : 5.04322E-02    ( -0.028031   0.0833924 )
------------------------------------------------------------

Photon flux (15-150 keV)    in 0.688 sec: 2.01902 ( -0.22365  0.22368 ) ph/cm2/s
Energy fluence (15-150 keV)             : 1.03896e-07 ( -1.42005e-08  1.44054e-08 ) ergs/cm2
Band function

Time interval is from   -0.016 sec. to    0.672 sec.


Spectral model in the Band function:
------------------------------------------------------------
Parameters  : value       lower 90%   higher 90%
alpha       :    (     )
beta        :     (     )
Epeak [keV] :       (   )
Norm@50keV   :     (     )
------------------------------------------------------------

Photon flux (15-150 keV)    in  sec:  (    ) ph/cm2/s
Energy fluence (15-150 keV)             : 0 ( 0  0 ) ergs/cm2
Single BB

XSPEC12>exit
 XSPEC: quit


Spectral model blackbody:
------------------------------------------------------------
Parameters  : value    Lower 90%  Upper 90%
kT [keV]    : 14.6810  (-1.7851  2.07274)
R^2/D10^2   : 0.266314  (-0.098652   0.15246)
(R is the radius in km and D10 is the distance to the source in units of 10 kpc)
------------------------------------------------------------

Energy  Fluence     90% Error
[keV]   [erg/cm2]   [erg/cm2]
15- 25  8.295e-09   1.687e-09
25- 50  3.231e-08   4.376e-09
50-150  4.693e-08   9.911e-09
15-150  8.753e-08   1.190e-08
Thermal bremsstrahlung (OTTB)

XSPEC12>/*
XSPEC12>exit
 XSPEC: quit


Spectral model: thermal bremsstrahlung
------------------------------------------------------------
Parameters  : value         Lower 90%    Upper 90%
kT [keV]    : 200.000       (-62.9333      -200)
Norm        : 8.56088       (-0.895777     0.895777)
------------------------------------------------------------

Energy  Fluence     90% Error
[keV]   [erg/cm2]   [erg/cm2]
15- 25  1.467e-08   7.066e-09
25- 50  2.822e-08   1.548e-08
50-150  6.188e-08   3.409e-08
15-150  1.048e-07   5.752e-08
Double BB
XSPEC12>/*
XSPEC12>exit
 XSPEC: quit


Spectral model: bbodyrad<1> + bbodyrad<2>
------------------------------------------------------------
Parameters  : value         Lower 90%    Upper 90%
kT1 [keV]   : 7.70454        (-2.48788      2.99551)
R1^2/D10^2  : 1.39907        (-0.847405      2.42811)
kT2 [keV]   : 24.0885        (-6.13673      15.4738)
R2^2/D10^2  : 3.47547E-02    (-0.0291933   0.0770485)
------------------------------------------------------------

Energy  Fluence     90% Error
[keV]   [erg/cm2]   [erg/cm2]
15- 25  1.249e-08   6.712e-09
25- 50  3.010e-08   1.572e-08
50-150  6.290e-08   3.523e-08
15-150  1.055e-07   5.377e-08
Peak spectrum fit
Power-law model

Time interval is from   -0.170 sec. to    0.830 sec.
XSPEC12>exit
 XSPEC: quit


Spectral model in power-law:
------------------------------------------------------------
Parameters  : value       lower 90%   higher 90%
Photon index: 1.41246     ( -0.182888   0.183848 )
Norm@50keV  : 1.21961E-02    ( -0.00142297   0.00141713 )
------------------------------------------------------------

Photon flux (15-150 keV)    in 1 sec: 1.48954 ( -0.1715  0.17164 ) ph/cm2/s
Energy fluence (15-150 keV)             : 1.17566e-07 ( -1.50811e-08  1.52315e-08 ) ergs/cm2
Cutoff power-law model
Time interval is from   -0.170 sec. to    0.830 sec.
 XSPEC: quit


Spectral model in the cutoff power-law:
------------------------------------------------------------
Parameters  : value       lower 90%   higher 90%
Photon index: 0.602359     ( -0.855772   0.742177 )
Epeak [keV] : 84.0885      ( -23.1773 204.322 )
Norm@50keV  : 3.22326E-02    ( -0.0181839   0.0563063 )
------------------------------------------------------------

Photon flux (15-150 keV)    in 1 sec: 1.45644 ( -0.17401  0.17413 ) ph/cm2/s
Energy fluence (15-150 keV)             : 1.10958e-07 ( -1.62929e-08  1.64216e-08 ) ergs/cm2
Band function

Time interval is from   -0.170 sec. to    0.830 sec.


Spectral model in the Band function:
------------------------------------------------------------
Parameters  : value       lower 90%   higher 90%
alpha       :    (     )
beta        :     (     )
Epeak [keV] :       (   )
Norm@50keV   :     (     )
------------------------------------------------------------

Photon flux (15-150 keV)    in  sec:  (    ) ph/cm2/s
Energy fluence (15-150 keV)             : 0 ( 0  0 ) ergs/cm2
Single BB

XSPEC12>exit
 XSPEC: quit


Spectral model blackbody:
------------------------------------------------------------
Parameters  : value    Lower 90%  Upper 90%
kT [keV]    : 14.8246  (-2.04908  2.44738)
R^2/D10^2   : 0.184673  (-0.0763249   0.125729)
(R is the radius in km and D10 is the distance to the source in units of 10 kpc)
------------------------------------------------------------

Energy  Fluence     90% Error
[keV]   [erg/cm2]   [erg/cm2]
15- 25  8.513e-09   1.954e-09
25- 50  3.346e-08   5.920e-09
50-150  4.978e-08   1.155e-08
15-150  9.175e-08   1.529e-08
Thermal bremsstrahlung (OTTB)

XSPEC12>/*
XSPEC12>exit
 XSPEC: quit


Spectral model: thermal bremsstrahlung
------------------------------------------------------------
Parameters  : value         Lower 90%    Upper 90%
kT [keV]    : 200.000       (-59.3801      -200)
Norm        : 6.16447       (-0.699984     0.699984)
------------------------------------------------------------

Energy  Fluence     90% Error
[keV]   [erg/cm2]   [erg/cm2]
15- 25  1.535e-08   5.211e-09
25- 50  2.953e-08   1.611e-08
50-150  6.476e-08   3.554e-08
15-150  1.097e-07   6.045e-08
Double BB

XSPEC12>/*
XSPEC12>exit
 XSPEC: quit


Spectral model: bbodyrad<1> + bbodyrad<2>
------------------------------------------------------------
Parameters  : value         Lower 90%    Upper 90%
kT1 [keV]   : 8.16785        (-2.15986      2.63919)
R1^2/D10^2  : 0.909362        (-0.508834      1.49413)
kT2 [keV]   : 27.6958        (-7.68994      20.559)
R2^2/D10^2  : 1.52605E-02    (-0.013207   0.0383754)
------------------------------------------------------------

Energy  Fluence     90% Error
[keV]   [erg/cm2]   [erg/cm2]
15- 25  1.306e-08   6.953e-09
25- 50  3.165e-08   1.557e-08
50-150  6.939e-08   3.694e-08
15-150  1.141e-07   5.752e-08
Pre-slew spectrum (Pre-slew PHA with pre-slew DRM)
Power-law model

XSPEC12>exit
 XSPEC: quit


Spectral model in power-law:
------------------------------------------------------------
Parameters  : value       lower 90%   higher 90%
Photon index: 1.45184     ( -0.168983   0.171227 )
Norm@50keV  : 1.68135E-02    ( -0.00183456   0.00182433 )
------------------------------------------------------------

Photon flux (15-150 keV)    in 0.688 sec: 2.07299 ( -0.219698  0.2198 ) ph/cm2/s
Energy fluence (15-150 keV)             : 1.10659e-07 ( -1.32613e-08  1.34042e-08 ) ergs/cm2
Cutoff power-law model

 XSPEC: quit


Spectral model in the cutoff power-law:
------------------------------------------------------------
Parameters  : value       lower 90%   higher 90%
Photon index: 0.534902     ( -0.829632   0.694608 )
Epeak [keV] : 77.7636      ( -18.3751 86.7387 )
Norm@50keV  : 5.04323E-02    (     )
------------------------------------------------------------

Photon flux (15-150 keV)    in 0.688 sec: 2.01885 ( -0.22362  0.22364 ) ph/cm2/s
Energy fluence (15-150 keV)             : 1.03934e-07 ( -1.42044e-08  1.44177e-08 ) ergs/cm2
Band function

Spectral model in the Band function:
------------------------------------------------------------
Parameters  : value       lower 90%   higher 90%
alpha       :    (     )
beta        :     (     )
Epeak [keV] :       (   )
Norm@50keV   :     (     )
------------------------------------------------------------

Photon flux (15-150 keV)    in  sec:  (    ) ph/cm2/s
Energy fluence (15-150 keV)             : 0 ( 0  0 ) ergs/cm2
S(25-50 keV) vs. S(50-100 keV) plot

S(25-50 keV)  = 2.67e-08
S(50-100 keV) = 3.91e-08
T90 vs. Hardness ratio plot

T90                                   = 0.615999937057495 sec.
Hardness ratio (energy fluence ratio) = 1.46442
Color vs. Color plot

Count Ratio  (25-50 keV) / (15-25 keV) = 1.52769
Count Ratio (50-100 keV) / (15-25 keV) = 1.1371
Mask shadow pattern
IMX = -4.564087144354455E-01, IMY = -7.607749107181289E-02
TIME vs. PHA plot around the trigger time

TIME vs. DetID plot around the trigger time

100 us light curve (15-350 keV)

Spacecraft aspect plot

Bright source in the pre-burst/pre-slew/post-slew images
Pre-burst image of 15-350 keV band
Time interval of the image:
-239.104000 -0.016000

# RAcent  DECcent POSerr Theta    Phi  PeakCts   SNR AngSep     Name
#  [deg]    [deg]    ['] [deg]  [deg]                   [']
 76.7383 -50.4005    2.8  54.0    8.1   3.1733   4.1 ------	UNKNOWN
 19.4080  36.8170    4.0  52.2 -140.7   3.3170   2.9 ------	UNKNOWN
 26.8063  34.0545    3.1  49.1 -133.1   4.0978   3.7 ------	UNKNOWN
Pre-slew background subtracted image of 15-350 keV band
Time interval of the image:
-0.016000 0.672000

# RAcent  DECcent POSerr Theta    Phi  PeakCts   SNR AngSep     Name
#  [deg]    [deg]    ['] [deg]  [deg]                   [']
  5.6678  -0.2638    0.7  24.8  170.5   0.1881  15.6  340.4	UNKNOWN
  1.1358  32.6606    2.2  53.2 -160.2   0.1835   5.2 ------	UNKNOWN
 81.0879 -22.1319    2.1  52.6  -27.6   0.1803   5.5 ------	UNKNOWN
 50.8027   8.8444    2.0  34.4  -86.6   0.1271   5.7 ------	UNKNOWN
 49.1078  18.8011    2.4  40.9  -99.3   0.2245   4.8 ------	UNKNOWN
Post-slew image of 15-350 keV band
Time interval of the image:
67.196590 648.796630

# RAcent  DECcent POSerr Theta    Phi  PeakCts   SNR AngSep     Name
#  [deg]    [deg]    ['] [deg]  [deg]                   [']
326.1844  38.3653   66.4  53.0  166.5  -0.3494  -0.2    2.7	Cyg X-2
339.6336 -29.7038    3.0  38.5   63.0   4.7819   3.8 ------	UNKNOWN
351.4667 -32.1571    4.1  34.6   46.7   2.2911   2.8 ------	UNKNOWN
332.3911  45.2501    2.2  54.2  176.7  11.0852   5.3 ------	UNKNOWN
  4.0307  -3.6480    2.5   3.7   51.2   2.0404   4.7  326.1	UNKNOWN
347.3648  30.4812    2.7  35.4  177.3   2.7433   4.3 ------	UNKNOWN
Plot creation:
Wed Jul  1 20:10:18 EDT 2020