Estimated redshift from machine learning (Ukwatta et al. 2016) - may take a few minute to calcaulte
Image
Pre-slew 15.0-350.0 keV image (Event data)
#   RAcent    DECcent   POSerr    Theta     Phi              Peak Cts       SNR   Name
  238.7520   -11.0799   0.0074    28.9873    61.4414         4.3214260     25.832 TRIG_00974942

Foreground time interval of the image:
 -0.688  55.701 (delta_t =  56.389 [sec])
Background time interval of the image:
-110.299  -0.688 (delta_t = 109.611 [sec])
Lightcurves
Notes:
- 1) The mask-weighted light curves are using the flight position.
- 2) Multiple plots of different time binning/intervals are shown to cover all scenarios of short/long GRBs, rate/image triggers, and real/false positives.
- 3) For all the mask-weighted lightcurves, the y-axis units are counts/sec/det where a det is 0.4 x 0.4 = 0.16 sq cm.
- 4) The verticle lines correspond to following: green dotted lines are T50 interval, black dotted lines are T90 interval, blue solid line(s) is a spacecraft slew start time, and orange solid line(s) is a spacecraft slew end time.
- 5) Time of each bin is in the middle of the bin.
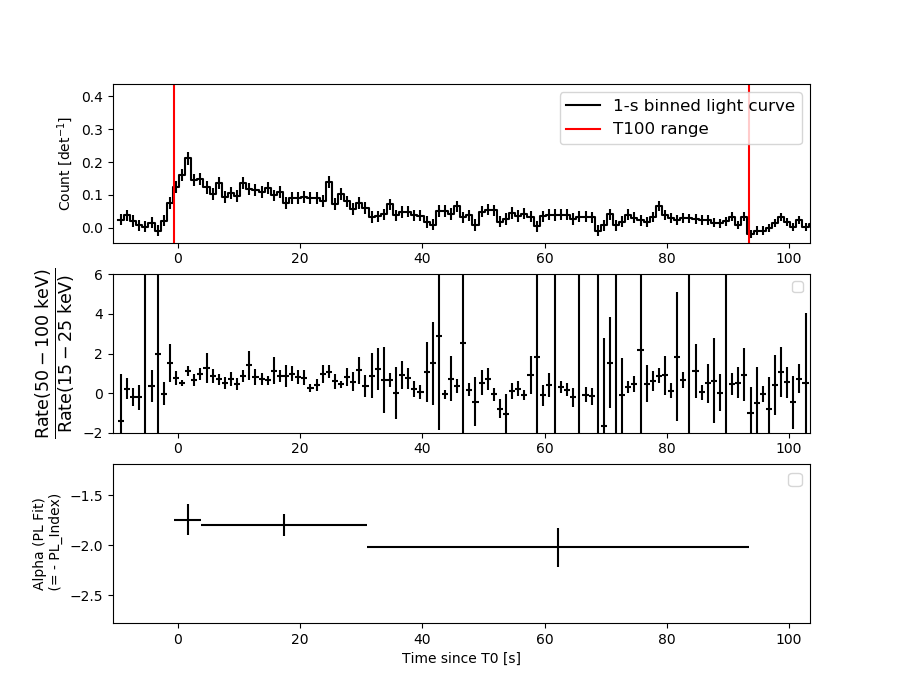
1 s binning
From T0-310 s to T0+310 s
From T100_start - 20 s to T100_end + 30 s
Full time interval

64 ms binning
Full time interval
From T100_start to T100_end
From T0-5 sec to T0+5 sec

16 ms binning
From T100_start-5 s to T100_start+5 s
Blue+Cyan dotted lines: Time interval of the scaled map
From 0.000000 to 12.160000
8 ms binning
From T100_start-3 s to T100_start+3 s
Blue+Cyan dotted lines: Time interval of the scaled map
From 0.000000 to 12.160000
2 ms binning
From T100_start-1 s to T100_start+1 s
Blue+Cyan dotted lines: Time interval of the scaled map
From 0.000000 to 12.160000
SN=5 or 10 sec. binning (whichever binning is satisfied first)
SN=5 or 10 sec. binning (T < 200 sec)
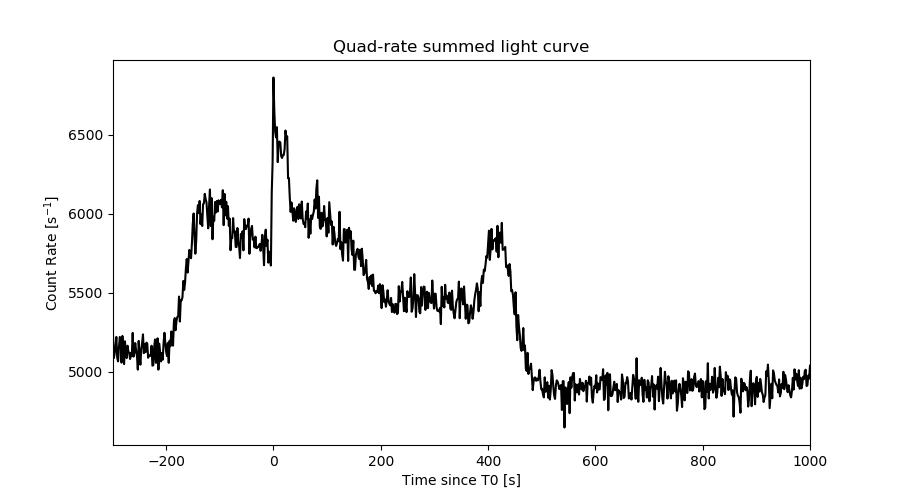
Quad-rate summed light curves (from T0-300s to T0+1000s)
Spectral Evolution
Spectra
Notes:
- 1) The fitting includes the systematic errors.
- 2) When the burst includes telescope slew time periods, the fitting uses an average response file made from multiple 5-s response files through out the slew time plus single time preiod for the non-slew times, and weighted by the total counts in the corresponding time period using addrmf. An average response file is needed becuase a spectral fit using the pre-slew DRM will introduce some errors in both a spectral shape and a normalization if the PHA file contains a lot of the slew/post-slew time interval.
- 3) For fits to more complicated models (e.g. a power-law over a cutoff power-law), the BAT team has decided to require a chi-square improvement of more than 6 for each extra dof.
Time averaged spectrum fit using the average DRM
Power-law model
Time interval is from   -0.688 sec. to   93.428 sec.
XSPEC12>exit
 XSPEC: quit


Spectral model in power-law:
------------------------------------------------------------
Parameters  : value       lower 90%   higher 90%
Photon index: 1.88715     ( -0.0986717   0.100206 )
Norm@50keV  : 3.59853E-03    ( -0.000202713   0.000201179 )
------------------------------------------------------------

Photon flux (15-150 keV)    in 94.12 sec: 0.513665 ( -0.027882  0.027972 ) ph/cm2/s
Energy fluence (15-150 keV)             : 3.11409e-06 ( -1.73722e-07  1.74818e-07 ) ergs/cm2
Cutoff power-law model

Time interval is from   -0.688 sec. to   93.428 sec.
 XSPEC: quit


Spectral model in the cutoff power-law:
------------------------------------------------------------
Parameters  : value       lower 90%   higher 90%
Photon index: 1.58485     ( -0.412856   0.356785 )
Epeak [keV] : 65.2889      ( -17.3191 -65.2889 )
Norm@50keV  : 5.16374E-03    ( -0.00167698   0.00320489 )
------------------------------------------------------------

Photon flux (15-150 keV)    in 94.12 sec: 0.503489 ( -0.030511  0.030588 ) ph/cm2/s
Energy fluence (15-150 keV)             : 3.03049e-06 ( -2.01622e-07  2.02189e-07 ) ergs/cm2
Band function

Time interval is from   -0.688 sec. to   93.428 sec.


Spectral model in the Band function:
------------------------------------------------------------
Parameters  : value       lower 90%   higher 90%
alpha       :    (     )
beta        :     (     )
Epeak [keV] :       (   )
Norm@50keV   :     (     )
------------------------------------------------------------

Photon flux (15-150 keV)    in  sec:  (    ) ph/cm2/s
Energy fluence (15-150 keV)             : 0 ( 0  0 ) ergs/cm2
Single BB

XSPEC12>exit
 XSPEC: quit


Spectral model blackbody:
------------------------------------------------------------
Parameters  : value    Lower 90%  Upper 90%
kT [keV]    : 12.2095  (  )
R^2/D10^2   : 0.108284  (   )
(R is the radius in km and D10 is the distance to the source in units of 10 kpc)
------------------------------------------------------------

Energy  Fluence     90% Error
[keV]   [erg/cm2]   [erg/cm2]
15- 25  3.217e-07   3.332e-08
25- 50  1.033e-06   7.012e-08
50-150  9.367e-07   1.167e-07
15-150  2.292e-06   1.388e-07
Thermal bremsstrahlung (OTTB)
XSPEC12>/*
XSPEC12>exit
 XSPEC: quit


Spectral model: thermal bremsstrahlung
------------------------------------------------------------
Parameters  : value         Lower 90%    Upper 90%
kT [keV]    : 91.1746       (-15.615      21.368)
Norm        : 2.27535       (-0.183245     0.205421)
------------------------------------------------------------

Energy  Fluence     90% Error
[keV]   [erg/cm2]   [erg/cm2]
15- 25  5.590e-07   5.337e-08
25- 50  9.482e-07   5.068e-08
50-150  1.455e-06   4.141e-07
15-150  2.962e-06   4.551e-07
Double BB
XSPEC12>/*
XSPEC12>exit
 XSPEC: quit


Spectral model: bbodyrad<1> + bbodyrad<2>
------------------------------------------------------------
Parameters  : value         Lower 90%    Upper 90%
kT1 [keV]   : 5.70426        (-0.961041      1.08441)
R1^2/D10^2  : 1.29102        (-0.613466      1.42331)
kT2 [keV]   : 20.1363        (-2.75586      3.99577)
R2^2/D10^2  : 1.29604E-02    (-0.00665251   0.0106115)
------------------------------------------------------------

Energy  Fluence     90% Error
[keV]   [erg/cm2]   [erg/cm2]
15- 25  5.818e-07   1.303e-07
25- 50  9.097e-07   1.317e-07
50-150  1.464e-06   3.134e-07
15-150  2.955e-06   4.654e-07
Peak spectrum fit
Power-law model
Time interval is from    1.496 sec. to    2.496 sec.
XSPEC12>exit
 XSPEC: quit


Spectral model in power-law:
------------------------------------------------------------
Parameters  : value       lower 90%   higher 90%
Photon index: 1.81829     ( -0.25872   0.274608 )
Norm@50keV  : 1.34578E-02    ( -0.00213472   0.00207061 )
------------------------------------------------------------

Photon flux (15-150 keV)    in 1 sec: 1.86788 ( -0.26555  0.26672 ) ph/cm2/s
Energy fluence (15-150 keV)             : 1.2384e-07 ( -1.95698e-08  1.98214e-08 ) ergs/cm2
Cutoff power-law model
Time interval is from    1.496 sec. to    2.496 sec.
 XSPEC: quit


Spectral model in the cutoff power-law:
------------------------------------------------------------
Parameters  : value       lower 90%   higher 90%
Photon index: 2.09405     ( -1.07111   0.0459302 )
Epeak [keV] : 39.7432      (   )
Norm@50keV  : 9.87667E-03    (     )
------------------------------------------------------------

Photon flux (15-150 keV)    in 1 sec: 1.71153 ( -0.38787  0.40356 ) ph/cm2/s
Energy fluence (15-150 keV)             : 1.2436e-07 ( -2.16577e-08  2.05672e-08 ) ergs/cm2
Band function

Time interval is from    1.496 sec. to    2.496 sec.


Spectral model in the Band function:
------------------------------------------------------------
Parameters  : value       lower 90%   higher 90%
alpha       :    (     )
beta        :     (     )
Epeak [keV] :       (   )
Norm@50keV   :     (     )
------------------------------------------------------------

Photon flux (15-150 keV)    in  sec:  (    ) ph/cm2/s
Energy fluence (15-150 keV)             : 0 ( 0  0 ) ergs/cm2
Single BB
XSPEC12>exit
 XSPEC: quit


Spectral model blackbody:
------------------------------------------------------------
Parameters  : value    Lower 90%  Upper 90%
kT [keV]    : 13.2337  (-2.67302  3.1993)
R^2/D10^2   : 0.298750  (-0.160023   0.379218)
(R is the radius in km and D10 is the distance to the source in units of 10 kpc)
------------------------------------------------------------

Energy  Fluence     90% Error
[keV]   [erg/cm2]   [erg/cm2]
15- 25  1.109e-08   3.530e-09
25- 50  3.894e-08   8.840e-09
50-150  4.356e-08   1.479e-08
15-150  9.359e-08   1.940e-08
Thermal bremsstrahlung (OTTB)
XSPEC12>/*
XSPEC12>exit
 XSPEC: quit


Spectral model: thermal bremsstrahlung
------------------------------------------------------------
Parameters  : value         Lower 90%    Upper 90%
kT [keV]    : 109.567       (-44.1037      -110.665)
Norm        : 8.00381       (-1.44971     1.81998)
------------------------------------------------------------

Energy  Fluence     90% Error
[keV]   [erg/cm2]   [erg/cm2]
15- 25  2.090e-08   4.120e-09
25- 50  3.679e-08   6.985e-09
50-150  6.268e-08   3.245e-08
15-150  1.204e-07   3.943e-08
Double BB

XSPEC12>/*
XSPEC12>exit
 XSPEC: quit


Spectral model: bbodyrad<1> + bbodyrad<2>
------------------------------------------------------------
Parameters  : value         Lower 90%    Upper 90%
kT1 [keV]   : 4.68340        (-1.53785      1.98464)
R1^2/D10^2  : 11.4311        (-8.7801      33.283)
kT2 [keV]   : 21.5005        (-5.19088      9.4706)
R2^2/D10^2  : 4.31398E-02    (-0.0316373   0.051125)
------------------------------------------------------------

Energy  Fluence     90% Error
[keV]   [erg/cm2]   [erg/cm2]
15- 25  2.497e-08   1.356e-08
25- 50  3.121e-08   1.399e-08
50-150  6.746e-08   3.942e-08
15-150  1.236e-07   5.230e-08
Pre-slew spectrum (Pre-slew PHA with pre-slew DRM)
Power-law model
XSPEC12>exit
 XSPEC: quit


Spectral model in power-law:
------------------------------------------------------------
Parameters  : value       lower 90%   higher 90%
Photon index: 1.83675     ( -0.0965002   0.0978607 )
Norm@50keV  : 4.96788E-03    ( -0.000272521   0.000270793 )
------------------------------------------------------------

Photon flux (15-150 keV)    in 56.39 sec: 0.694560 ( -0.0374369  0.0375581 ) ph/cm2/s
Energy fluence (15-150 keV)             : 2.57639e-06 ( -1.42351e-07  1.4307e-07 ) ergs/cm2
Cutoff power-law model

 XSPEC: quit


Spectral model in the cutoff power-law:
------------------------------------------------------------
Parameters  : value       lower 90%   higher 90%
Photon index: 1.47853     ( -0.408205   0.372171 )
Epeak [keV] : 70.4887      ( -16.7672 -70.4887 )
Norm@50keV  : 7.57553E-03    ( -0.00263143   0.00455175 )
------------------------------------------------------------

Photon flux (15-150 keV)    in 56.39 sec: 0.678290 ( -0.040816  0.040914 ) ph/cm2/s
Energy fluence (15-150 keV)             : 2.49998e-06 ( -1.63097e-07  1.63379e-07 ) ergs/cm2
Band function

Spectral model in the Band function:
------------------------------------------------------------
Parameters  : value       lower 90%   higher 90%
alpha       :    (     )
beta        :     (     )
Epeak [keV] :       (   )
Norm@50keV   :     (     )
------------------------------------------------------------

Photon flux (15-150 keV)    in  sec:  (    ) ph/cm2/s
Energy fluence (15-150 keV)             : 0 ( 0  0 ) ergs/cm2
S(25-50 keV) vs. S(50-100 keV) plot

S(25-50 keV)  = 9.04e-07
S(50-100 keV) = 9.79e-07
T90 vs. Hardness ratio plot

T90                                   = 79.9159998893738 sec.
Hardness ratio (energy fluence ratio) = 1.08296
Color vs. Color plot
Count Ratio  (25-50 keV) / (15-25 keV) = 1.10785
Count Ratio (50-100 keV) / (15-25 keV) = 0.695521
Mask shadow pattern
IMX = 2.648529634663633E-01, IMY = -4.866102318631486E-01
TIME vs. PHA plot around the trigger time
Blue+Cyan dotted lines: Time interval of the scaled map
From 0.000000 to 12.160000
TIME vs. DetID plot around the trigger time
Blue+Cyan dotted lines: Time interval of the scaled map
From 0.000000 to 12.160000
100 us light curve (15-350 keV)

Blue+Cyan dotted lines: Time interval of the scaled map
From 0.000000 to 12.160000
Spacecraft aspect plot
Bright source in the pre-burst/pre-slew/post-slew images
Pre-burst image of 15-350 keV band
Time interval of the image:
-110.299400 -0.688000

# RAcent  DECcent POSerr Theta    Phi  PeakCts   SNR AngSep     Name
#  [deg]    [deg]    ['] [deg]  [deg]                   [']
244.9767 -15.6343    0.3  21.6   65.7   7.4339  38.2    0.4	Sco X-1
255.9547 -38.0084   20.5   7.1  -39.3   0.1013   0.6   10.0	4U 1700-377
256.4285 -36.5817    6.5   5.7  -34.6   0.3006   1.8    9.5	GX 349+2
263.0896 -24.8776   26.6   7.5  128.3   0.0736   0.4    9.1	GX 1+4
264.7664 -44.3509    5.4  12.8  -83.7   0.3907   2.2    6.0	4U 1735-44
268.3696  -1.4490  127.1  31.4  125.3   0.0253   0.1    0.2	SW J1753.5-0127
270.4031 -25.1921    7.5  11.0  164.4   0.2466   1.6    9.4	GX 5-1
270.3063 -25.7543    2.9  10.6  166.5   0.6844   4.3    0.7	GRS 1758-258
273.8378 -13.9519    7.6  21.8  147.2   0.2760   1.5   11.0	GX 17+2
275.9233 -30.3722   91.1  13.3 -162.9  -0.0218  -0.1    0.3	H1820-303
285.0348 -24.9180   90.3  22.6 -171.9  -0.0225  -0.1    0.2	HT1900.1-2455
288.7891  10.9239   22.0  50.7  147.0   0.4285   0.5    1.4	GRS 1915+105
262.8627 -33.7574    4.1   2.6 -117.6   0.4445   2.8    7.8	GX 354-0
230.3407 -17.6144    2.2  30.8   40.7   1.1595   5.4 ------	UNKNOWN
248.2253 -74.9584    3.1  43.4  -65.3   3.0746   3.7 ------	UNKNOWN
Pre-slew background subtracted image of 15-350 keV band
Time interval of the image:
-0.688000 55.700610

# RAcent  DECcent POSerr Theta    Phi  PeakCts   SNR AngSep     Name
#  [deg]    [deg]    ['] [deg]  [deg]                   [']
244.9128 -15.5957    2.1  21.7   65.6  -0.8636  -5.6    4.7	Sco X-1
255.9841 -38.0011    8.6   7.1  -39.4  -0.1498  -1.3    9.4	4U 1700-377
256.3243 -36.2947    6.2   5.5  -32.1   0.2028   1.8    9.4	GX 349+2
263.1567 -24.6792    9.7   7.7  128.3   0.1385   1.2    9.0	GX 1+4
264.9989 -44.5063    3.5  13.0  -84.3  -0.4162  -3.3   11.5	4U 1735-44
268.5286  -1.5501    5.7  31.4  125.6   0.3861   2.0   11.3	SW J1753.5-0127
270.5038 -25.1504    0.0  11.1  164.6  -0.1613  -1.5   12.7	GX 5-1
270.2206 -25.9392    0.0  10.4  167.0  -0.3135  -2.9   12.6	GRS 1758-258
274.0176 -14.1842    5.4  21.7  147.9   0.2758   2.1    8.9	GX 17+2
275.8265 -30.2466    6.0  13.2 -163.5   0.2229   1.9    8.8	H1820-303
284.9264 -25.0455    8.1  22.5 -171.7   0.1775   1.4    9.6	HT1900.1-2455
288.8110  10.9695    6.8  50.8  147.0  -1.1621  -1.7    1.6	GRS 1915+105
262.9457 -33.8553    3.8   2.8 -117.0  -0.3360  -3.0    2.5	GX 354-0
238.7520 -11.0799    0.4  29.0   61.4   4.3211  25.8 ------	UNKNOWN
288.8260   3.6689    1.7  44.7  152.4   1.9563   6.8 ------	UNKNOWN
311.3018 -12.8661    2.3  50.2 -170.2   1.3890   4.9 ------	UNKNOWN
294.0941 -45.5359    2.1  29.2 -122.5   0.8320   5.4 ------	UNKNOWN
262.7658 -74.2951    2.3  42.3  -70.8   2.1783   5.1 ------	UNKNOWN
Post-slew image of 15-350 keV band
Time interval of the image:
193.500640 359.400600

# RAcent  DECcent POSerr Theta    Phi  PeakCts   SNR AngSep     Name
#  [deg]    [deg]    ['] [deg]  [deg]                   [']
244.9833 -15.6403    0.2   7.5   72.1  10.1213  50.7    0.2	Sco X-1
254.4627  35.3498 1522.2  48.7  -39.1  -0.0047  -0.0    0.5	Her X-1
255.9140 -37.9728   18.3  31.0   97.2  -0.2228  -0.6    8.4	4U 1700-377
256.6420 -36.4286   10.3  30.0   94.5   0.3957   1.1   10.0	GX 349+2
263.1162 -24.7608    4.7  26.8   67.9  -0.7368  -2.5    5.9	GX 1+4
264.7140 -44.5619    6.2  40.2   95.1   1.6028   1.9    6.8	4U 1735-44
268.5003  -1.4569    8.1  31.0   17.9  -0.3731  -1.4    7.9	SW J1753.5-0127
270.4404 -25.0445    6.2  33.0   63.3   0.7757   1.9    8.7	GX 5-1
270.2431 -25.6947    8.7  33.1   64.5   0.5653   1.3    4.3	GRS 1758-258
274.0536 -13.8655    9.3  34.5   42.3  -0.4488  -1.2   10.6	GX 17+2
275.7776 -30.2927    4.2  39.3   68.8  -1.9136  -2.8    8.8	H1820-303
288.8230  10.9039    8.2  54.3   11.7   1.1867   1.4    2.9	GRS 1915+105
263.0715 -33.7199   22.9  31.7   83.4  -0.1966  -0.5    8.0	GX 354-0
279.1838 -28.2253    2.8  41.4   64.3   3.0768   4.0 ------	UNKNOWN
280.9971 -18.3649    2.6  41.3   49.2   2.3186   4.5 ------	UNKNOWN
281.4431  14.2368    2.3  49.2    3.9   2.2085   5.1 ------	UNKNOWN
191.1914 -20.9229    3.5  46.7 -164.5   1.6320   3.3 ------	UNKNOWN
193.3505   4.8585    2.4  48.0 -129.1   5.9674   4.9 ------	UNKNOWN
Plot creation:
Wed Jul  1 20:08:10 EDT 2020