Estimated redshift from machine learning (Ukwatta et al. 2016) - may take a few minutes to calcaulte
Image
Pre-slew 15-350 keV image (Event data; bkg subtracted)

#   RAcent  DECcent POSerr  Theta    Phi     Peak Cts     SNR  Name
  257.0892 -40.1341 0.0221   14.5  119.0       1.5136     8.7  TRIG_00975998
------------------------------------------

Foreground time interval of the image:
 -0.276  59.724 (delta_t =  60.000 [sec])
Background time interval of the image:
-28.975  -0.276 (delta_t =  28.699 [sec])
Lightcurves
Notes:
- 1) All plots contain as much data as has been downloaded to date.
- 2) The mask-weighted light curves are using the flight position.
- 3) Multiple plots of different time binning/intervals are shown to cover all scenarios of short/long GRBs, rate/image triggers, and real/false positives.
- 4) For all the mask-weighted lightcurves, the y-axis units are counts/sec/det where a det is 0.4 x 0.4 = 0.16 sq cm.
- 5) The verticle lines correspond to following: green dotted lines are T50 interval, black dotted lines are T90 interval, blue solid line(s) is a spacecraft slew start time, and orange solid line(s) is a spacecraft slew end time.
- 6) Time of each bin is in the middle of the bin.
1 s binning
From T0-310 s to T0+310 s

From T100_start - 20 s to T100_end + 30 s

Full time interval

64 ms binning
Full time interval

From T100_start to T100_end

From T0-5 sec to T0+5 sec

16 ms binning
From T100_start-5 s to T100_start+5 s

Blue+Cyan dotted lines: Time interval of the scaled map
From 0.000000 to 0.064000
8 ms binning
From T100_start-3 s to T100_start+3 s

Blue+Cyan dotted lines: Time interval of the scaled map
From 0.000000 to 0.064000
2 ms binning
From T100_start-1 s to T100_start+1 s
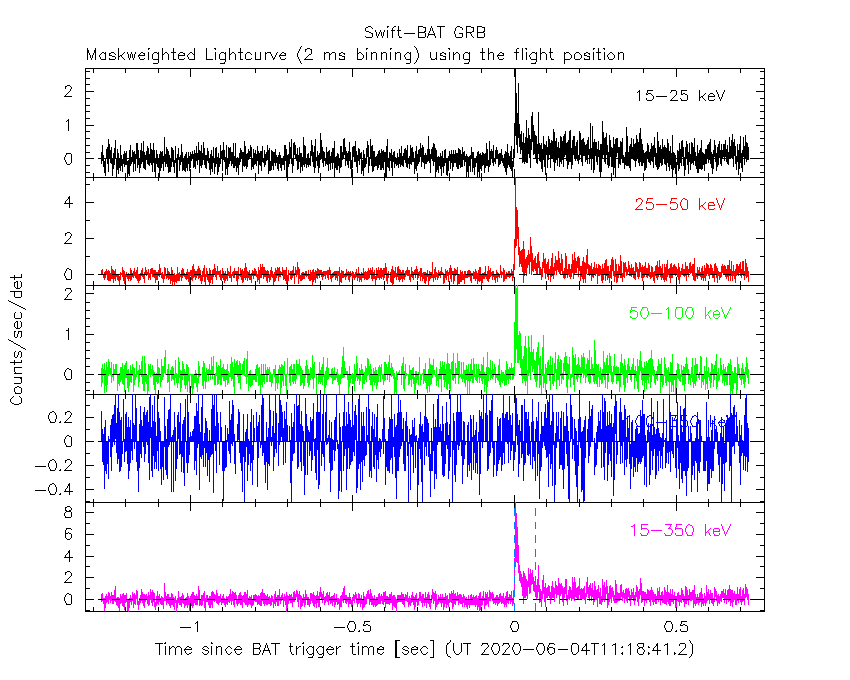
Blue+Cyan dotted lines: Time interval of the scaled map
From 0.000000 to 0.064000
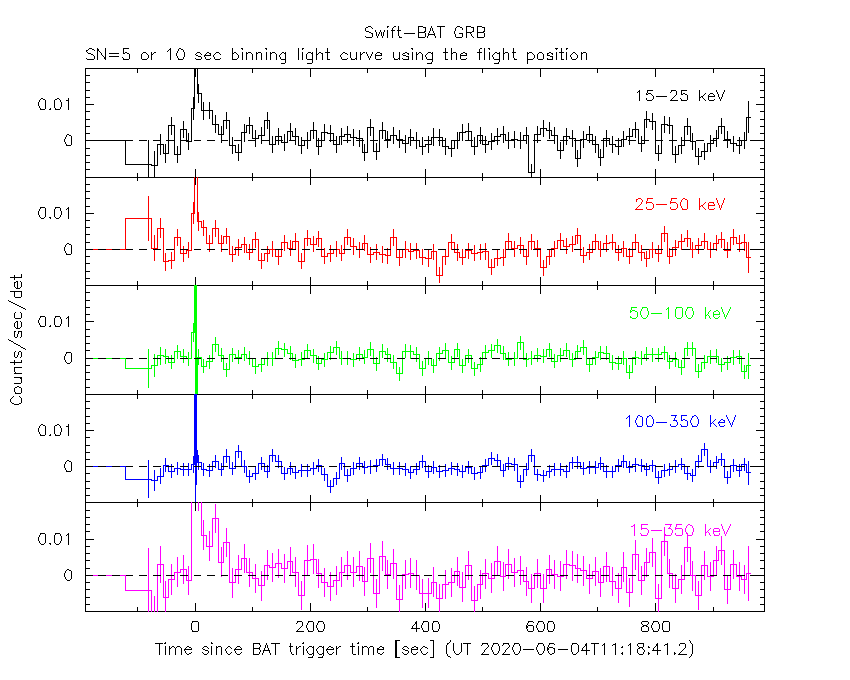
SN=5 or 10 sec. binning (whichever binning is satisfied first)
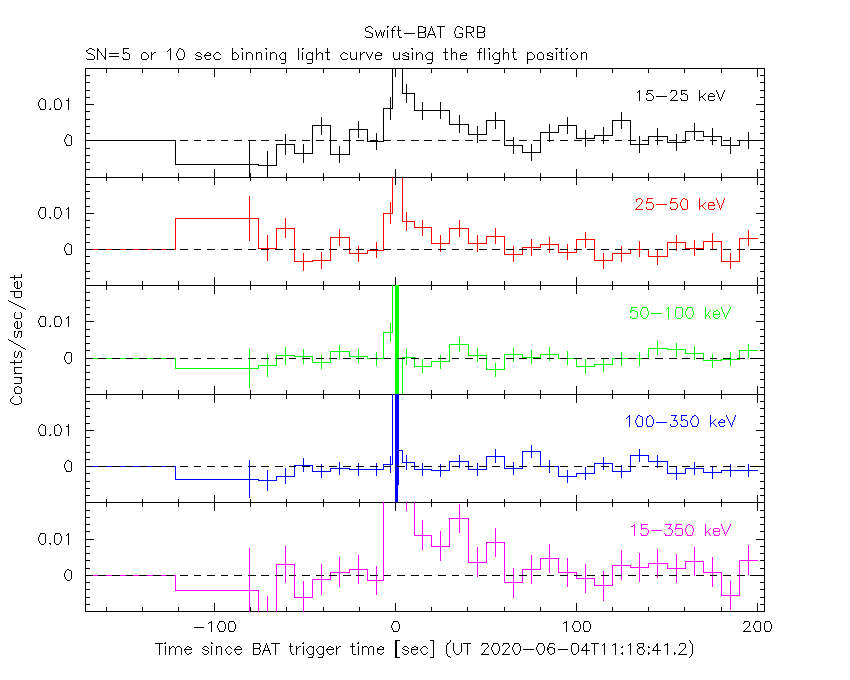
SN=5 or 10 sec. binning (T < 200 sec)
Spectra
Notes:
- 1) The fitting includes the systematic errors.
- 2) For long bursts, a spectral fit of the pre-slew DRM will introduce some errors in both a spectral shape and a normalization if the PHA file contains a lot of the slew/post-slew time interval.
- 3) For fits to more complicated models (e.g. a power-law over a cutoff power-law), the BAT team has decided to require a chi-square improvement of more than 6 for each extra dof.
- 4) For short bursts (T90<1sec), the specrtum is also fit with Blackbody, OTTB, and Double Blackbody.
Time averaged spectrum fit using the pre-slew DRM
Power-law model

Time interval is from   -0.276 sec. to   59.724 sec.

Spectral model in power-law:
------------------------------------------------------------
Parameters  : value       lower 90%   higher 90%
Photon index: 2.46094     ( -0.224119   0.242878 )
Norm@50keV  : 9.99723E-04    ( -0.000181704   0.000182297 )
------------------------------------------------------------
#Fit statistic : Chi-Squared =          57.44 using 59 PHA bins.
# Reduced chi-squared =          1.008 for     57 degrees of freedom
# Null hypothesis probability =   4.588468e-01

Photon flux (15-150 keV)    in 60 sec: 0.191786 ( -0.0216434  0.0216456 ) ph/cm2/s
Energy fluence (15-150 keV)             : 5.93698e-07 ( -8.20536e-08  8.53548e-08 ) ergs/cm2
Cutoff power-law model

Time interval is from   -0.276 sec. to   59.724 sec.
Spectral model in the cutoff power-law:
------------------------------------------------------------
Parameters  : value       lower 90%   higher 90%
Photon index: -0.865644     ( -2.45908   1.45644 )
Epeak [keV] : 28.4660      ( -4.38811 3.59064 )
Norm@50keV  : 0.151632    ( -0.185761   6.67968 )
------------------------------------------------------------
#Fit statistic : Chi-Squared =          41.22 using 59 PHA bins.
# Reduced chi-squared =         0.7360 for     56 degrees of freedom
# Null hypothesis probability =   9.303605e-01

Photon flux (15-150 keV)    in 60 sec: 0.179686 ( -0.021198  0.021311 ) ph/cm2/s
Energy fluence (15-150 keV)             : 4.87135e-07 ( -6.25278e-08  6.80232e-08 ) ergs/cm2
Band function

Time interval is from   -0.276 sec. to   59.724 sec.

Spectral model in the Band function:
------------------------------------------------------------
Parameters  : value       lower 90%   higher 90%
alpha       : 1.10426   ( -1.84277   -0.866056 )
beta        : -9.99866    ( 9.99866   0.0013684 )
Epeak [keV] : 28.6635      ( -3.02539 3.34911 )
Norm@50keV   : 0.218441    ( -0.023748   6.45711 )
------------------------------------------------------------
#Fit statistic : Chi-Squared =          41.15 using 59 PHA bins.
# Reduced chi-squared =         0.7483 for     55 degrees of freedom
# Null hypothesis probability =   9.170812e-01

Photon flux (15-150 keV)    in 60 sec:  (    ) ph/cm2/s
Energy fluence (15-150 keV)             : 4.72282e-07 ( -4.71862e-07  -7.338e-08 ) ergs/cm2
Single BB

Spectral model blackbody:
------------------------------------------------------------
Parameters  : value    Lower 90%  Upper 90%
kT [keV]    : 7.46775  (-0.731013  0.802545)
R^2/D10^2   : 0.291507  (-0.101309   0.1562)
(R is the radius in km and D10 is the distance to the source in units of 10 kpc)
------------------------------------------------------------
#Fit statistic : Chi-Squared =          41.28 using 59 PHA bins.
# Reduced chi-squared =         0.7242 for     57 degrees of freedom
# Null hypothesis probability =   9.419122e-01

Energy  Fluence     90% Error
[keV]   [erg/cm2]   [erg/cm2]
15- 25  1.668e-07   3.210e-08
25- 50  2.581e-07   3.939e-08
50-150  5.374e-08   2.069e-08
15-150  4.786e-07   7.368e-08
Thermal bremsstrahlung (OTTB)

Spectral model: thermal bremsstrahlung
------------------------------------------------------------
Parameters  : value         Lower 90%    Upper 90%
kT [keV]    : 30.7898       (-6.56968      9.1474)
Norm        : 1.53141       (-0.312947     0.405961)
------------------------------------------------------------
#Fit statistic : Chi-Squared =          47.56 using 59 PHA bins.
# Reduced chi-squared =         0.8345 for     57 degrees of freedom
# Null hypothesis probability =   8.090474e-01

Energy  Fluence     90% Error
[keV]   [erg/cm2]   [erg/cm2]
15- 25  1.895e-07   2.766e-08
25- 50  2.196e-07   3.288e-08
50-150  1.244e-07   4.716e-08
15-150  5.335e-07   8.541e-08
Double BB

# Reduced chi-squared =         0.7156 for     55 degrees of freedom
# Reduced chi-squared =         0.7146 for     55 degrees of freedom
# Reduced chi-squared =         0.7140 for     55 degrees of freedom
# Reduced chi-squared =         0.7137 for     55 degrees of freedom
# Reduced chi-squared =         0.7135 for     55 degrees of freedom
# Null hypothesis probability =   9.382481e-01
# Null hypothesis probability =   9.414330e-01
# Null hypothesis probability =   9.435312e-01
# Null hypothesis probability =   9.448590e-01
# Null hypothesis probability =   9.456104e-01
# Null hypothesis probability =   9.460309e-01
# Null hypothesis probability =   9.462544e-01
# Null hypothesis probability =   9.463912e-01

Energy  Fluence     90% Error
[keV]   [erg/cm2]   [erg/cm2]
15- 25  1.660e-07   3.555e-08
25- 50  2.566e-07   4.902e-08
50-150  5.853e-08   2.413e-08
15-150  4.811e-07   8.616e-08
Peak spectrum fit
Power-law model

Time interval is from   -0.276 sec. to    0.724 sec.

Spectral model in power-law:
------------------------------------------------------------
Parameters  : value       lower 90%   higher 90%
Photon index: 2.03425     (     )
Norm@50keV  : 2.17751E-02    (     )
------------------------------------------------------------
#Fit statistic : Chi-Squared =         133.52 using 59 PHA bins.
# Reduced chi-squared =         2.3425 for     57 degrees of freedom
# Null hypothesis probability =   4.419054e-08

Photon flux (15-150 keV)    in 1 sec: 3.31875 (    ) ph/cm2/s
Energy fluence (15-150 keV)             : 2.0124e-07 ( 0  0 ) ergs/cm2
Cutoff power-law model

Time interval is from   -0.276 sec. to    0.724 sec.
Spectral model in the cutoff power-law:
------------------------------------------------------------
Parameters  : value       lower 90%   higher 90%
Photon index: -1.47362     ( -0.991564   0.850221 )
Epeak [keV] : 38.4625      ( -2.15648 2.38841 )
Norm@50keV  : 2.78864    ( -2.78929   8.39163 )
------------------------------------------------------------
#Fit statistic : Chi-Squared =          54.22 using 59 PHA bins.
# Reduced chi-squared =         0.9682 for     56 degrees of freedom
# Null hypothesis probability =   5.425751e-01

Photon flux (15-150 keV)    in 1 sec: 3.22620 ( -0.22934  0.22982 ) ph/cm2/s
Energy fluence (15-150 keV)             : 1.74059e-07 ( -1.3292e-08  1.3756e-08 ) ergs/cm2
Band function

Time interval is from   -0.276 sec. to    0.724 sec.

Spectral model in the Band function:
------------------------------------------------------------
Parameters  : value       lower 90%   higher 90%
alpha       : 2.43045   ( -1.19871   2.51407 )
beta        : -3.65620    ( 3.84762   0.732211 )
Epeak [keV] : 36.2934      ( -2.73657 3.15632 )
Norm@50keV   : 12.4073    ( -11.2527   212.192 )
------------------------------------------------------------
#Fit statistic : Chi-Squared =          52.60 using 59 PHA bins.
# Reduced chi-squared =         0.9564 for     55 degrees of freedom
# Null hypothesis probability =   5.668829e-01

Photon flux (15-150 keV)    in 1 sec:  (    ) ph/cm2/s
Energy fluence (15-150 keV)             : 1.83399e-07 ( -1.83392e-07  -1.7812e-08 ) ergs/cm2
Single BB

Spectral model blackbody:
------------------------------------------------------------
Parameters  : value    Lower 90%  Upper 90%
kT [keV]    : 9.88263  (-0.546227  0.578469)
R^2/D10^2   : 1.86273  (-0.380017   0.469661)
(R is the radius in km and D10 is the distance to the source in units of 10 kpc)
------------------------------------------------------------
#Fit statistic : Chi-Squared =          54.82 using 59 PHA bins.
# Reduced chi-squared =         0.9618 for     57 degrees of freedom
# Null hypothesis probability =   5.571444e-01

Energy  Fluence     90% Error
[keV]   [erg/cm2]   [erg/cm2]
15- 25  3.690e-08   3.990e-09
25- 50  9.021e-08   6.315e-09
50-150  4.550e-08   7.720e-09
15-150  1.726e-07   1.280e-08
Thermal bremsstrahlung (OTTB)

Spectral model: thermal bremsstrahlung
------------------------------------------------------------
Parameters  : value         Lower 90%    Upper 90%
kT [keV]    : 56.8551       (-8.58813      10.3177)
Norm        : 18.7198       (-1.90601     1.98044)
------------------------------------------------------------
#Fit statistic : Chi-Squared =          95.96 using 59 PHA bins.
# Reduced chi-squared =          1.684 for     57 degrees of freedom
# Null hypothesis probability =   9.530390e-04

Energy  Fluence     90% Error
[keV]   [erg/cm2]   [erg/cm2]
15- 25  4.661e-08   4.445e-09
25- 50  6.976e-08   4.810e-09
50-150  7.583e-08   1.271e-08
15-150  1.922e-07   1.515e-08
Double BB

------------------------------------------------------------
Parameters  : value         Lower 90%    Upper 90%
kT1 [keV]   : 9.66700        (-9.45268      0.844813)
R1^2/D10^2  : 1.99668        (-0.546539      0.902219)
kT2 [keV]   : 193.098        (-190.782      -190.782)
R2^2/D10^2  : 5.52590E-05    (-5.59448e-05   2.33669)
------------------------------------------------------------
#Fit statistic : Chi-Squared =          53.14 using 59 PHA bins.
#Fit statistic : Chi-Squared =          52.98 using 59 PHA bins.
# Reduced chi-squared =         0.9661 for     55 degrees of freedom
# Reduced chi-squared =         0.9633 for     55 degrees of freedom
# Null hypothesis probability =   5.460859e-01
# Null hypothesis probability =   5.520693e-01

Energy  Fluence     90% Error
[keV]   [erg/cm2]   [erg/cm2]
15- 25  3.807e-08   4.600e-09
25- 50  8.882e-08   1.787e-08
50-150  5.570e-08   2.217e-08
15-150  1.826e-07   4.050e-08
Pre-slew spectrum (Pre-slew PHA with pre-slew DRM)
Power-law model

Spectral model in power-law:
------------------------------------------------------------
Parameters  : value       lower 90%   higher 90%
Photon index: 2.46094     ( -0.224119   0.242878 )
Norm@50keV  : 9.99723E-04    ( -0.000181704   0.000182297 )
------------------------------------------------------------
#Fit statistic : Chi-Squared =          57.44 using 59 PHA bins.
# Reduced chi-squared =          1.008 for     57 degrees of freedom
# Null hypothesis probability =   4.588468e-01

Photon flux (15-150 keV)    in 60 sec: 0.191786 ( -0.0216434  0.0216456 ) ph/cm2/s
Energy fluence (15-150 keV)             : 5.93698e-07 ( -8.20536e-08  8.53548e-08 ) ergs/cm2
Cutoff power-law model

Spectral model in the cutoff power-law:
------------------------------------------------------------
Parameters  : value       lower 90%   higher 90%
Photon index: -0.865644     ( -2.45908   1.45644 )
Epeak [keV] : 28.4660      ( -4.38811 3.59064 )
Norm@50keV  : 0.151632    ( -0.185761   6.67968 )
------------------------------------------------------------
#Fit statistic : Chi-Squared =          41.22 using 59 PHA bins.
# Reduced chi-squared =         0.7360 for     56 degrees of freedom
# Null hypothesis probability =   9.303605e-01

Photon flux (15-150 keV)    in 60 sec: 0.179686 ( -0.021198  0.021311 ) ph/cm2/s
Energy fluence (15-150 keV)             : 4.87135e-07 ( -6.25278e-08  6.80232e-08 ) ergs/cm2
Band function

Spectral model in the Band function:
------------------------------------------------------------
Parameters  : value       lower 90%   higher 90%
alpha       : 1.10426   ( -1.84277   -0.866056 )
beta        : -9.99866    ( 9.99866   0.00142787 )
Epeak [keV] : 28.6635      ( -3.02539 3.34911 )
Norm@50keV   : 0.218441    ( -0.023748   6.45711 )
------------------------------------------------------------
#Fit statistic : Chi-Squared =          41.15 using 59 PHA bins.
# Reduced chi-squared =         0.7483 for     55 degrees of freedom
# Null hypothesis probability =   9.170812e-01

Photon flux (15-150 keV)    in 60 sec:  (    ) ph/cm2/s
Energy fluence (15-150 keV)             : 4.72282e-07 ( -4.71862e-07  -7.338e-08 ) ergs/cm2
S(25-50 keV) vs. S(50-100 keV) plot

S(25-50 keV)  = 1.96e-07
S(50-100 keV) = 1.43e-07
T90 vs. Hardness ratio plot

T90                                   = 52 sec.
Hardness ratio (energy fluence ratio) = 0.729592
Color vs. Color plot

Count Ratio  (25-50 keV) / (15-25 keV) = 0.95551
Count Ratio (50-100 keV) / (15-25 keV) = 0.0954132
Mask shadow pattern

IMX = -1.255400537819071E-01, IMY = -2.267216342563589E-01
TIME vs. PHA plot around the trigger time

Blue+Cyan dotted lines: Time interval of the scaled map
From 0.000000 to 0.064000
TIME vs. DetID plot around the trigger time

Blue+Cyan dotted lines: Time interval of the scaled map
From 0.000000 to 0.064000
100 us light curve (15-350 keV)

Blue+Cyan dotted lines: Time interval of the scaled map
From 0.000000 to 0.064000
Spacecraft aspect plot

Bright source in the pre-burst/pre-slew/post-slew images
Pre-burst image of 15-350 keV band
Time interval of the image:
-28.975400 -0.276000

# RAcent  DECcent POSerr Theta    Phi  PeakCts   SNR AngSep     Name
#  [deg]    [deg]    ['] [deg]  [deg]                   [']
170.6316 -60.4902    0.0  40.0  -73.1   0.5450   2.2   12.3	Cen X-3
186.6345 -62.8348    1.3  32.1  -75.2   1.0728   9.1    3.9	GX 301-2
244.9659 -15.6478    1.7  33.6   67.8   0.8874   6.9    0.9	Sco X-1
255.9798 -37.7991    4.5  15.6  110.4   0.2002   2.6    2.7	4U 1700-377
256.4634 -36.5382    5.2  16.9  108.7   0.1711   2.2    7.0	GX 349+2
263.0060 -24.8094    5.9  29.8  104.2  -0.2110  -2.0    3.8	GX 1+4
264.9502 -44.4572    3.8  17.0  144.2   0.2200   3.0    8.9	4U 1735-44
270.1484 -25.0108    7.7  33.1  114.9   0.1918   1.5    8.4	GX 5-1
270.4260 -25.9221    0.0  32.5  116.2  -0.1210  -1.0   12.6	GRS 1758-258
275.9701 -30.2747    5.0  32.4  128.4   0.2758   2.3    6.0	H1820-303
285.0343 -24.9225  251.3  41.9  131.9  -0.0100  -0.0    0.2	HT1900.1-2455
262.9535 -33.8622    6.0  22.3  116.0   0.1443   1.9    2.4	GX 354-0
200.7998 -11.9164    2.4  49.7    5.0   0.7920   4.8 ------	UNKNOWN
176.7346 -20.0166    2.1  58.2  -23.6   2.3051   5.5 ------	UNKNOWN
  1.2057 -72.5765    2.3  51.6 -138.6   1.7993   5.1 ------	UNKNOWN
Pre-slew background subtracted image of 15-350 keV band
Time interval of the image:
-0.276000 59.724000

# RAcent  DECcent POSerr Theta    Phi  PeakCts   SNR AngSep     Name
#  [deg]    [deg]    ['] [deg]  [deg]                   [']
170.2042 -60.5094   14.1  40.2  -73.3  -0.4847  -0.8    7.6	Cen X-3
186.6688 -62.9031    5.1  32.1  -75.3  -0.6754  -2.2    8.0	GX 301-2
244.8950 -15.5984   12.6  33.6   67.7  -0.2833  -0.9    5.5	Sco X-1
255.8726 -37.6536    0.0  15.7  109.8   0.3090   1.7   12.6	4U 1700-377
256.3226 -36.5494    7.1  16.8  108.4  -0.2918  -1.6    9.3	GX 349+2
263.0818 -24.8038    4.1  29.8  104.3   0.7028   2.8    5.3	GX 1+4
264.7748 -44.4377    6.5  16.9  144.0  -0.3128  -1.8    1.6	4U 1735-44
270.1557 -24.9568   24.2  33.2  114.8  -0.1482  -0.5   10.1	GX 5-1
270.4494 -25.7405   12.6  32.7  116.1   0.2831   0.9    7.9	GRS 1758-258
276.0267 -30.3105    4.3  32.4  128.5  -0.7366  -2.7    6.3	H1820-303
285.1894 -24.9821    9.0  41.9  132.1   0.6204   1.3    9.1	HT1900.1-2455
262.8139 -33.9465    4.5  22.2  115.9  -0.4699  -2.5   11.0	GX 354-0
244.5678  -7.5795    2.4  41.6   66.2   3.2312   4.8 ------	UNKNOWN
228.2996 -19.9486    2.4  30.8   37.1   1.0962   4.8 ------	UNKNOWN
257.0892 -40.1341    1.3  14.5  119.0   1.5138   8.8 ------	UNKNOWN
168.9023 -52.4988    2.3  43.7  -62.5   3.3472   5.0 ------	UNKNOWN
Post-slew image of 15-350 keV band
Time interval of the image:
Plot creation:
Fri Jun  5 09:18:37 EDT 2020