Estimated redshift from machine learning (Ukwatta et al. 2016) - may take a few minutes to calcaulte
Image
Pre-slew 15-350 keV image (Event data; bkg subtracted)

#   RAcent  DECcent POSerr  Theta    Phi     Peak Cts     SNR  Name
  274.4900 -16.1537 0.0235    3.8  124.6       0.0184     8.1  TRIG_00980513
------------------------------------------

Foreground time interval of the image:
  0.000   0.008 (delta_t =   0.008 [sec])
Background time interval of the image:
-68.671  -4.172 (delta_t =  64.499 [sec])
Lightcurves
Notes:
- 1) All plots contain as much data as has been downloaded to date.
- 2) The mask-weighted light curves are using the flight position.
- 3) Multiple plots of different time binning/intervals are shown to cover all scenarios of short/long GRBs, rate/image triggers, and real/false positives.
- 4) For all the mask-weighted lightcurves, the y-axis units are counts/sec/det where a det is 0.4 x 0.4 = 0.16 sq cm.
- 5) The verticle lines correspond to following: green dotted lines are T50 interval, black dotted lines are T90 interval, blue solid line(s) is a spacecraft slew start time, and orange solid line(s) is a spacecraft slew end time.
- 6) Time of each bin is in the middle of the bin.
1 s binning
From T0-310 s to T0+310 s

From T100_start - 20 s to T100_end + 30 s

Full time interval

64 ms binning
Full time interval

From T100_start to T100_end

From T0-5 sec to T0+5 sec

16 ms binning
From T100_start-5 s to T100_start+5 s

Blue+Cyan dotted lines: Time interval of the scaled map
From 0.000000 to 0.008000
8 ms binning
From T100_start-3 s to T100_start+3 s

Blue+Cyan dotted lines: Time interval of the scaled map
From 0.000000 to 0.008000
2 ms binning
From T100_start-1 s to T100_start+1 s

Blue+Cyan dotted lines: Time interval of the scaled map
From 0.000000 to 0.008000
SN=5 or 10 sec. binning (whichever binning is satisfied first)

SN=5 or 10 sec. binning (T < 200 sec)

Spectra
Notes:
- 1) The fitting includes the systematic errors.
- 2) For long bursts, a spectral fit of the pre-slew DRM will introduce some errors in both a spectral shape and a normalization if the PHA file contains a lot of the slew/post-slew time interval.
- 3) For fits to more complicated models (e.g. a power-law over a cutoff power-law), the BAT team has decided to require a chi-square improvement of more than 6 for each extra dof.
- 4) For short bursts (T90<1sec), the specrtum is also fit with Blackbody, OTTB, and Double Blackbody.
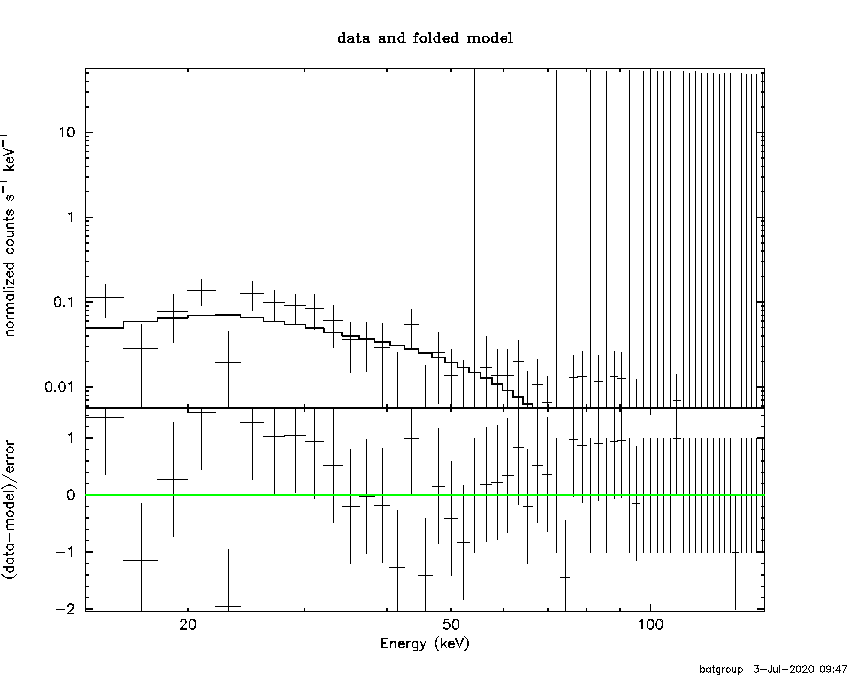
Time averaged spectrum fit using the pre-slew DRM
Power-law model

Time interval is from    0.000 sec. to    0.008 sec.

Spectral model in power-law:
------------------------------------------------------------
Parameters  : value       lower 90%   higher 90%
Photon index: 1.81451     ( -0.408096   0.444118 )
Norm@50keV  : 0.112093    ( -0.0343972   0.0332713 )
------------------------------------------------------------
#Fit statistic : Chi-Squared =          31.38 using 59 PHA bins.
# Reduced chi-squared =         0.5505 for     57 degrees of freedom
# Null hypothesis probability =   9.976980e-01

Photon flux (15-150 keV)    in 0.008 sec: 15.5339 ( -3.74255  3.74446 ) ph/cm2/s
Energy fluence (15-150 keV)             : 8.25168e-09 ( -2.4585e-09  2.62437e-09 ) ergs/cm2
Cutoff power-law model

Time interval is from    0.000 sec. to    0.008 sec.
Spectral model in the cutoff power-law:
------------------------------------------------------------
Parameters  : value       lower 90%   higher 90%
Photon index: -0.338192     ( -7.07789   2.53918 )
Epeak [keV] : 39.6415      ( -21.6178 22.639 )
Norm@50keV  : 2.56145    ( -3.77738   164209 )
------------------------------------------------------------
#Fit statistic : Chi-Squared =          29.14 using 59 PHA bins.
# Reduced chi-squared =         0.5204 for     56 degrees of freedom
# Null hypothesis probability =   9.988619e-01

Photon flux (15-150 keV)    in 0.008 sec: 14.9687 ( -3.5941  3.6271 ) ph/cm2/s
Energy fluence (15-150 keV)             : 6.52149e-09 ( -1.94646e-09  2.95259e-09 ) ergs/cm2
Band function

Time interval is from    0.000 sec. to    0.008 sec.

Spectral model in the Band function:
------------------------------------------------------------
Parameters  : value       lower 90%   higher 90%
alpha       : 4.98951   ( -14.3963   -4.98951 )
beta        : -2.89286    ( -2.671   0.889727 )
Epeak [keV] : 31.5540      ( -7.15271 5.51353 )
Norm@50keV   : 4544.26    ( -1044.8   15956.3 )
------------------------------------------------------------
#Fit statistic : Chi-Squared =          27.10 using 59 PHA bins.
# Reduced chi-squared =         0.4928 for     55 degrees of freedom
# Null hypothesis probability =   9.994306e-01

Photon flux (15-150 keV)    in 0.008 sec: 15.1004 ( -8.1004  -3.701 ) ph/cm2/s
Energy fluence (15-150 keV)             : 7.32436e-09 ( 0  0 ) ergs/cm2
Single BB
Spectral model blackbody:
------------------------------------------------------------
Parameters  : value    Lower 90%  Upper 90%
kT [keV]    : 9.60161  (-1.8973  2.40369)
R^2/D10^2   : 9.46406  (-5.52778   11.9176)
(R is the radius in km and D10 is the distance to the source in units of 10 kpc)
------------------------------------------------------------
#Fit statistic : Chi-Squared =          29.37 using 59 PHA bins.
# Reduced chi-squared =         0.5152 for     57 degrees of freedom
# Null hypothesis probability =   9.991055e-01

Energy  Fluence     90% Error
[keV]   [erg/cm2]   [erg/cm2]
15- 25  1.400e-09   5.732e-10
25- 50  3.283e-09   1.342e-09
50-150  1.521e-09   8.614e-10
15-150  6.204e-09   2.485e-09
Thermal bremsstrahlung (OTTB)

Spectral model: thermal bremsstrahlung
------------------------------------------------------------
Parameters  : value         Lower 90%    Upper 90%
kT [keV]    : 76.2783       (-38.1894      -76.2792)
Norm        : 75.3327       (-22.4663     31.7221)
------------------------------------------------------------
#Fit statistic : Chi-Squared =          30.32 using 59 PHA bins.
# Reduced chi-squared =         0.5319 for     57 degrees of freedom
# Null hypothesis probability =   9.985807e-01

Energy  Fluence     90% Error
[keV]   [erg/cm2]   [erg/cm2]
15- 25  1.558e-09   5.842e-10
25- 50  2.536e-09   1.255e-09
50-150  3.465e-09   2.916e-09
15-150  7.559e-09   4.419e-09
Double BB

#Fit statistic : Chi-Squared =          27.44 using 59 PHA bins.
# Reduced chi-squared =         0.5146 for     55 degrees of freedom
# Reduced chi-squared =         0.5034 for     55 degrees of freedom
# Reduced chi-squared =         0.5012 for     55 degrees of freedom
# Reduced chi-squared =         0.5000 for     55 degrees of freedom
# Reduced chi-squared =         0.4993 for     55 degrees of freedom
# Reduced chi-squared =         0.4989 for     55 degrees of freedom
# Null hypothesis probability =   9.989318e-01
# Null hypothesis probability =   9.992216e-01
# Null hypothesis probability =   9.992701e-01
# Null hypothesis probability =   9.992958e-01
# Null hypothesis probability =   9.993094e-01
# Null hypothesis probability =   9.993166e-01

Energy  Fluence     90% Error
[keV]   [erg/cm2]   [erg/cm2]
15- 25  1.562e-09   1.177e-09
25- 50  3.213e-09   2.668e-09
50-150  3.270e-09   2.551e-09
15-150  8.046e-09   6.416e-09
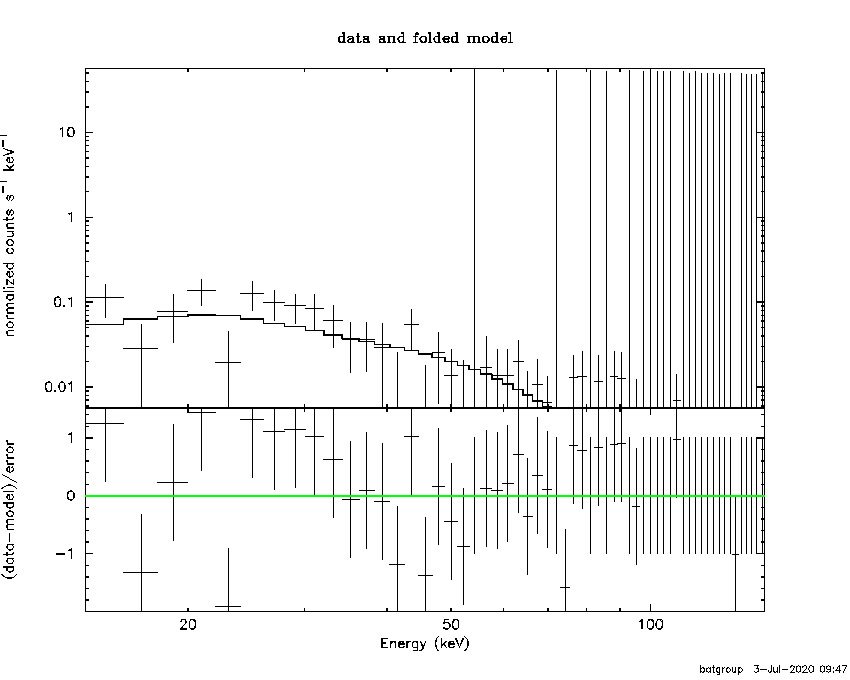
Peak spectrum fit
Power-law model

Time interval is from    0.000 sec. to    0.008 sec.

Spectral model in power-law:
------------------------------------------------------------
Parameters  : value       lower 90%   higher 90%
Photon index: 1.81451     ( -0.408096   0.444118 )
Norm@50keV  : 0.112093    ( -0.0343972   0.0332713 )
------------------------------------------------------------
#Fit statistic : Chi-Squared =          31.38 using 59 PHA bins.
# Reduced chi-squared =         0.5505 for     57 degrees of freedom
# Null hypothesis probability =   9.976980e-01

Photon flux (15-150 keV)    in 0.008 sec: 15.5339 ( -3.74255  3.74446 ) ph/cm2/s
Energy fluence (15-150 keV)             : 8.25168e-09 ( -2.4585e-09  2.62437e-09 ) ergs/cm2
Cutoff power-law model
Time interval is from    0.000 sec. to    0.008 sec.
Spectral model in the cutoff power-law:
------------------------------------------------------------
Parameters  : value       lower 90%   higher 90%
Photon index: -0.338192     ( -7.07789   2.53918 )
Epeak [keV] : 39.6415      ( -21.6178 22.6439 )
Norm@50keV  : 2.56145    ( -3.77738   164209 )
------------------------------------------------------------
#Fit statistic : Chi-Squared =          29.14 using 59 PHA bins.
# Reduced chi-squared =         0.5204 for     56 degrees of freedom
# Null hypothesis probability =   9.988619e-01

Photon flux (15-150 keV)    in 0.008 sec: 14.9687 ( -3.5941  3.6271 ) ph/cm2/s
Energy fluence (15-150 keV)             : 6.52149e-09 ( -1.94646e-09  2.95259e-09 ) ergs/cm2
Band function

Time interval is from    0.000 sec. to    0.008 sec.

Spectral model in the Band function:
------------------------------------------------------------
Parameters  : value       lower 90%   higher 90%
alpha       : 4.98951   ( -4.99395   -4.98951 )
beta        : -2.89286    ( -2.671   0.889727 )
Epeak [keV] : 31.5540      ( -7.15271 5.51353 )
Norm@50keV   : 4544.26    ( -1044.8   15956.3 )
------------------------------------------------------------
#Fit statistic : Chi-Squared =          27.10 using 59 PHA bins.
# Reduced chi-squared =         0.4928 for     55 degrees of freedom
# Null hypothesis probability =   9.994306e-01

Photon flux (15-150 keV)    in 0.008 sec: 15.1004 ( -8.1004  -3.701 ) ph/cm2/s
Energy fluence (15-150 keV)             : 7.32436e-09 ( 0  0 ) ergs/cm2
Single BB

Spectral model blackbody:
------------------------------------------------------------
Parameters  : value    Lower 90%  Upper 90%
kT [keV]    : 9.60161  (-1.8973  2.40369)
R^2/D10^2   : 9.46406  (-5.52778   11.9176)
(R is the radius in km and D10 is the distance to the source in units of 10 kpc)
------------------------------------------------------------
#Fit statistic : Chi-Squared =          29.37 using 59 PHA bins.
# Reduced chi-squared =         0.5152 for     57 degrees of freedom
# Null hypothesis probability =   9.991055e-01

Energy  Fluence     90% Error
[keV]   [erg/cm2]   [erg/cm2]
15- 25  1.400e-09   5.828e-10
25- 50  3.283e-09   1.283e-09
50-150  1.521e-09   8.746e-10
15-150  6.204e-09   2.494e-09
Thermal bremsstrahlung (OTTB)

Spectral model: thermal bremsstrahlung
------------------------------------------------------------
Parameters  : value         Lower 90%    Upper 90%
kT [keV]    : 76.2783       (-38.1894      -76.2792)
Norm        : 75.3327       (-22.4663     31.7221)
------------------------------------------------------------
#Fit statistic : Chi-Squared =          30.32 using 59 PHA bins.
# Reduced chi-squared =         0.5319 for     57 degrees of freedom
# Null hypothesis probability =   9.985807e-01

Energy  Fluence     90% Error
[keV]   [erg/cm2]   [erg/cm2]
15- 25  1.558e-09   5.862e-10
25- 50  2.536e-09   1.334e-09
50-150  3.465e-09   2.868e-09
15-150  7.559e-09   4.686e-09
Double BB

#Fit statistic : Chi-Squared =          27.44 using 59 PHA bins.
# Reduced chi-squared =         0.5146 for     55 degrees of freedom
# Reduced chi-squared =         0.5034 for     55 degrees of freedom
# Reduced chi-squared =         0.5012 for     55 degrees of freedom
# Reduced chi-squared =         0.5000 for     55 degrees of freedom
# Reduced chi-squared =         0.4993 for     55 degrees of freedom
# Reduced chi-squared =         0.4989 for     55 degrees of freedom
# Null hypothesis probability =   9.989318e-01
# Null hypothesis probability =   9.992216e-01
# Null hypothesis probability =   9.992701e-01
# Null hypothesis probability =   9.992958e-01
# Null hypothesis probability =   9.993094e-01
# Null hypothesis probability =   9.993166e-01

Energy  Fluence     90% Error
[keV]   [erg/cm2]   [erg/cm2]
15- 25  1.562e-09   1.230e-09
25- 50  3.213e-09   2.988e-09
50-150  3.270e-09   2.772e-09
15-150  8.046e-09   5.720e-09
Pre-slew spectrum (Pre-slew PHA with pre-slew DRM)
Power-law model
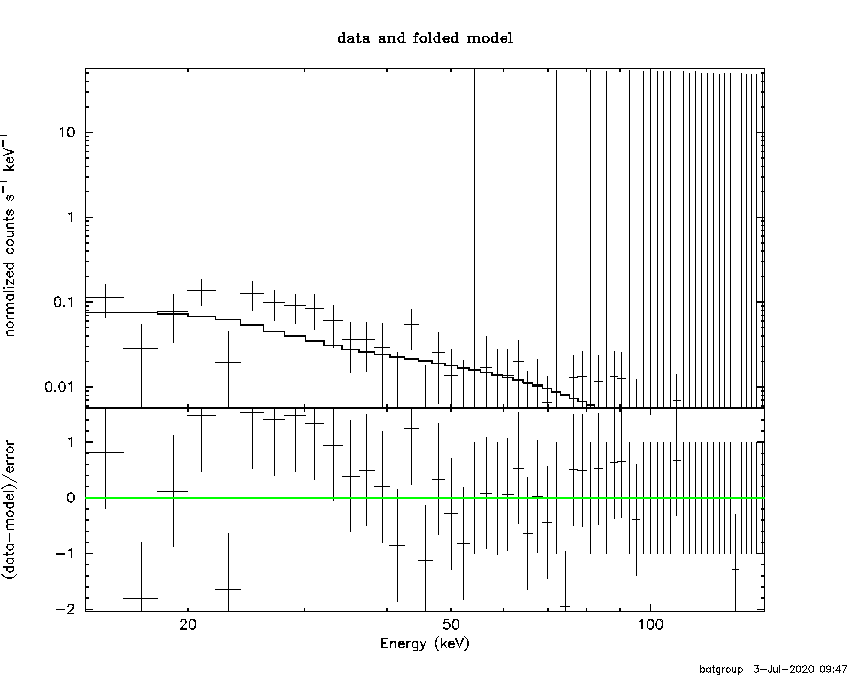
Spectral model in power-law:
------------------------------------------------------------
Parameters  : value       lower 90%   higher 90%
Photon index: 1.81451     ( -0.408096   0.444118 )
Norm@50keV  : 0.112093    ( -0.0343972   0.0332713 )
------------------------------------------------------------
#Fit statistic : Chi-Squared =          31.38 using 59 PHA bins.
# Reduced chi-squared =         0.5505 for     57 degrees of freedom
# Null hypothesis probability =   9.976980e-01

Photon flux (15-150 keV)    in 0.008 sec: 15.5339 ( -3.74255  3.74446 ) ph/cm2/s
Energy fluence (15-150 keV)             : 8.25168e-09 ( -2.4585e-09  2.62437e-09 ) ergs/cm2
Cutoff power-law model

Spectral model in the cutoff power-law:
------------------------------------------------------------
Parameters  : value       lower 90%   higher 90%
Photon index: -0.338192     ( -7.07789   2.53918 )
Epeak [keV] : 39.6415      ( -21.6178 22.6434 )
Norm@50keV  : 2.56145    ( -3.77738   164209 )
------------------------------------------------------------
#Fit statistic : Chi-Squared =          29.14 using 59 PHA bins.
# Reduced chi-squared =         0.5204 for     56 degrees of freedom
# Null hypothesis probability =   9.988619e-01

Photon flux (15-150 keV)    in 0.008 sec: 14.9687 ( -3.5941  3.6271 ) ph/cm2/s
Energy fluence (15-150 keV)             : 6.52149e-09 ( -1.94646e-09  2.95259e-09 ) ergs/cm2
Band function

Spectral model in the Band function:
------------------------------------------------------------
Parameters  : value       lower 90%   higher 90%
alpha       : 4.98951   ( -5.8789   -4.98951 )
beta        : -2.89286    ( -2.671   0.889727 )
Epeak [keV] : 31.5540      ( -7.15271 5.51353 )
Norm@50keV   : 4544.26    ( -1044.8   15956.3 )
------------------------------------------------------------
#Fit statistic : Chi-Squared =          27.10 using 59 PHA bins.
# Reduced chi-squared =         0.4928 for     55 degrees of freedom
# Null hypothesis probability =   9.994306e-01

Photon flux (15-150 keV)    in 0.008 sec: 15.1004 ( -8.1004  -3.701 ) ph/cm2/s
Energy fluence (15-150 keV)             : 7.32436e-09 ( 0  0 ) ergs/cm2
S(25-50 keV) vs. S(50-100 keV) plot

S(25-50 keV)  = 2.34e-09
S(50-100 keV) = 2.66e-09
T90 vs. Hardness ratio plot

T90                                   = 0.00799989700317383 sec.
Hardness ratio (energy fluence ratio) = 1.13675
Color vs. Color plot

Count Ratio  (25-50 keV) / (15-25 keV) = 1.37433
Count Ratio (50-100 keV) / (15-25 keV) = 0.400506
Mask shadow pattern

IMX = -3.730330395700655E-02, IMY = -5.403735066747732E-02
TIME vs. PHA plot around the trigger time

Blue+Cyan dotted lines: Time interval of the scaled map
From 0.000000 to 0.008000
TIME vs. DetID plot around the trigger time
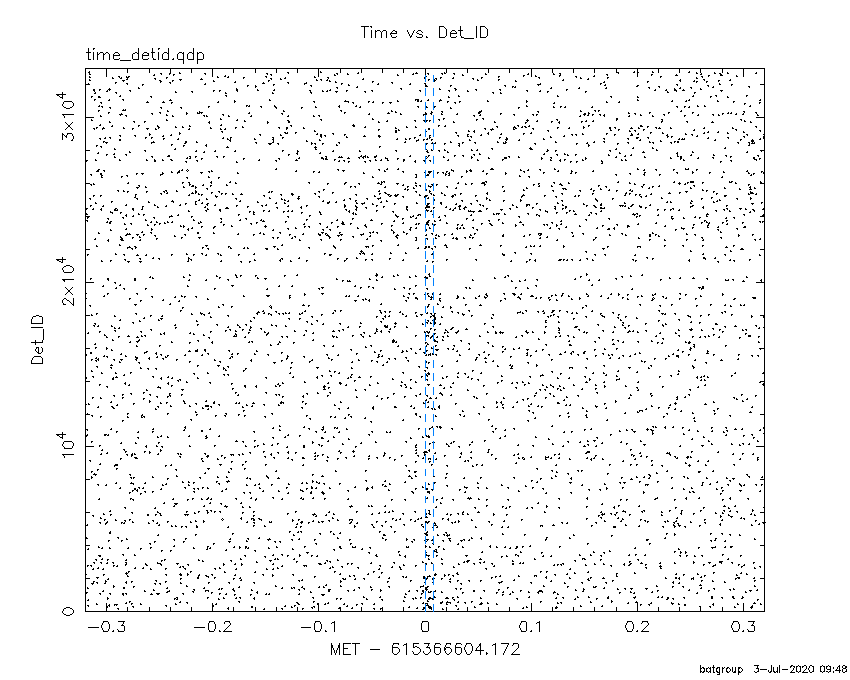
Blue+Cyan dotted lines: Time interval of the scaled map
From 0.000000 to 0.008000
100 us light curve (15-350 keV)

Blue+Cyan dotted lines: Time interval of the scaled map
From 0.000000 to 0.008000
Spacecraft aspect plot

Bright source in the pre-burst/pre-slew/post-slew images
Pre-burst image of 15-350 keV band
Time interval of the image:
-68.671400 -4.172000

# RAcent  DECcent POSerr Theta    Phi  PeakCts   SNR AngSep     Name
#  [deg]    [deg]    ['] [deg]  [deg]                   [']
244.9727 -15.6553    0.8  25.7 -103.0   2.2974  14.6    1.0	Sco X-1
254.6238  35.4633    4.1  51.7  -23.0   0.9464   2.8   10.9	Her X-1
256.1391 -37.8649    5.7  27.7 -158.7   0.2886   2.0    7.3	4U 1700-377
256.4548 -36.3354    5.1  26.3 -157.3   0.3027   2.3    5.3	GX 349+2
263.1897 -24.6216  209.1  13.4 -150.9  -0.0065  -0.1   12.3	GX 1+4
264.5767 -44.5823    6.5  31.4 -176.0   0.2433   1.8   10.7	4U 1735-44
268.2764  -1.5941   10.0  12.6  -20.4  -0.1271  -1.2   10.1	SW J1753.5-0127
270.3456 -25.1293    2.3  11.4  179.8   0.5551   5.2    4.5	GX 5-1
270.1826 -25.6803    5.5  12.0 -179.7   0.2557   2.3    7.5	GRS 1758-258
273.9925 -14.1856    4.0   2.5   94.9   0.3164   2.9    9.0	GX 17+2
275.8440 -30.3573    4.0  17.1  161.7   0.3562   2.9    4.2	H1820-303
285.1930 -25.0655    0.0  17.1  127.9  -0.1554  -1.2   12.2	HT1900.1-2455
288.8835  10.9180    6.1  30.1   30.3   0.2976   1.9    5.3	GRS 1915+105
263.1307 -34.0068    0.0  21.6 -166.3   0.3026   2.7   12.5	GX 354-0
303.3011  17.4199    2.5  44.2   40.7   1.4169   4.6 ------	UNKNOWN
Pre-slew background subtracted image of 15-350 keV band
Time interval of the image:
0.000000 0.008000

# RAcent  DECcent POSerr Theta    Phi  PeakCts   SNR AngSep     Name
#  [deg]    [deg]    ['] [deg]  [deg]                   [']
245.1574 -15.5418    0.0  25.5 -102.8  -0.0056  -1.7   11.9	Sco X-1
254.4616  35.3893    5.3  51.7  -23.2   0.0155   2.2    2.8	Her X-1
256.0435 -37.7031   11.6  27.6 -158.4  -0.0023  -1.0    8.9	4U 1700-377
256.5485 -36.3670    8.4  26.3 -157.5   0.0032   1.4    6.4	GX 349+2
263.1480 -24.9108    5.6  13.6 -151.5  -0.0046  -2.1   12.5	GX 1+4
264.8904 -44.6194    0.0  31.4 -176.4  -0.0015  -0.6   12.0	4U 1735-44
268.4977  -1.6152    0.0  12.5  -19.4   0.0014   0.6   12.5	SW J1753.5-0127
270.1057 -25.2132    0.0  11.5 -179.1   0.0055   2.3   12.6	GX 5-1
270.3140 -25.8908    7.8  12.2  179.6  -0.0036  -1.5    8.9	GRS 1758-258
274.0010 -14.0261 2700.0   2.4   91.2  -0.0000  -0.0    0.7	GX 17+2
275.7696 -30.2378    4.5  16.9  161.8   0.0061   2.6   11.2	H1820-303
285.0148 -25.0664    4.9  17.0  128.2   0.0055   2.3    8.8	HT1900.1-2455
288.8864  11.0794    4.5  30.2   30.2   0.0075   2.6    9.6	GRS 1915+105
262.8209 -33.9453    6.2  21.7 -165.6   0.0042   1.9   10.7	GX 354-0
293.7056  35.4486    2.8  53.5   17.1   0.0467   4.1 ------	UNKNOWN
274.4902 -16.1536    1.4   3.8  124.6   0.0183   8.0 ------	UNKNOWN
Post-slew image of 15-350 keV band
Time interval of the image:
62.328600 185.198000
185.828000 321.148000
321.828000 322.488000
323.828000 719.628000
720.828000 764.068000
764.828000 845.528600

# RAcent  DECcent POSerr Theta    Phi  PeakCts   SNR AngSep     Name
#  [deg]    [deg]    ['] [deg]  [deg]                   [']
244.9941 -15.6490    0.5  28.4 -138.7  25.3717  25.5    1.0	Sco X-1
256.1037 -37.8529    6.0  27.1  167.7   1.8297   1.9    5.6	4U 1700-377
256.3595 -36.5159   19.9  26.0  169.3   0.4968   0.6    6.7	GX 349+2
262.8085 -24.7626    4.9  13.9 -175.6   1.8163   2.4   11.0	GX 1+4
264.6055 -44.5577    7.9  29.6  148.8   1.8479   1.5    8.7	4U 1735-44
268.4535  -1.4754    6.4  15.8  -68.2  -1.5841  -1.8    5.3	SW J1753.5-0127
270.3500 -25.0932    2.5   9.7  157.3   3.5179   4.5    3.7	GX 5-1
270.3622 -25.7858    3.1  10.4  155.6   2.8959   3.7    4.1	GRS 1758-258
274.0305 -14.1311    3.8   2.1  -58.3   2.5464   3.0    5.9	GX 17+2
275.9297 -30.3238    3.5  14.2  129.4   2.7767   3.3    2.6	H1820-303
285.2663 -24.9116    0.0  13.3   87.2  -0.7178  -0.8   12.5	HT1900.1-2455
288.5880  10.9341    0.0  30.5  -17.4  -0.1009  -0.1   12.4	GRS 1915+105
299.4333  35.2440    5.2  56.6  -21.2   7.1425   2.2    8.1	Cyg X-1
263.0321 -33.6754    3.7  20.3  162.9   2.4006   3.1    9.8	GX 354-0
321.8649  -8.0194    3.4  46.9   40.3   8.1658   3.4 ------	UNKNOWN
323.1155  12.0958    3.6  55.8   17.0  12.9315   3.2 ------	UNKNOWN
215.1162 -27.8881    3.2  55.8 -158.6  13.5572   3.6 ------	UNKNOWN
233.7973   1.1865    2.5  43.8 -116.0  15.9808   4.6 ------	UNKNOWN
269.3600  31.5163    3.7  47.9  -51.4  11.4446   3.1 ------	UNKNOWN
Plot creation:
Fri Jul  3 09:48:49 EDT 2020