Estimated redshift from machine learning (Ukwatta et al. 2016) - may take a few minute to calcaulte
Image
Pre-slew 15.0-350.0 keV image (Event data)
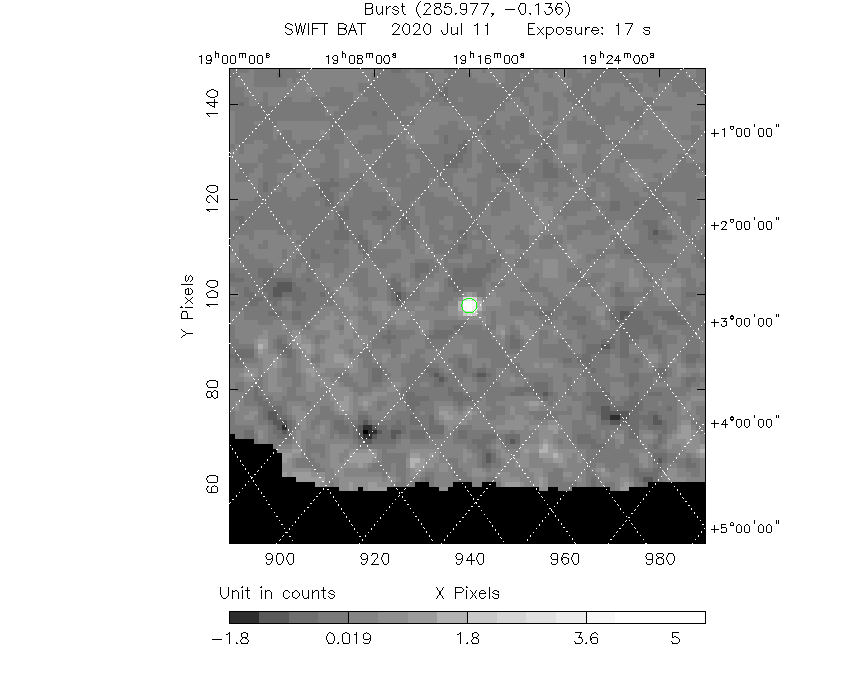
#   RAcent    DECcent   POSerr    Theta     Phi              Peak Cts       SNR   Name
  285.9741    -0.1348   0.0111    38.8815    99.0328         5.6639932     17.450 TRIG_00981957

Foreground time interval of the image:
 -4.720  12.541 (delta_t =  17.261 [sec])
Background time interval of the image:
-239.760  -4.720 (delta_t = 235.040 [sec])
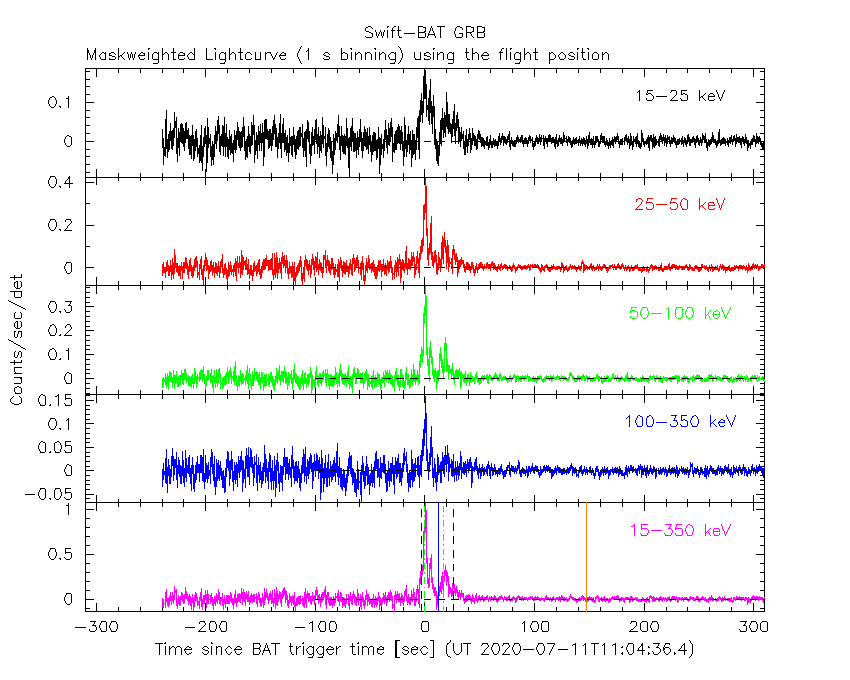
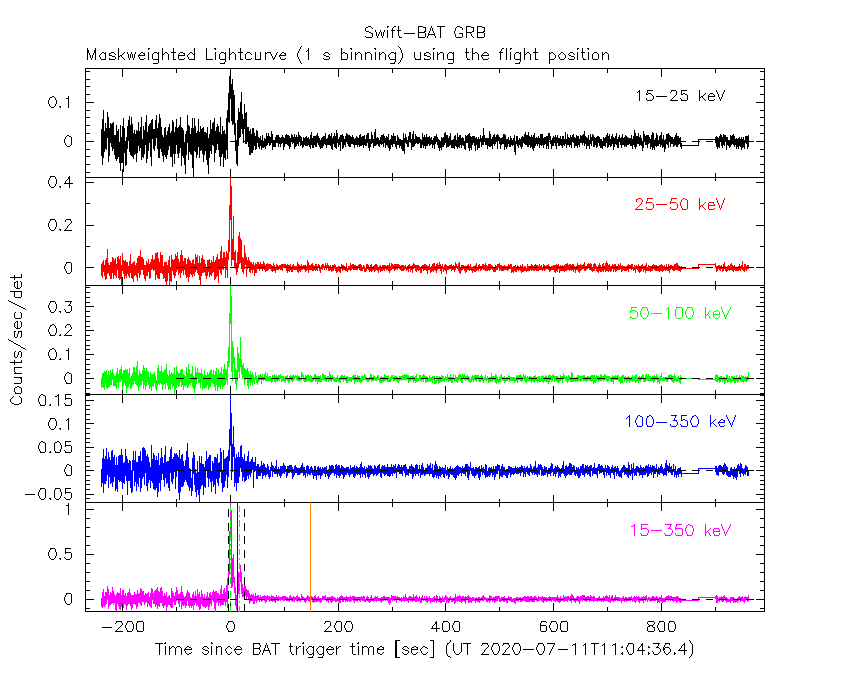
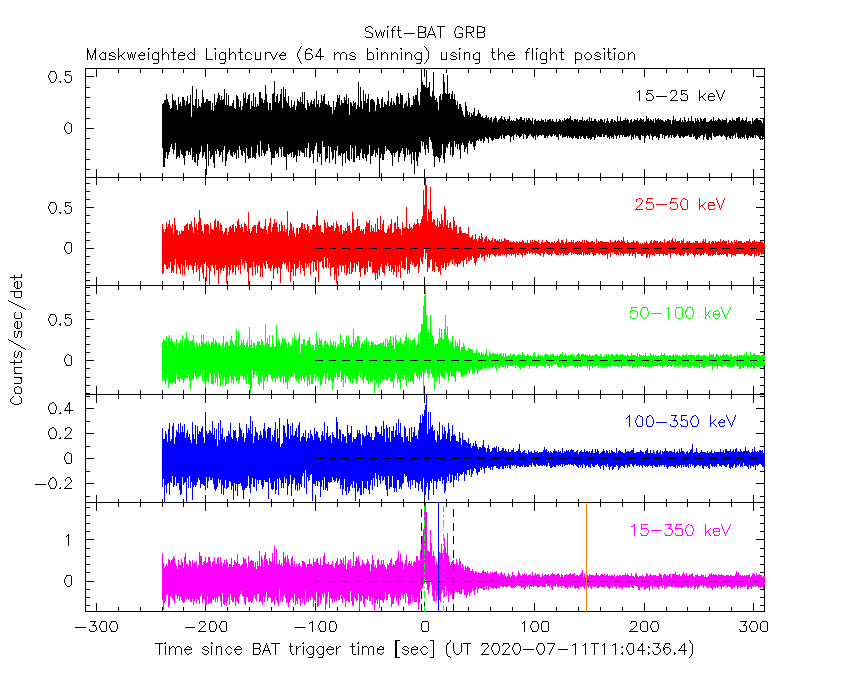
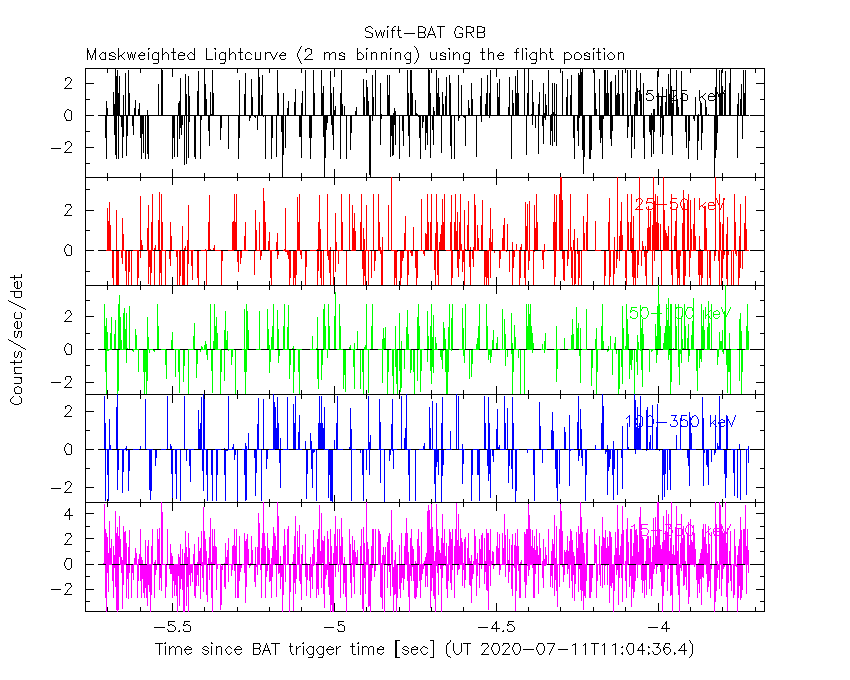
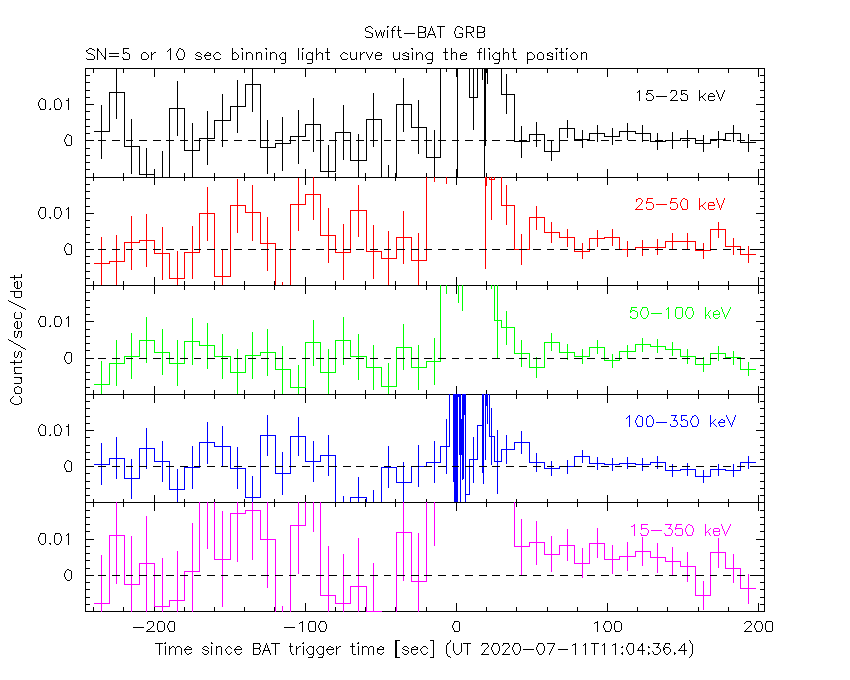
Lightcurves
Notes:
- 1) The mask-weighted light curves are using the flight position.
- 2) Multiple plots of different time binning/intervals are shown to cover all scenarios of short/long GRBs, rate/image triggers, and real/false positives.
- 3) For all the mask-weighted lightcurves, the y-axis units are counts/sec/det where a det is 0.4 x 0.4 = 0.16 sq cm.
- 4) The verticle lines correspond to following: green dotted lines are T50 interval, black dotted lines are T90 interval, blue solid line(s) is a spacecraft slew start time, and orange solid line(s) is a spacecraft slew end time.
- 5) Time of each bin is in the middle of the bin.
1 s binning
From T0-310 s to T0+310 s
From T100_start - 20 s to T100_end + 30 s

Full time interval
64 ms binning
Full time interval
From T100_start to T100_end

From T0-5 sec to T0+5 sec

16 ms binning
From T100_start-5 s to T100_start+5 s

8 ms binning
From T100_start-3 s to T100_start+3 s

2 ms binning
From T100_start-1 s to T100_start+1 s
SN=5 or 10 sec. binning (whichever binning is satisfied first)

SN=5 or 10 sec. binning (T < 200 sec)
Quad-rate summed light curves (from T0-300s to T0+1000s)

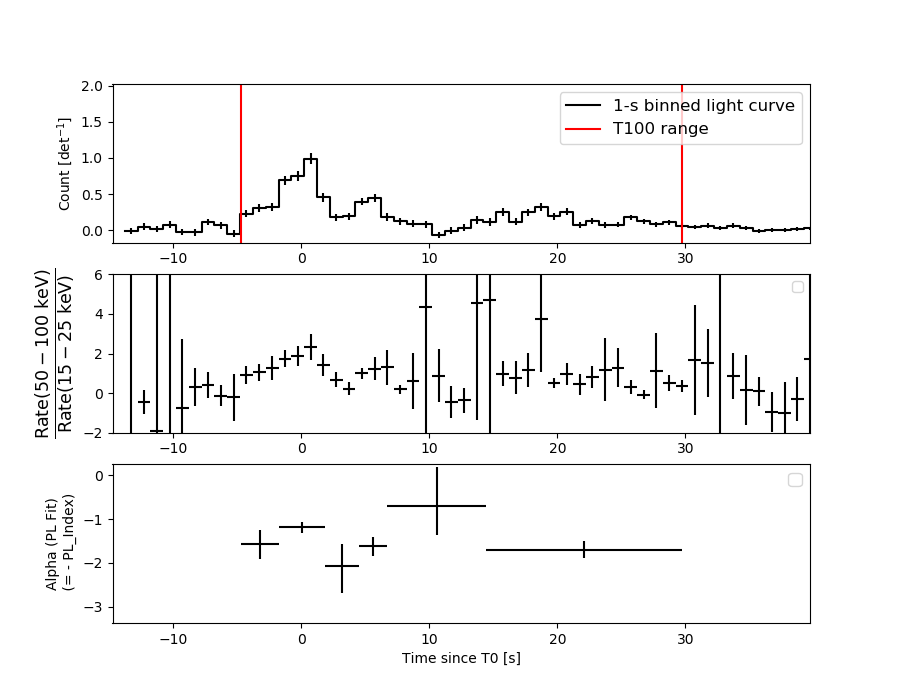
Spectral Evolution
Spectra
Notes:
- 1) The fitting includes the systematic errors.
- 2) When the burst includes telescope slew time periods, the fitting uses an average response file made from multiple 5-s response files through out the slew time plus single time preiod for the non-slew times, and weighted by the total counts in the corresponding time period using addrmf. An average response file is needed becuase a spectral fit using the pre-slew DRM will introduce some errors in both a spectral shape and a normalization if the PHA file contains a lot of the slew/post-slew time interval.
- 3) For fits to more complicated models (e.g. a power-law over a cutoff power-law), the BAT team has decided to require a chi-square improvement of more than 6 for each extra dof.
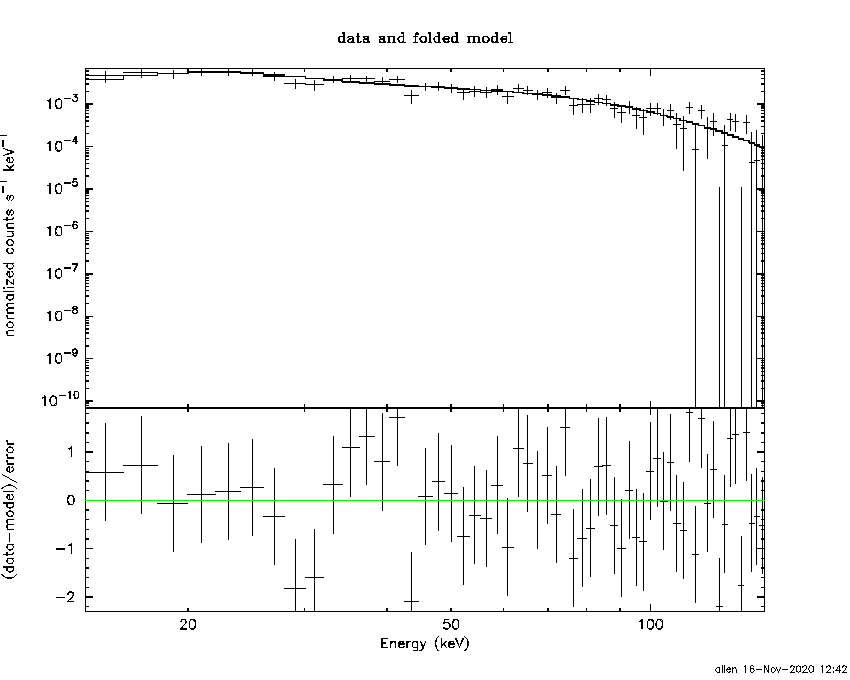
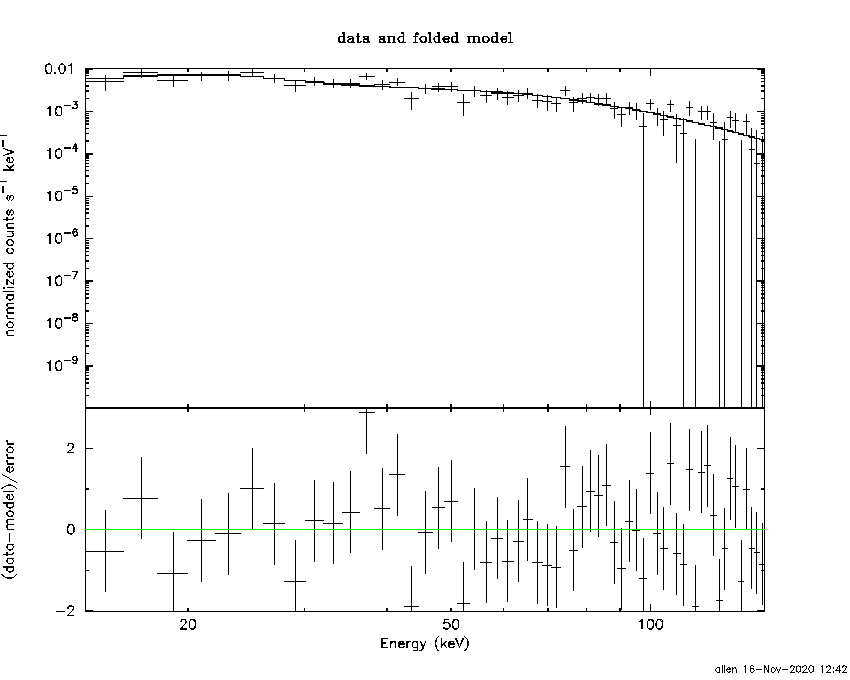
Time averaged spectrum fit using the average DRM
Power-law model

Time interval is from   -4.720 sec. to   29.728 sec.

Spectral model in power-law:
------------------------------------------------------------
Parameters  : value       lower 90%   higher 90%
Photon index: 1.41368     ( -0.10433   0.104275 )
Norm@50keV  : 1.58911E-02    ( -0.000950656   0.000950244 )
------------------------------------------------------------
#Fit statistic  : Chi-Squared                   55.78     using 59 bins.
 Reduced chi-squared = 0.978596
# Null hypothesis probability of 5.21e-01 with 57 degrees of freedom

Photon flux (15-150 keV)    in 34.45 sec: 1.94137 ( -0.12232  0.12259 ) ph/cm2/s
Energy fluence (15-150 keV)             : 5.27595e-06 ( -3.39675e-07  3.40726e-07 ) ergs/cm2
Cutoff power-law model

Time interval is from   -4.720 sec. to   29.728 sec.
Spectral model in the cutoff power-law:
------------------------------------------------------------
Parameters  : value       lower 90%   higher 90%
Photon index: 1.09360     ( -0.439506   0.362882 )
Epeak [keV] : 152.810      ( -59.3132 -152.81 )
Norm@50keV  : 2.25422E-02    ( -0.00712475   0.0133557 )
------------------------------------------------------------
#Fit statistic  : Chi-Squared                   53.94     using 59 bins.
 Reduced chi-squared = 0.963214
# Null hypothesis probability of 5.53e-01 with 56 degrees of freedom

Photon flux (15-150 keV)    in 34.45 sec: 1.91208 ( -0.12759  0.12774 ) ph/cm2/s
Energy fluence (15-150 keV)             : 2.50639e-06 ( -4.60187e-07  4.49476e-06 ) ergs/cm2
Band function

Time interval is from   -4.720 sec. to   29.728 sec.


Spectral model in the Band function:
------------------------------------------------------------
Parameters  : value       lower 90%   higher 90%
alpha       :    (     )
beta        :     (     )
Epeak [keV] :       (   )
Norm@50keV   :     (     )
------------------------------------------------------------

Photon flux (15-150 keV)    in  sec:  (    ) ph/cm2/s
Energy fluence (15-150 keV)             : 0 ( 0  0 ) ergs/cm2
Single BB
Spectral model blackbody:
------------------------------------------------------------
Parameters  : value    Lower 90%  Upper 90%
kT [keV]    : 17.0477  (-1.28255  1.41597)
R^2/D10^2   : 0.144209  (-0.0349438   0.0452998)
(R is the radius in km and D10 is the distance to the source in units of 10 kpc)
------------------------------------------------------------
#Fit statistic  : Chi-Squared                  110.96     using 59 bins.
 Reduced chi-squared =
# Null hypothesis probability of 2.48e-05 with 57 degrees of freedom

Energy  Fluence     90% Error
[keV]   [erg/cm2]   [erg/cm2]
15- 25  2.938e-07   3.665e-08
25- 50  1.303e-06   1.156e-07
50-150  2.706e-06   3.037e-07
15-150  4.303e-06   3.135e-07
Thermal bremsstrahlung (OTTB)

Spectral model: thermal bremsstrahlung
------------------------------------------------------------
Parameters  : value         Lower 90%    Upper 90%
kT [keV]    : 200.000       (-20.5511      -200)
Norm        : 8.07922       (-0.483642     0.483642)
------------------------------------------------------------
#Fit statistic  : Chi-Squared                   60.21     using 59 bins.
 Reduced chi-squared =
# Null hypothesis probability of 3.60e-01 with 57 degrees of freedom

Energy  Fluence     90% Error
[keV]   [erg/cm2]   [erg/cm2]
15- 25  6.931e-07   4.823e-08
25- 50  1.333e-06   1.061e-07
50-150  2.924e-06   5.362e-07
15-150  4.950e-06   6.597e-07
Double BB
Spectral model: bbodyrad<1> + bbodyrad<2>
------------------------------------------------------------
Parameters  : value         Lower 90%    Upper 90%
kT1 [keV]   : 7.59876        (-1.65329      1.87526)
R1^2/D10^2  : 1.38154        (-0.684831      1.79883)
kT2 [keV]   : 28.1961        (-4.9217      8.82616)
R2^2/D10^2  : 2.05076E-02    (-0.0125422   0.0211729)
------------------------------------------------------------
#Fit statistic  : Chi-Squared                   54.77     using 59 bins.
 Reduced chi-squared =
# Null hypothesis probability of 4.84e-01 with 55 degrees of freedom

Energy  Fluence     90% Error
[keV]   [erg/cm2]   [erg/cm2]
15- 25  5.682e-07   1.605e-07
25- 50  1.310e-06   2.933e-07
50-150  3.313e-06   9.343e-07
15-150  5.191e-06   1.392e-06
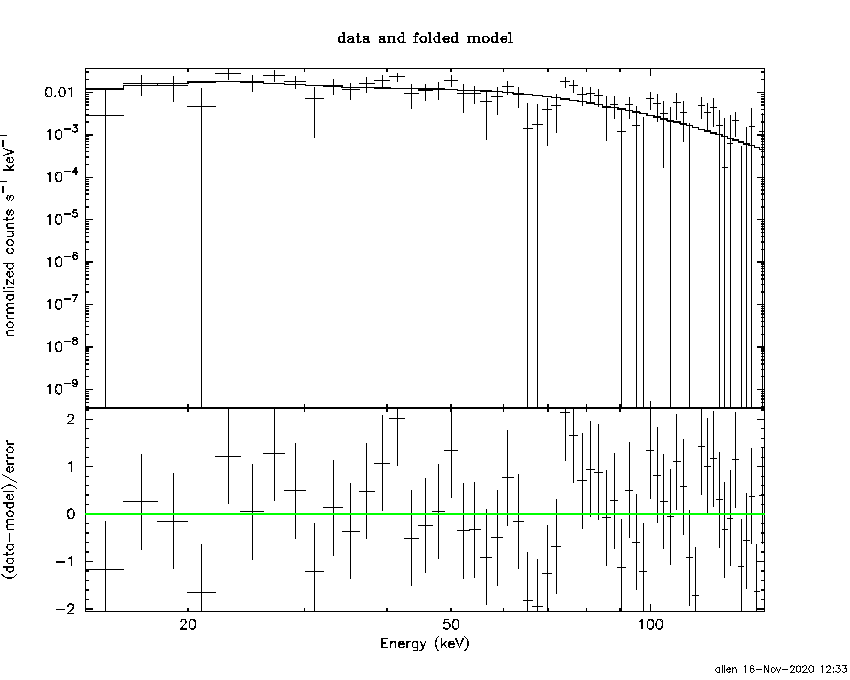
Peak spectrum fit
Power-law model

Time interval is from    0.196 sec. to    1.196 sec.

Spectral model in power-law:
------------------------------------------------------------
Parameters  : value       lower 90%   higher 90%
Photon index: 1.12337     ( -0.208574   0.205951 )
Norm@50keV  : 6.62785E-02    ( -0.00847921   0.00847891 )
------------------------------------------------------------
#Fit statistic  : Chi-Squared                   62.81     using 59 bins.
 Reduced chi-squared = 1.10193
# Null hypothesis probability of 2.78e-01 with 57 degrees of freedom

Photon flux (15-150 keV)    in 1 sec: 0.260764 ( 0.046159  0.209152 ) ph/cm2/s
Energy fluence (15-150 keV)             : 6.87939e-07 ( -9.72621e-08  9.80745e-08 ) ergs/cm2
Cutoff power-law model
Time interval is from    0.196 sec. to    1.196 sec.
Spectral model in the cutoff power-law:
------------------------------------------------------------
Parameters  : value       lower 90%   higher 90%
Photon index: 0.120707     ( -1.11745   0.875767 )
Epeak [keV] : 99.8760      ( -27.8643 267.911 )
Norm@50keV  : 0.200694    ( -0.122786   0.477005 )
------------------------------------------------------------
#Fit statistic  : Chi-Squared                   58.89     using 59 bins.
 Reduced chi-squared = 1.05161
# Null hypothesis probability of 3.70e-01 with 56 degrees of freedom

Photon flux (15-150 keV)    in 1 sec: 7.47820 ( -1.02255  1.02361 ) ph/cm2/s
Energy fluence (15-150 keV)             : 6.49935e-07 ( -1.07659e-07  1.0648e-07 ) ergs/cm2
Band function

Time interval is from    0.196 sec. to    1.196 sec.


Spectral model in the Band function:
------------------------------------------------------------
Parameters  : value       lower 90%   higher 90%
alpha       :    (     )
beta        :     (     )
Epeak [keV] :       (   )
Norm@50keV   :     (     )
------------------------------------------------------------

Photon flux (15-150 keV)    in  sec:  (    ) ph/cm2/s
Energy fluence (15-150 keV)             : 0 ( 0  0 ) ergs/cm2
Single BB

Spectral model blackbody:
------------------------------------------------------------
Parameters  : value    Lower 90%  Upper 90%
kT [keV]    : 18.3088  (-2.66851  3.31704)
R^2/D10^2   : 0.501516  (-0.211417   0.340393)
(R is the radius in km and D10 is the distance to the source in units of 10 kpc)
------------------------------------------------------------
#Fit statistic  : Chi-Squared                   64.02     using 59 bins.
 Reduced chi-squared =
# Null hypothesis probability of 2.44e-01 with 57 degrees of freedom

Energy  Fluence     90% Error
[keV]   [erg/cm2]   [erg/cm2]
15- 25  3.347e-08   8.495e-09
25- 50  1.568e-07   3.220e-08
50-150  3.831e-07   9.005e-08
15-150  5.733e-07   1.044e-07
Thermal bremsstrahlung (OTTB)

Spectral model: thermal bremsstrahlung
------------------------------------------------------------
Parameters  : value         Lower 90%    Upper 90%
kT [keV]    : 200.000       (-35.3282      -200)
Norm        : 31.3471       (-4.12744     4.12744)
------------------------------------------------------------
#Fit statistic  : Chi-Squared                   72.05     using 59 bins.
 Reduced chi-squared =
# Null hypothesis probability of 8.65e-02 with 57 degrees of freedom

Energy  Fluence     90% Error
[keV]   [erg/cm2]   [erg/cm2]
15- 25  7.807e-08   4.391e-08
25- 50  1.502e-07   8.340e-08
50-150  3.294e-07   1.830e-07
15-150  5.576e-07   3.121e-07
Double BB
Spectral model: bbodyrad<1> + bbodyrad<2>
------------------------------------------------------------
Parameters  : value         Lower 90%    Upper 90%
kT1 [keV]   : 10.3887        (-4.29332      4.41045)
R1^2/D10^2  : 1.71496        (-0.952064      3.55021)
kT2 [keV]   : 30.8514        (-13.8643      -35.4422)
R2^2/D10^2  : 6.10553E-02    (-0.039026   0.207325)
------------------------------------------------------------
#Fit statistic  : Chi-Squared                   57.40     using 59 bins.
 Reduced chi-squared =
# Null hypothesis probability of 3.86e-01 with 55 degrees of freedom

Energy  Fluence     90% Error
[keV]   [erg/cm2]   [erg/cm2]
15- 25  4.708e-08   2.825e-08
25- 50  1.557e-07   8.455e-08
50-150  4.287e-07   2.449e-07
15-150  6.316e-07   3.318e-07
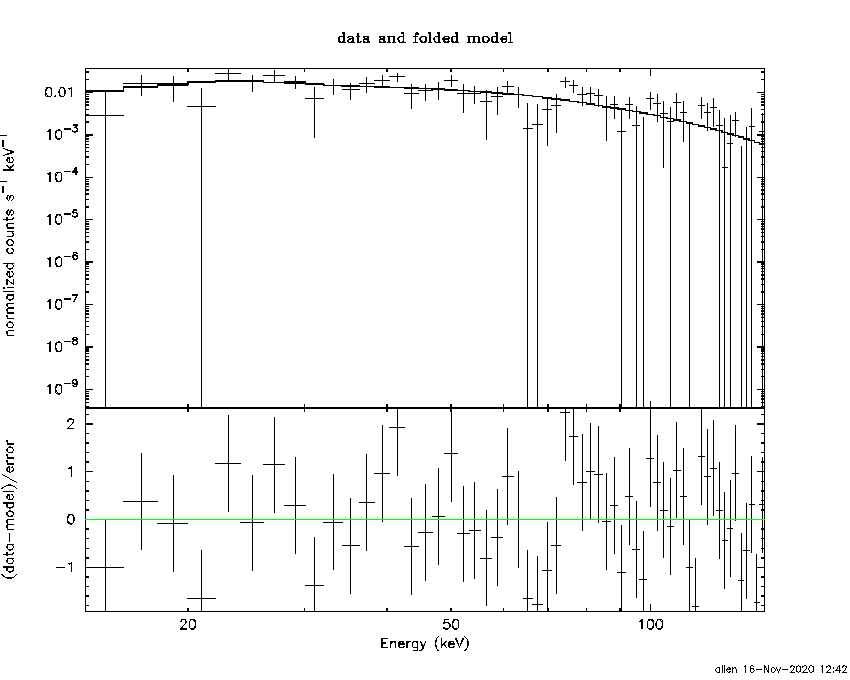
Pre-slew spectrum (Pre-slew PHA with pre-slew DRM)
Power-law model
Spectral model in power-law:
------------------------------------------------------------
Parameters  : value       lower 90%   higher 90%
Photon index: 1.32334     ( -0.119037   0.118309 )
Norm@50keV  : 2.14896E-02    ( -0.00145648   0.00145647 )
------------------------------------------------------------
#Fit statistic  : Chi-Squared                   61.45     using 59 bins.
 Reduced chi-squared =
# Null hypothesis probability of 3.20e-01 with 57 degrees of freedom

Photon flux (15-150 keV)    in 17.26 sec: 2.57511 ( -0.183634  0.184027 ) ph/cm2/s
Energy fluence (15-150 keV)             : 3.64485e-06 ( -2.67306e-07  2.68186e-07 ) ergs/cm2
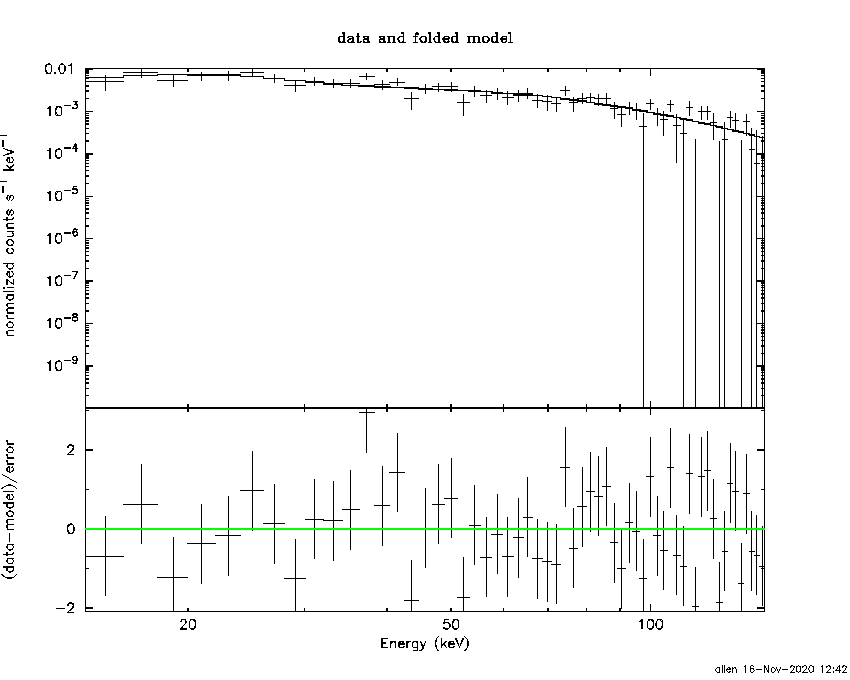
Cutoff power-law model
Spectral model in the cutoff power-law:
------------------------------------------------------------
Parameters  : value       lower 90%   higher 90%
Photon index: 1.16681     ( -0.473717   0.216981 )
Epeak [keV] : 289.301      ( -289.302 -289.302 )
Norm@50keV  : 2.54922E-02    ( -0.0052496   0.0165645 )
------------------------------------------------------------
#Fit statistic  : Chi-Squared                   61.08     using 59 bins.
 Reduced chi-squared =
# Null hypothesis probability of 2.99e-01 with 56 degrees of freedom

Photon flux (15-150 keV)    in 17.26 sec: 2.55784 ( -0.18947  0.18969 ) ph/cm2/s
Energy fluence (15-150 keV)             : 3.61718e-06 ( -2.8246e-07  2.76988e-07 ) ergs/cm2
Band function

Spectral model in the Band function:
------------------------------------------------------------
Parameters  : value       lower 90%   higher 90%
alpha       :    (     )
beta        :     (     )
Epeak [keV] :       (   )
Norm@50keV   :     (     )
------------------------------------------------------------

Photon flux (15-150 keV)    in  sec:  (    ) ph/cm2/s
Energy fluence (15-150 keV)             : 0 ( 0  0 ) ergs/cm2
S(25-50 keV) vs. S(50-100 keV) plot

S(25-50 keV)  = 1.25e-06
S(50-100 keV) = 1.87e-06
T90 vs. Hardness ratio plot
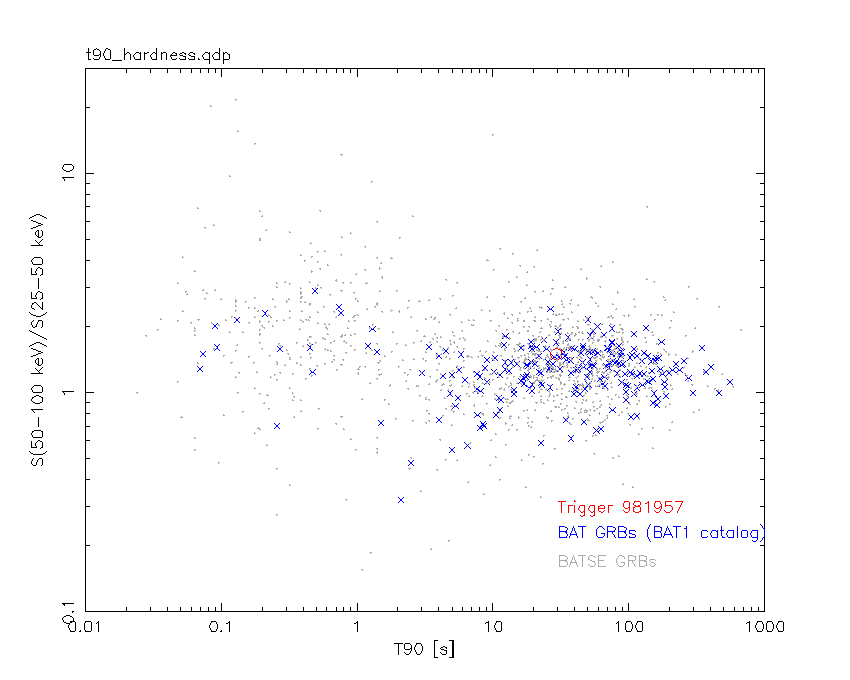
T90                                   = 29.3600000143051 sec.
Hardness ratio (energy fluence ratio) = 1.496
Color vs. Color plot

Count Ratio  (25-50 keV) / (15-25 keV) = 1.46198
Count Ratio (50-100 keV) / (15-25 keV) = 1.23909
Mask shadow pattern

IMX = -1.265991246325264E-01, IMY = -7.963656060771516E-01
TIME vs. PHA plot around the trigger time

TIME vs. DetID plot around the trigger time

100 us light curve (15-350 keV)

Spacecraft aspect plot

Bright source in the pre-burst/pre-slew/post-slew images
Pre-burst image of 15-350 keV band
Time interval of the image:
-239.760000 -4.720000

# RAcent  DECcent POSerr Theta    Phi  PeakCts   SNR AngSep     Name
#  [deg]    [deg]    ['] [deg]  [deg]                   [']
255.9618 -37.8590    1.5  44.2   25.9   4.4540   7.8    1.5	4U 1700-377
256.4958 -36.4453    4.3  44.1   28.0   1.6082   2.7    3.2	GX 349+2
262.8716 -24.6692   16.1  41.8   46.9   0.5026   0.7    8.8	GX 1+4
264.7212 -44.4878    3.4  37.4   16.2  -1.4650  -3.4    2.4	4U 1735-44
270.3692 -25.0877    4.4  35.3   50.0  -1.4456  -2.6    4.7	GX 5-1
270.2699 -25.6981    3.8  35.2   49.0   1.6620   3.1    3.2	GRS 1758-258
273.8809 -14.0736   10.5  37.4   69.2  -0.7643  -1.1    7.6	GX 17+2
276.1363 -30.4093    0.0  29.0   43.0  -0.6930  -1.9   11.2	H1820-303
284.9970 -24.7991    5.6  23.0   60.5   0.6781   2.1    7.6	HT1900.1-2455
263.0172 -33.6867    6.6  39.3   33.6  -0.9356  -1.8    9.0	GX 354-0
356.2436   4.8672    3.4  57.2 -161.6   5.9551   3.4  368.7	UNKNOWN
283.0635 -74.2808    4.0  44.7  -30.4   1.4429   2.9 ------	UNKNOWN
354.7084  -7.0685    2.8  48.3 -151.3   2.9547   4.1  529.3	UNKNOWN
229.2516 -73.6596    2.6  57.2  -21.2   5.3905   4.4 ------	UNKNOWN
353.7833 -26.2063    2.7  38.4 -127.2   2.3398   4.3 ------	UNKNOWN
Pre-slew background subtracted image of 15-350 keV band
Time interval of the image:
-4.720000 12.540600

# RAcent  DECcent POSerr Theta    Phi  PeakCts   SNR AngSep     Name
#  [deg]    [deg]    ['] [deg]  [deg]                   [']
255.9839 -37.8433  352.4  44.2   26.0  -0.0058  -0.0    0.1	4U 1700-377
256.5291 -36.5178    8.8  44.0   28.0   0.2448   1.3    7.3	GX 349+2
262.9366 -24.9522   13.6  41.7   46.5  -0.2056  -0.8   13.0	GX 1+4
264.7011 -44.5463    6.0  37.4   16.1   0.2149   1.9    6.0	4U 1735-44
270.3323 -25.0583    4.3  35.4   50.1   0.3795   2.7    2.9	GX 5-1
270.1944 -25.8568   23.5  35.2   48.7   0.0661   0.5    9.0	GRS 1758-258
273.9918 -14.1788  167.1  37.3   69.1   0.0156   0.1    8.6	GX 17+2
276.0599 -30.4562    6.5  29.0   42.9   0.1682   1.8    8.8	H1820-303
285.0098 -25.1307    0.0  22.9   59.8   0.0919   1.1   12.7	HT1900.1-2455
263.0941 -33.6368    0.0  39.2   33.7  -0.1304  -0.9   13.0	GX 354-0
285.9742  -0.1349    0.7  38.9   99.0   5.6935  17.3 ------	UNKNOWN
266.3600 -52.7351    3.4  37.8    2.6   0.3053   3.4 ------	UNKNOWN
266.5791 -53.3665    3.2  37.8    1.5   0.3193   3.5 ------	UNKNOWN
Post-slew image of 15-350 keV band
Time interval of the image:
147.740600 837.836500
900.240000 962.304300

# RAcent  DECcent POSerr Theta    Phi  PeakCts   SNR AngSep     Name
#  [deg]    [deg]    ['] [deg]  [deg]                   [']
244.9728 -15.6245    0.7  43.4  170.1  29.2401  16.7    1.0	Sco X-1
255.9877 -37.8633    2.9  46.8  135.9  13.7272   4.0    1.2	4U 1700-377
256.5677 -36.5288   10.0  45.5  136.7  -3.4182  -1.1    9.0	GX 349+2
263.0084 -24.7457   10.4  33.2  143.5   1.4592   1.1    0.0	GX 1+4
268.2659  -1.4306    5.3  17.9 -171.2  -1.7655  -2.2    6.3	SW J1753.5-0127
270.2182 -25.2269   13.4  29.4  133.2   1.1342   0.9    9.6	GX 5-1
270.2437 -25.7416    5.5  29.8  132.6   2.9659   2.2    3.2	GRS 1758-258
274.1884 -14.1513   43.3  18.3  142.5  -0.2346  -0.3   12.7	GX 17+2
275.9245 -30.3656    8.2  31.7  119.8   2.0453   1.4    0.1	H1820-303
285.2249 -25.0380    0.0  24.9  104.8  -0.7213  -0.6   12.5	HT1900.1-2455
288.7699  11.0361   24.0  11.5  -63.6   0.4221   0.5    5.7	GRS 1915+105
299.5684  35.2047    3.2  37.5  -58.8   6.3482   3.6    1.1	Cyg X-1
308.1294  40.8152   19.9  45.6  -53.6   2.1930   0.6    8.3	Cyg X-3
262.8325 -33.8611   16.8  40.1  133.5   1.6711   0.7    8.0	GX 354-0
323.8194   4.6316    3.1  38.0    5.3   4.6211   3.7 ------	UNKNOWN
251.0082  29.8059    3.4  44.9 -122.0  11.8314   3.4 ------	UNKNOWN
244.8921  27.0491    3.4  48.0 -129.1  15.4721   3.4 ------	UNKNOWN
Plot creation:
Mon Nov 16 12:42:50 EST 2020