Estimated redshift from machine learning (Ukwatta et al. 2016) - may take a few minute to calcaulte
Image
Pre-slew 15.0-350.0 keV image (Event data)

#   RAcent    DECcent   POSerr    Theta     Phi              Peak Cts       SNR   Name
  184.3603    45.5705   0.0210    41.5424  -158.8771         1.5742161      9.148 TRIG_00984929

Foreground time interval of the image:
  0.536  50.237 (delta_t =  49.701 [sec])
Background time interval of the image:
-239.464   0.536 (delta_t = 240.000 [sec])
Lightcurves
Notes:
- 1) The mask-weighted light curves are using the flight position.
- 2) Multiple plots of different time binning/intervals are shown to cover all scenarios of short/long GRBs, rate/image triggers, and real/false positives.
- 3) For all the mask-weighted lightcurves, the y-axis units are counts/sec/det where a det is 0.4 x 0.4 = 0.16 sq cm.
- 4) The verticle lines correspond to following: green dotted lines are T50 interval, black dotted lines are T90 interval, blue solid line(s) is a spacecraft slew start time, and orange solid line(s) is a spacecraft slew end time.
- 5) Time of each bin is in the middle of the bin.
1 s binning
From T0-310 s to T0+310 s
From T100_start - 20 s to T100_end + 30 s

Full time interval
64 ms binning
Full time interval

From T100_start to T100_end
From T0-5 sec to T0+5 sec

16 ms binning
From T100_start-5 s to T100_start+5 s

Blue+Cyan dotted lines: Time interval of the scaled map
From 0.000000 to 8.192000
8 ms binning
From T100_start-3 s to T100_start+3 s

Blue+Cyan dotted lines: Time interval of the scaled map
From 0.000000 to 8.192000
2 ms binning
From T100_start-1 s to T100_start+1 s

Blue+Cyan dotted lines: Time interval of the scaled map
From 0.000000 to 8.192000
SN=5 or 10 sec. binning (whichever binning is satisfied first)

SN=5 or 10 sec. binning (T < 200 sec)

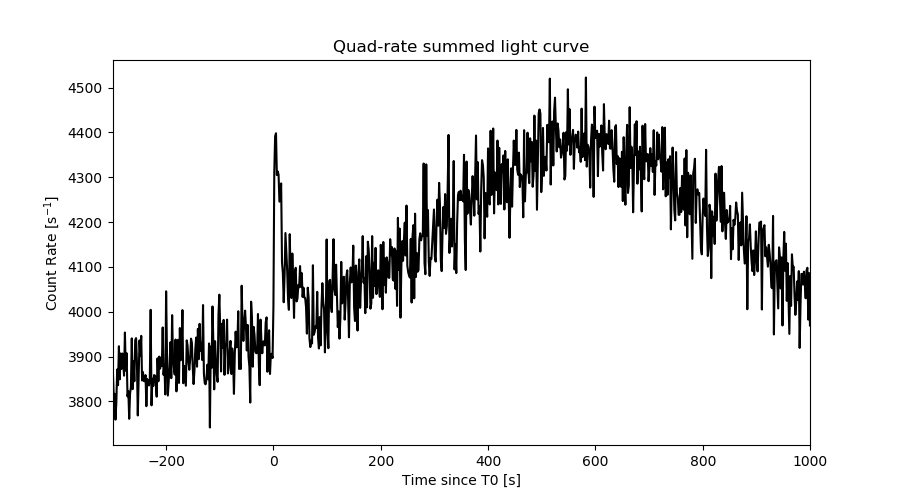
Quad-rate summed light curves (from T0-300s to T0+1000s)
Spectral Evolution

Spectra
Notes:
- 1) The fitting includes the systematic errors.
- 2) When the burst includes telescope slew time periods, the fitting uses an average response file made from multiple 5-s response files through out the slew time plus single time preiod for the non-slew times, and weighted by the total counts in the corresponding time period using addrmf. An average response file is needed becuase a spectral fit using the pre-slew DRM will introduce some errors in both a spectral shape and a normalization if the PHA file contains a lot of the slew/post-slew time interval.
- 3) For fits to more complicated models (e.g. a power-law over a cutoff power-law), the BAT team has decided to require a chi-square improvement of more than 6 for each extra dof.
Time averaged spectrum fit using the average DRM
Power-law model

Time interval is from    0.536 sec. to  136.536 sec.

Spectral model in power-law:
------------------------------------------------------------
Parameters  : value       lower 90%   higher 90%
Photon index: 0.922876     ( -0.278402   0.259623 )
Norm@50keV  : 1.05344E-03    ( -0.00017188   0.00016851 )
------------------------------------------------------------
#Fit statistic  : Chi-Squared                   41.61     using 59 bins.
 Reduced chi-squared = 0.73
# Null hypothesis probability of 9.37e-01 with 57 degrees of freedom

Photon flux (15-150 keV)    in 136 sec: 0.120948 ( -0.019614  0.01984 ) ph/cm2/s
Energy fluence (15-150 keV)             : 1.59396e-06 ( -2.44535e-07  2.45155e-07 ) ergs/cm2
Cutoff power-law model
Time interval is from    0.536 sec. to  136.536 sec.
Spectral model in the cutoff power-law:
------------------------------------------------------------
Parameters  : value       lower 90%   higher 90%
Photon index: 6.21513E-04     ( -1.6384   1.02511 )
Epeak [keV] : 135.977      ( -48.9967 -135.976 )
Norm@50keV  : 2.45608E-03    ( -0.00151618   0.0070187 )
------------------------------------------------------------
#Fit statistic  : Chi-Squared                   39.86     using 59 bins.
 Reduced chi-squared = 0.711786
# Null hypothesis probability of 9.49e-01 with 56 degrees of freedom

Photon flux (15-150 keV)    in 136 sec: 0.115562 ( -0.0208783  0.021037 ) ph/cm2/s
Energy fluence (15-150 keV)             : 1.5485e-06 ( -2.59152e-07  2.55805e-07 ) ergs/cm2
Band function

Time interval is from    0.536 sec. to  136.536 sec.


Spectral model in the Band function:
------------------------------------------------------------
Parameters  : value       lower 90%   higher 90%
alpha       :    (     )
beta        :     (     )
Epeak [keV] :       (   )
Norm@50keV   :     (     )
------------------------------------------------------------

Photon flux (15-150 keV)    in  sec:  (    ) ph/cm2/s
Energy fluence (15-150 keV)             : 0 ( 0  0 ) ergs/cm2
Single BB

Spectral model blackbody:
------------------------------------------------------------
Parameters  : value    Lower 90%  Upper 90%
kT [keV]    : 24.6173  (-4.16  5.71339)
R^2/D10^2   : 3.16048E-03  (-0.00150789   0.00255822)
(R is the radius in km and D10 is the distance to the source in units of 10 kpc)
------------------------------------------------------------
#Fit statistic  : Chi-Squared                   41.78     using 59 bins.
 Reduced chi-squared =
# Null hypothesis probability of 9.35e-01 with 57 degrees of freedom

Energy  Fluence     90% Error
[keV]   [erg/cm2]   [erg/cm2]
15- 25  4.562e-08   1.605e-08
25- 50  2.568e-07   6.854e-08
50-150  1.156e-06   3.180e-07
15-150  1.459e-06   3.410e-07
Thermal bremsstrahlung (OTTB)

Spectral model: thermal bremsstrahlung
------------------------------------------------------------
Parameters  : value         Lower 90%    Upper 90%
kT [keV]    : 200.000       (-33.2589      -200)
Norm        : 0.516748       (-0.0824098     0.0824098)
------------------------------------------------------------
#Fit statistic  : Chi-Squared                   57.53     using 59 bins.
 Reduced chi-squared =
# Null hypothesis probability of 4.56e-01 with 57 degrees of freedom

Energy  Fluence     90% Error
[keV]   [erg/cm2]   [erg/cm2]
15- 25  1.749e-07   1.006e-07
25- 50  3.365e-07   1.918e-07
50-150  7.379e-07   4.172e-07
15-150  1.249e-06   6.929e-07
Double BB

Spectral model: bbodyrad<1> + bbodyrad<2>
------------------------------------------------------------
Parameters  : value         Lower 90%    Upper 90%
kT1 [keV]   : 6.18427        (-6.18783      -6.18783)
R1^2/D10^2  : 7.62512E-02        (-0.0760397      -0.0760397)
kT2 [keV]   : 27.8047        (-6.1695      -27.8088)
R2^2/D10^2  : 2.04827E-03    (-0.00204715   0.00215102)
------------------------------------------------------------
#Fit statistic  : Chi-Squared                   39.52     using 59 bins.
 Reduced chi-squared =
# Null hypothesis probability of 9.43e-01 with 55 degrees of freedom

Energy  Fluence     90% Error
[keV]   [erg/cm2]   [erg/cm2]
15- 25  9.023e-08   5.391e-08
25- 50  2.690e-07   1.380e-07
50-150  1.186e-06   6.239e-07
15-150  1.545e-06   8.198e-07
Peak spectrum fit
Power-law model

Time interval is from    5.536 sec. to    6.536 sec.

Spectral model in power-law:
------------------------------------------------------------
Parameters  : value       lower 90%   higher 90%
Photon index: 0.721122     ( -0.773142   0.609661 )
Norm@50keV  : 6.41471E-03    ( -0.00285567   0.00258868 )
------------------------------------------------------------
#Fit statistic  : Chi-Squared                   50.15     using 59 bins.
 Reduced chi-squared = 0.879825
# Null hypothesis probability of 7.28e-01 with 57 degrees of freedom

Photon flux (15-150 keV)    in 1 sec: 0.740310 ( -0.283578  0.29512 ) ph/cm2/s
Energy fluence (15-150 keV)             : 7.75711e-08 ( -2.61561e-08  2.61626e-08 ) ergs/cm2
Cutoff power-law model
Time interval is from    5.536 sec. to    6.536 sec.
Spectral model in the cutoff power-law:
------------------------------------------------------------
Parameters  : value       lower 90%   higher 90%
Photon index: 0.454702     ( -2.66288   -0.454702 )
Epeak [keV] : 406.066      ( -406.066 -406.066 )
Norm@50keV  : 7.97030E-03    ( -0.00426102   0.135579 )
------------------------------------------------------------
#Fit statistic  : Chi-Squared                   50.12     using 59 bins.
 Reduced chi-squared = 0.895
# Null hypothesis probability of 6.96e-01 with 56 degrees of freedom

Photon flux (15-150 keV)    in 1 sec: 0.731593 ( -0.290053  0.290277 ) ph/cm2/s
Energy fluence (15-150 keV)             : 7.75658e-08 ( -2.63115e-08  2.62205e-08 ) ergs/cm2
Band function

Time interval is from    5.536 sec. to    6.536 sec.


Spectral model in the Band function:
------------------------------------------------------------
Parameters  : value       lower 90%   higher 90%
alpha       :    (     )
beta        :     (     )
Epeak [keV] :       (   )
Norm@50keV   :     (     )
------------------------------------------------------------

Photon flux (15-150 keV)    in  sec:  (    ) ph/cm2/s
Energy fluence (15-150 keV)             : 0 ( 0  0 ) ergs/cm2
Single BB

Spectral model blackbody:
------------------------------------------------------------
Parameters  : value    Lower 90%  Upper 90%
kT [keV]    : 31.9778  (-11.959  36.4646)
R^2/D10^2   : 9.41875E-03  (-0.00941814   0.0298104)
(R is the radius in km and D10 is the distance to the source in units of 10 kpc)
------------------------------------------------------------
#Fit statistic  : Chi-Squared                   50.90     using 59 bins.
 Reduced chi-squared =
# Null hypothesis probability of 7.02e-01 with 57 degrees of freedom

Energy  Fluence     90% Error
[keV]   [erg/cm2]   [erg/cm2]
15- 25  1.448e-09   9.535e-10
25- 50  9.158e-09   5.675e-09
50-150  6.435e-08   3.864e-08
15-150  7.495e-08   4.670e-08
Thermal bremsstrahlung (OTTB)

Spectral model: thermal bremsstrahlung
------------------------------------------------------------
Parameters  : value         Lower 90%    Upper 90%
kT [keV]    : 200.000       (-92.8494      -200)
Norm        : 3.23317       (-1.22842     1.22842)
------------------------------------------------------------
#Fit statistic  : Chi-Squared                   55.44     using 59 bins.
 Reduced chi-squared =
# Null hypothesis probability of 5.34e-01 with 57 degrees of freedom

Energy  Fluence     90% Error
[keV]   [erg/cm2]   [erg/cm2]
15- 25  8.061e-09   5.315e-09
25- 50  1.551e-08   9.925e-09
50-150  3.401e-08   2.097e-08
15-150  5.757e-08   3.723e-08
Double BB

Spectral model: bbodyrad<1> + bbodyrad<2>
------------------------------------------------------------
Parameters  : value         Lower 90%    Upper 90%
kT1 [keV]   : 7.32957        (-7.29861      -7.29861)
R1^2/D10^2  : 0.367164        (-0.370607      2.3836)
kT2 [keV]   : 40.0427        (-40.0081      -40.0081)
R2^2/D10^2  : 4.64358E-03    (-0.00465528   0.0250475)
------------------------------------------------------------
#Fit statistic  : Chi-Squared                   49.92     using 59 bins.
 Reduced chi-squared =
# Null hypothesis probability of 6.69e-01 with 55 degrees of freedom

Energy  Fluence     90% Error
[keV]   [erg/cm2]   [erg/cm2]
15- 25  4.275e-09   3.099e-09
25- 50  1.151e-08   7.495e-09
50-150  6.366e-08   3.783e-08
15-150  7.944e-08   4.559e-08
Pre-slew spectrum (Pre-slew PHA with pre-slew DRM)
Power-law model

Spectral model in power-law:
------------------------------------------------------------
Parameters  : value       lower 90%   higher 90%
Photon index: 0.692412     ( -0.316879   0.283678 )
Norm@50keV  : 1.93909E-03    ( -0.000376709   0.00036148 )
------------------------------------------------------------
#Fit statistic  : Chi-Squared                   52.56     using 59 bins.
 Reduced chi-squared =
# Null hypothesis probability of 6.42e-01 with 57 degrees of freedom

Photon flux (15-150 keV)    in 49.7 sec: 0.224275 ( -0.0391295  0.0399037 ) ph/cm2/s
Energy fluence (15-150 keV)             : 1.1804e-06 ( -1.81628e-07  1.81769e-07 ) ergs/cm2
Cutoff power-law model

Spectral model in the cutoff power-law:
------------------------------------------------------------
Parameters  : value       lower 90%   higher 90%
Photon index: 0.239812     ( -1.74501   0.656208 )
Epeak [keV] : 259.583      ( -214.423 -214.423 )
Norm@50keV  : 2.85717E-03    ( -0.00167816   0.00898415 )
------------------------------------------------------------
#Fit statistic  : Chi-Squared                   51.90     using 59 bins.
 Reduced chi-squared =
# Null hypothesis probability of 6.31e-01 with 56 degrees of freedom

Photon flux (15-150 keV)    in 49.7 sec: 0.218535 ( -0.039905  0.041308 ) ph/cm2/s
Energy fluence (15-150 keV)             : 1.16697e-06 ( -1.85709e-07  1.86067e-07 ) ergs/cm2
Band function

Spectral model in the Band function:
------------------------------------------------------------
Parameters  : value       lower 90%   higher 90%
alpha       :    (     )
beta        :     (     )
Epeak [keV] :       (   )
Norm@50keV   :     (     )
------------------------------------------------------------

Photon flux (15-150 keV)    in  sec:  (    ) ph/cm2/s
Energy fluence (15-150 keV)             : 0 ( 0  0 ) ergs/cm2
S(25-50 keV) vs. S(50-100 keV) plot

S(25-50 keV)  = 2.80e-07
S(50-100 keV) = 5.92e-07
T90 vs. Hardness ratio plot
T90                                   = 122 sec.
Hardness ratio (energy fluence ratio) = 2.11429
Color vs. Color plot
Count Ratio  (25-50 keV) / (15-25 keV) = 2.02713
Count Ratio (50-100 keV) / (15-25 keV) = 3.13091
Mask shadow pattern
IMX = -8.265102105242641E-01, IMY = 3.193040653880231E-01
TIME vs. PHA plot around the trigger time
Blue+Cyan dotted lines: Time interval of the scaled map
From 0.000000 to 8.192000
TIME vs. DetID plot around the trigger time

Blue+Cyan dotted lines: Time interval of the scaled map
From 0.000000 to 8.192000
100 us light curve (15-350 keV)

Blue+Cyan dotted lines: Time interval of the scaled map
From 0.000000 to 8.192000
Spacecraft aspect plot

Bright source in the pre-burst/pre-slew/post-slew images
Pre-burst image of 15-350 keV band
Time interval of the image:
-239.464000 0.536000

# RAcent  DECcent POSerr Theta    Phi  PeakCts   SNR AngSep     Name
#  [deg]    [deg]    ['] [deg]  [deg]                   [']
 83.6321  22.0326    0.9  47.9  -22.6   8.6647  12.7    1.1	Crab
 39.9577  34.6707    3.1  52.4   30.1   5.3551   3.7 ------	UNKNOWN
230.0987  48.7078    2.8  55.6  163.9   7.3923   4.1 ------	UNKNOWN
 65.0791  20.7616    2.8  54.9   -2.3   3.3060   4.2 ------	UNKNOWN
212.5579  38.6620    3.0  58.5 -177.2   7.1978   3.8 ------	UNKNOWN
 84.6986  26.3352    2.6  43.5  -22.2   2.1920   4.4 ------	UNKNOWN
175.9560  41.0103    3.0  41.8 -147.4   2.1749   3.8 ------	UNKNOWN
165.5198  32.7117    2.2  44.8 -130.8   4.4020   5.4 ------	UNKNOWN
Pre-slew background subtracted image of 15-350 keV band
Time interval of the image:
0.536000 50.236600

# RAcent  DECcent POSerr Theta    Phi  PeakCts   SNR AngSep     Name
#  [deg]    [deg]    ['] [deg]  [deg]                   [']
 83.5604  21.8872    5.1  48.0  -22.6  -0.5160  -2.3    8.6	Crab
184.3603  45.5705    1.3  41.5 -158.9   1.5747   9.1 ------	UNKNOWN
 96.2691  31.9509    2.2  35.4  -35.3   0.7478   5.2 ------	UNKNOWN
Post-slew image of 15-350 keV band
Time interval of the image:
123.636600 962.562500

# RAcent  DECcent POSerr Theta    Phi  PeakCts   SNR AngSep     Name
#  [deg]    [deg]    ['] [deg]  [deg]                   [']
230.2480  24.6030    2.2  42.2  116.3  20.6703   5.3 ------	UNKNOWN
230.3736  46.1016    4.1  31.6   84.6   5.1286   2.9 ------	UNKNOWN
165.2533  66.6332    3.1  23.3   -6.8   3.2313   3.7 ------	UNKNOWN
182.8619  -9.1610    2.6  54.8 -165.7  15.1613   4.5 ------	UNKNOWN
172.0530  -0.0563    3.1  47.0 -150.6   8.8938   3.8 ------	UNKNOWN
Plot creation:
Mon Nov 16 12:39:51 EST 2020