Estimated redshift from machine learning (Ukwatta et al. 2016) - may take a few minute to calcaulte
Image
Pre-slew 15.0-350.0 keV image (Event data)
#   RAcent    DECcent   POSerr    Theta     Phi              Peak Cts       SNR   Name
   52.9344    37.0784   0.0042    38.5153   -24.7701         2.7592286     45.547 TRIG_00987016

Foreground time interval of the image:
 -0.132   9.973 (delta_t =  10.105 [sec])
Background time interval of the image:
-239.328  -0.132 (delta_t = 239.196 [sec])
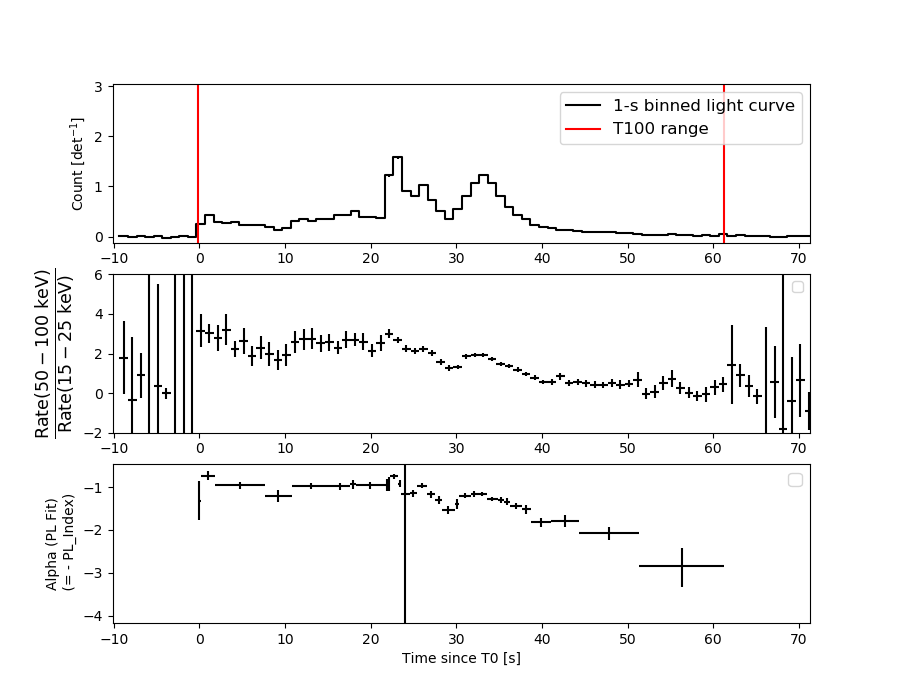
Lightcurves
Notes:
- 1) The mask-weighted light curves are using the flight position.
- 2) Multiple plots of different time binning/intervals are shown to cover all scenarios of short/long GRBs, rate/image triggers, and real/false positives.
- 3) For all the mask-weighted lightcurves, the y-axis units are counts/sec/det where a det is 0.4 x 0.4 = 0.16 sq cm.
- 4) The verticle lines correspond to following: green dotted lines are T50 interval, black dotted lines are T90 interval, blue solid line(s) is a spacecraft slew start time, and orange solid line(s) is a spacecraft slew end time.
- 5) Time of each bin is in the middle of the bin.
1 s binning
From T0-310 s to T0+310 s
From T100_start - 20 s to T100_end + 30 s
Full time interval
64 ms binning
Full time interval

From T100_start to T100_end
From T0-5 sec to T0+5 sec
16 ms binning
From T100_start-5 s to T100_start+5 s
Blue+Cyan dotted lines: Time interval of the scaled map
From 0.000000 to 0.512000
8 ms binning
From T100_start-3 s to T100_start+3 s
Blue+Cyan dotted lines: Time interval of the scaled map
From 0.000000 to 0.512000
2 ms binning
From T100_start-1 s to T100_start+1 s
Blue+Cyan dotted lines: Time interval of the scaled map
From 0.000000 to 0.512000
SN=5 or 10 sec. binning (whichever binning is satisfied first)
SN=5 or 10 sec. binning (T < 200 sec)
Quad-rate summed light curves (from T0-300s to T0+1000s)

Spectral Evolution
Spectra
Notes:
- 1) The fitting includes the systematic errors.
- 2) When the burst includes telescope slew time periods, the fitting uses an average response file made from multiple 5-s response files through out the slew time plus single time preiod for the non-slew times, and weighted by the total counts in the corresponding time period using addrmf. An average response file is needed becuase a spectral fit using the pre-slew DRM will introduce some errors in both a spectral shape and a normalization if the PHA file contains a lot of the slew/post-slew time interval.
- 3) For fits to more complicated models (e.g. a power-law over a cutoff power-law), the BAT team has decided to require a chi-square improvement of more than 6 for each extra dof.
Time averaged spectrum fit using the average DRM
Power-law model
Time interval is from   -0.132 sec. to   61.308 sec.

Spectral model in power-law:
------------------------------------------------------------
Parameters  : value       lower 90%   higher 90%
Photon index: 1.20924     ( -0.0252933   0.0252002 )
Norm@50keV  : 2.64435E-02    ( -0.00039428   0.00039364 )
------------------------------------------------------------
#Fit statistic  : Chi-Squared                   89.25     using 59 bins.
 Reduced chi-squared = 1.56579
# Null hypothesis probability of 4.06e-03 with 57 degrees of freedom

Photon flux (15-150 keV)    in 61.44 sec: 3.10804 ( -0.05144  0.05155 ) ph/cm2/s
Energy fluence (15-150 keV)             : 1.64423e-05 ( -2.30093e-07  2.30253e-07 ) ergs/cm2
Cutoff power-law model
Time interval is from   -0.132 sec. to   61.308 sec.
Spectral model in the cutoff power-law:
------------------------------------------------------------
Parameters  : value       lower 90%   higher 90%
Photon index: 0.748813     ( -0.114273   0.111717 )
Epeak [keV] : 173.320      ( -21.7893 34.3288 )
Norm@50keV  : 4.01955E-02    ( -0.00379233   0.00426817 )
------------------------------------------------------------
#Fit statistic  : Chi-Squared                   36.81     using 59 bins.
 Reduced chi-squared = 0.657321
# Null hypothesis probability of 9.78e-01 with 56 degrees of freedom

Photon flux (15-150 keV)    in 61.44 sec: 3.01090 ( -0.055  0.05528 ) ph/cm2/s
Energy fluence (15-150 keV)             : 1.62578e-05 ( -2.35965e-07  2.35677e-07 ) ergs/cm2
Band function

Time interval is from   -0.132 sec. to   61.308 sec.


Spectral model in the Band function:
------------------------------------------------------------
Parameters  : value       lower 90%   higher 90%
alpha       :    (     )
beta        :     (     )
Epeak [keV] :       (   )
Norm@50keV   :     (     )
------------------------------------------------------------

Photon flux (15-150 keV)    in  sec:  (    ) ph/cm2/s
Energy fluence (15-150 keV)             : 0 ( 0  0 ) ergs/cm2
Single BB
Spectral model blackbody:
------------------------------------------------------------
Parameters  : value    Lower 90%  Upper 90%
kT [keV]    : 22.2999  (  )
R^2/D10^2   : 0.100405  (   )
(R is the radius in km and D10 is the distance to the source in units of 10 kpc)
------------------------------------------------------------
#Fit statistic  : Chi-Squared                  693.22     using 59 bins.
 Reduced chi-squared =
# Null hypothesis probability of 3.91e-110 with 57 degrees of freedom

Energy  Fluence     90% Error
[keV]   [erg/cm2]   [erg/cm2]
15- 25  5.642e-07   1.705e-08
25- 50  3.007e-06   6.636e-08
50-150  1.118e-05   2.028e-07
15-150  1.475e-05   2.181e-07
Thermal bremsstrahlung (OTTB)
Spectral model: thermal bremsstrahlung
------------------------------------------------------------
Parameters  : value         Lower 90%    Upper 90%
kT [keV]    : 199.363       (      )
Norm        : 13.8342       (     )
------------------------------------------------------------
#Fit statistic  : Chi-Squared                  732.44     using 59 bins.
 Reduced chi-squared =
# Null hypothesis probability of 5.38e-118 with 57 degrees of freedom

Energy  Fluence     90% Error
[keV]   [erg/cm2]   [erg/cm2]
15- 25  2.116e-06   3.318e-08
25- 50  4.071e-06   6.390e-08
50-150  8.929e-06   1.444e-07
15-150  1.512e-05   2.396e-07
Double BB
Spectral model: bbodyrad<1> + bbodyrad<2>
------------------------------------------------------------
Parameters  : value         Lower 90%    Upper 90%
kT1 [keV]   : 9.56873        (-0.689541      0.729781)
R1^2/D10^2  : 0.843128        (-0.160632      0.212776)
kT2 [keV]   : 33.5990        (-1.89278      2.32848)
R2^2/D10^2  : 2.12330E-02    (-0.004476   0.00492153)
------------------------------------------------------------
#Fit statistic  : Chi-Squared                   42.17     using 59 bins.
 Reduced chi-squared =
# Null hypothesis probability of 8.98e-01 with 55 degrees of freedom

Energy  Fluence     90% Error
[keV]   [erg/cm2]   [erg/cm2]
15- 25  1.164e-06   6.881e-08
25- 50  3.597e-06   1.017e-07
50-150  1.146e-05   3.072e-07
15-150  1.622e-05   3.901e-07
Peak spectrum fit
Power-law model

Time interval is from   22.244 sec. to   23.244 sec.

Spectral model in power-law:
------------------------------------------------------------
Parameters  : value       lower 90%   higher 90%
Photon index: 0.755694     ( -0.0508801   0.0503831 )
Norm@50keV  : 0.122785    ( -0.00375056   0.00373701 )
------------------------------------------------------------
#Fit statistic  : Chi-Squared                   49.50     using 59 bins.
 Reduced chi-squared = 0.868421
# Null hypothesis probability of 7.49e-01 with 57 degrees of freedom

Photon flux (15-150 keV)    in 1 sec: 0.409140 (    ) ph/cm2/s
Energy fluence (15-150 keV)             : 1.46241e-06 ( -4.45609e-08  4.46134e-08 ) ergs/cm2
Cutoff power-law model
Time interval is from   22.244 sec. to   23.244 sec.
Spectral model in the cutoff power-law:
------------------------------------------------------------
Parameters  : value       lower 90%   higher 90%
Photon index: 0.469360     ( -0.212216   0.202146 )
Epeak [keV] : 339.457      ( -116.109 595.312 )
Norm@50keV  : 0.160214    ( -0.0268736   0.0336098 )
------------------------------------------------------------
#Fit statistic  : Chi-Squared                   43.56     using 59 bins.
 Reduced chi-squared = 0.777857
# Null hypothesis probability of 8.87e-01 with 56 degrees of freedom

Photon flux (15-150 keV)    in 1 sec: 14.0274 ( -0.4247  0.4251 ) ph/cm2/s
Energy fluence (15-150 keV)             : 1.4566e-06 ( -4.53304e-08  4.52619e-08 ) ergs/cm2
Band function

Time interval is from   22.244 sec. to   23.244 sec.


Spectral model in the Band function:
------------------------------------------------------------
Parameters  : value       lower 90%   higher 90%
alpha       :    (     )
beta        :     (     )
Epeak [keV] :       (   )
Norm@50keV   :     (     )
------------------------------------------------------------

Photon flux (15-150 keV)    in  sec:  (    ) ph/cm2/s
Energy fluence (15-150 keV)             : 0 ( 0  0 ) ergs/cm2
Single BB
Spectral model blackbody:
------------------------------------------------------------
Parameters  : value    Lower 90%  Upper 90%
kT [keV]    : 27.4435  (  )
R^2/D10^2   : 0.281226  (   )
(R is the radius in km and D10 is the distance to the source in units of 10 kpc)
------------------------------------------------------------
#Fit statistic  : Chi-Squared                  177.64     using 59 bins.
 Reduced chi-squared =
# Null hypothesis probability of 2.57e-14 with 57 degrees of freedom

Energy  Fluence     90% Error
[keV]   [erg/cm2]   [erg/cm2]
15- 25  3.494e-08   2.110e-09
25- 50  2.074e-07   9.850e-09
50-150  1.136e-06   4.400e-08
15-150  1.379e-06   4.500e-08
Thermal bremsstrahlung (OTTB)
Spectral model: thermal bremsstrahlung
------------------------------------------------------------
Parameters  : value         Lower 90%    Upper 90%
kT [keV]    : 199.363       (      )
Norm        : 54.6587       (     )
------------------------------------------------------------
#Fit statistic  : Chi-Squared                  693.67     using 59 bins.
 Reduced chi-squared =
# Null hypothesis probability of 3.17e-110 with 57 degrees of freedom

Energy  Fluence     90% Error
[keV]   [erg/cm2]   [erg/cm2]
15- 25  1.361e-07   4.100e-09
25- 50  2.618e-07   8.600e-09
50-150  5.742e-07   1.765e-08
15-150  9.721e-07   3.130e-08
Double BB
Spectral model: bbodyrad<1> + bbodyrad<2>
------------------------------------------------------------
Parameters  : value         Lower 90%    Upper 90%
kT1 [keV]   : 9.95133        (-1.60926      1.90115)
R1^2/D10^2  : 2.55550        (-0.919616      1.64383)
kT2 [keV]   : 41.6129        (-4.81424      7.82363)
R2^2/D10^2  : 7.33915E-02    (-0.0290911   0.0334615)
------------------------------------------------------------
#Fit statistic  : Chi-Squared                   43.19     using 59 bins.
 Reduced chi-squared =
# Null hypothesis probability of 8.76e-01 with 55 degrees of freedom

Energy  Fluence     90% Error
[keV]   [erg/cm2]   [erg/cm2]
15- 25  6.739e-08   9.780e-09
25- 50  2.370e-07   2.230e-08
50-150  1.168e-06   9.820e-08
15-150  1.472e-06   1.265e-07
Pre-slew spectrum (Pre-slew PHA with pre-slew DRM)
Power-law model
Spectral model in power-law:
------------------------------------------------------------
Parameters  : value       lower 90%   higher 90%
Photon index: 0.953539     ( -0.0637794   0.0629758 )
Norm@50keV  : 1.81496E-02    ( -0.000682986   0.000680547 )
------------------------------------------------------------
#Fit statistic  : Chi-Squared                   71.08     using 59 bins.
 Reduced chi-squared =
# Null hypothesis probability of 9.94e-02 with 57 degrees of freedom

Photon flux (15-150 keV)    in 10.1 sec: 2.08543 ( -0.0797105  0.0798819 ) ph/cm2/s
Energy fluence (15-150 keV)             : 2.01588e-06 ( -7.52451e-08  7.53158e-08 ) ergs/cm2
Cutoff power-law model
Spectral model in the cutoff power-law:
------------------------------------------------------------
Parameters  : value       lower 90%   higher 90%
Photon index: 0.542411     ( -0.283597   0.265991 )
Epeak [keV] : 216.372      ( -63.469 264.303 )
Norm@50keV  : 2.69666E-02    ( -0.00596629   0.00814967 )
------------------------------------------------------------
#Fit statistic  : Chi-Squared                   63.93     using 59 bins.
 Reduced chi-squared =
# Null hypothesis probability of 2.18e-01 with 56 degrees of freedom

Photon flux (15-150 keV)    in 10.1 sec: 2.05050 ( -0.08243  0.08261 ) ph/cm2/s
Energy fluence (15-150 keV)             : 1.99311e-06 ( -7.81538e-08  7.78407e-08 ) ergs/cm2
Band function

Spectral model in the Band function:
------------------------------------------------------------
Parameters  : value       lower 90%   higher 90%
alpha       :    (     )
beta        :     (     )
Epeak [keV] :       (   )
Norm@50keV   :     (     )
------------------------------------------------------------

Photon flux (15-150 keV)    in  sec:  (    ) ph/cm2/s
Energy fluence (15-150 keV)             : 0 ( 0  0 ) ergs/cm2
S(25-50 keV) vs. S(50-100 keV) plot

S(25-50 keV)  = 3.47e-06
S(50-100 keV) = 6.01e-06
T90 vs. Hardness ratio plot
T90                                   = 38.6879999637604 sec.
Hardness ratio (energy fluence ratio) = 1.73199
Color vs. Color plot
Count Ratio  (25-50 keV) / (15-25 keV) = 1.81396
Count Ratio (50-100 keV) / (15-25 keV) = 1.82937
Mask shadow pattern
IMX = 7.226485954659663E-01, IMY = 3.334527808191839E-01
TIME vs. PHA plot around the trigger time
Blue+Cyan dotted lines: Time interval of the scaled map
From 0.000000 to 0.512000
TIME vs. DetID plot around the trigger time
Blue+Cyan dotted lines: Time interval of the scaled map
From 0.000000 to 0.512000
100 us light curve (15-350 keV)

Blue+Cyan dotted lines: Time interval of the scaled map
From 0.000000 to 0.512000
Spacecraft aspect plot
Bright source in the pre-burst/pre-slew/post-slew images
Pre-burst image of 15-350 keV band
Time interval of the image:
-239.328000 -0.132000

# RAcent  DECcent POSerr Theta    Phi  PeakCts   SNR AngSep     Name
#  [deg]    [deg]    ['] [deg]  [deg]                   [']
308.0359  40.9904    4.9  40.4  127.0   1.5567   2.4    4.1	Cyg X-3
326.1272  38.3523    3.3  35.1  105.5   1.7409   3.4    2.8	Cyg X-2
 33.4307  11.5096    3.6  55.9   10.9   3.5168   3.2 ------	UNKNOWN
262.2670  50.7917    2.5  51.0  171.1   3.4325   4.7 ------	UNKNOWN
 62.7175  37.2966    3.3  42.4  -35.2   1.3741   3.5 ------	UNKNOWN
 78.2807  45.8289    2.8  42.2  -56.7   2.4730   4.1 ------	UNKNOWN
197.9542  61.5333    2.2  54.0 -143.5   7.1009   5.3 ------	UNKNOWN
173.1012  67.0405    3.4  48.4 -129.8   3.7034   3.4 ------	UNKNOWN
Pre-slew background subtracted image of 15-350 keV band
Time interval of the image:
-0.132000 9.972590

# RAcent  DECcent POSerr Theta    Phi  PeakCts   SNR AngSep     Name
#  [deg]    [deg]    ['] [deg]  [deg]                   [']
308.0996  41.0121    2.9  40.3  127.0   0.4855   3.9    3.6	Cyg X-3
326.2923  38.4481   18.1  34.9  105.3   0.0553   0.6    9.5	Cyg X-2
284.2317  45.5726    3.1  46.9  151.3   0.4524   3.7 ------	UNKNOWN
 52.9344  37.0784    0.3  38.5  -24.8   2.7592  45.5 ------	UNKNOWN
 65.6971  40.8750    2.2  40.7  -41.1   0.4281   5.2 ------	UNKNOWN
Post-slew image of 15-350 keV band
Time interval of the image:
66.772600 962.828800

# RAcent  DECcent POSerr Theta    Phi  PeakCts   SNR AngSep     Name
#  [deg]    [deg]    ['] [deg]  [deg]                   [']
 83.6244  22.0067    0.3  30.5  -58.9  36.1131  36.9    0.7	Crab
 19.4800   8.5632    3.7  41.6   65.3   9.4175   3.1 ------	UNKNOWN
 36.8697 -12.9876    3.3  52.3   30.0  15.3503   3.5 ------	UNKNOWN
 52.3799 -18.8074    3.0  55.9   10.7  16.5616   3.9 ------	UNKNOWN
Plot creation:
Mon Nov 16 12:38:49 EST 2020