Estimated redshift from machine learning (Ukwatta et al. 2016) - may take a few minutes to calcaulte
Image
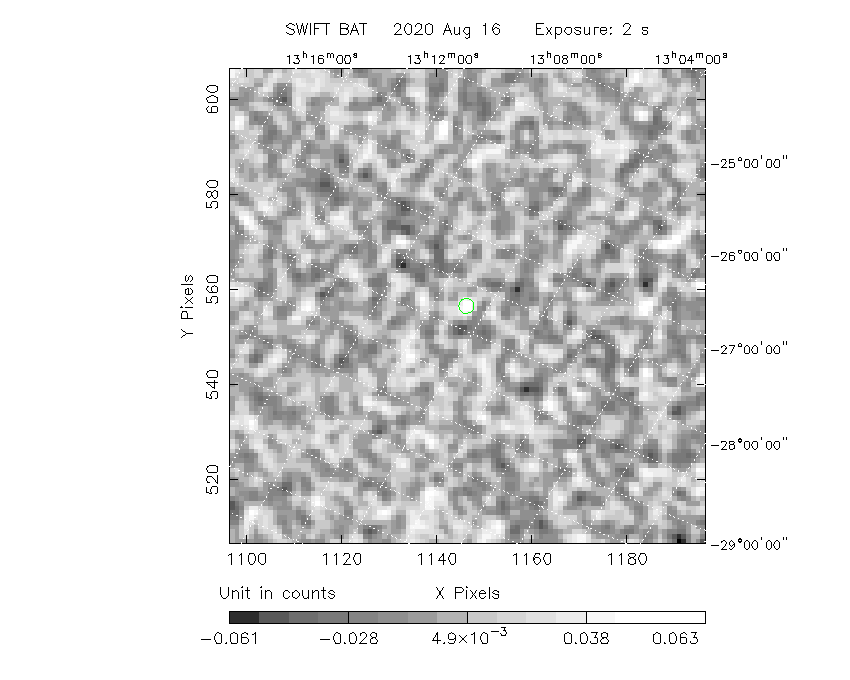
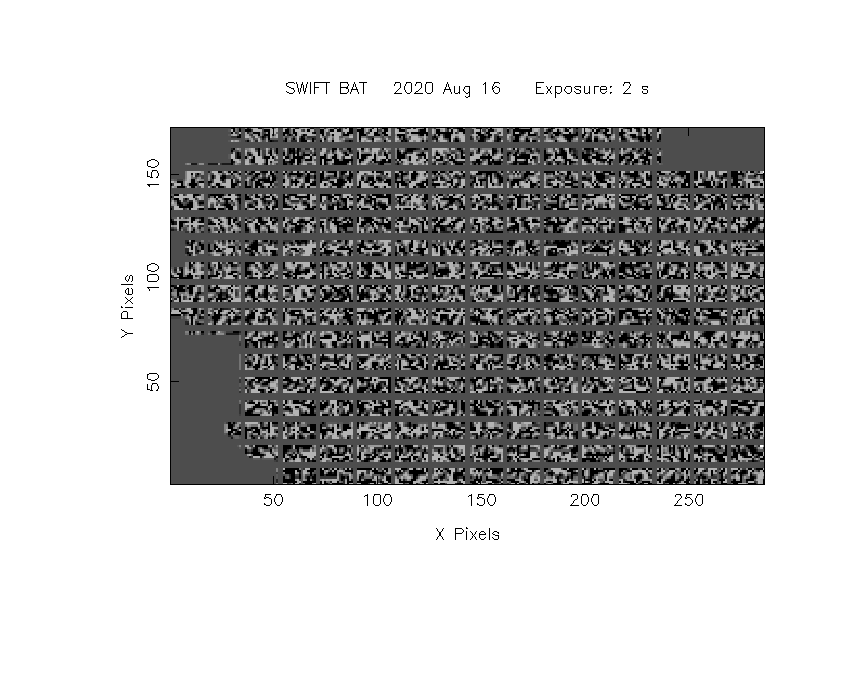
Pre-slew 15-350 keV image (Event data; bkg subtracted)
#   RAcent  DECcent POSerr  Theta    Phi     Peak Cts     SNR  Name
  202.4822 -22.5991 0.0393   30.3 -163.3       0.0889     4.9  TRIG_00989458
------------------------------------------

Foreground time interval of the image:
  0.000   2.048 (delta_t =   2.048 [sec])
Background time interval of the image:
-239.776 -11.776 (delta_t = 228.000 [sec])
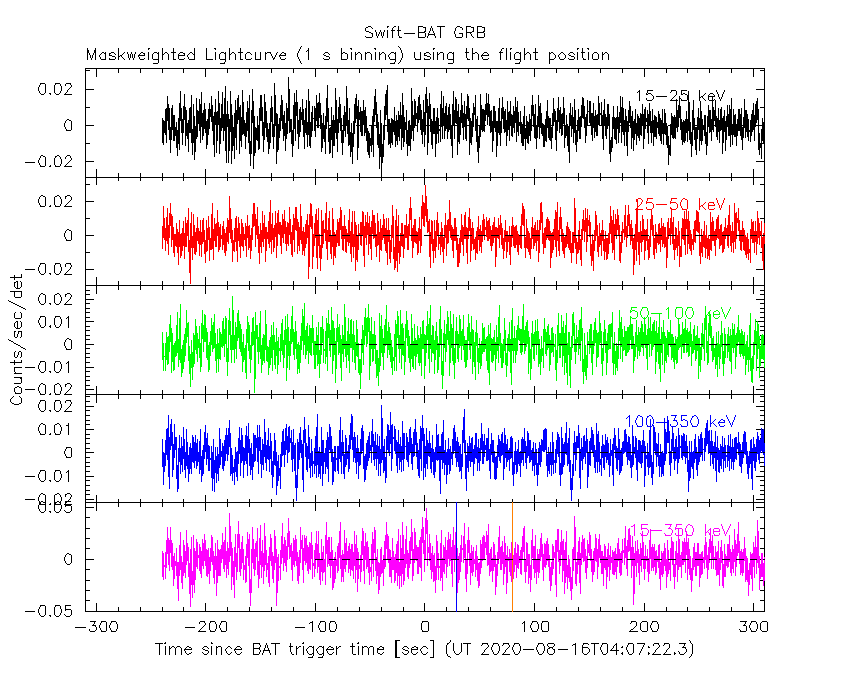
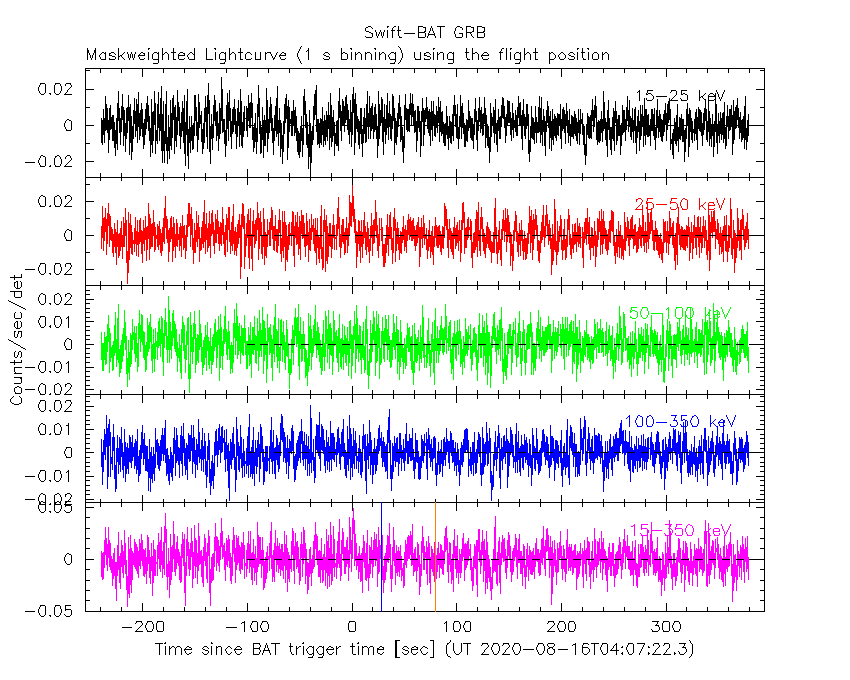
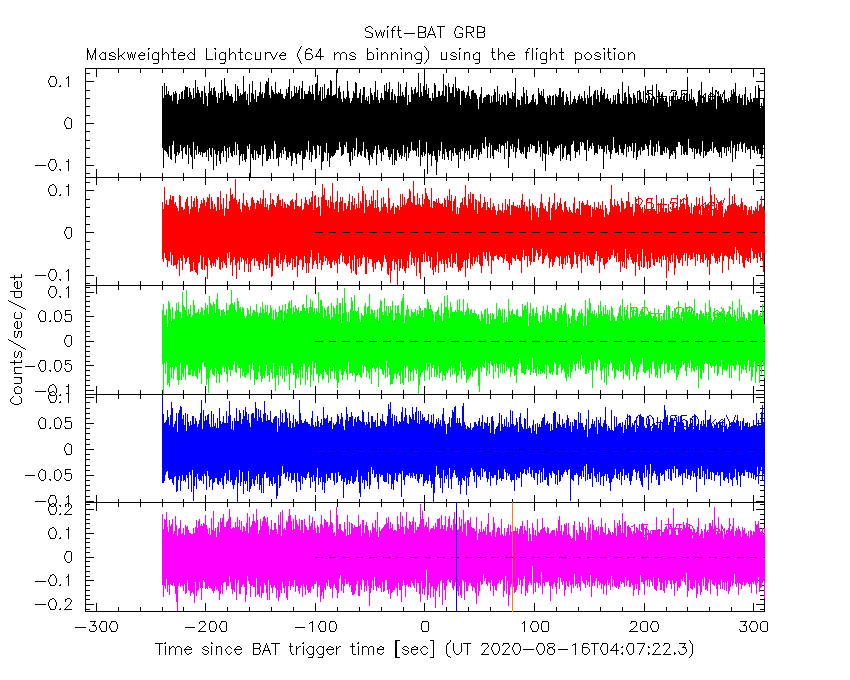
Lightcurves
Notes:
- 1) All plots contain as much data as has been downloaded to date.
- 2) The mask-weighted light curves are using the flight position.
- 3) Multiple plots of different time binning/intervals are shown to cover all scenarios of short/long GRBs, rate/image triggers, and real/false positives.
- 4) For all the mask-weighted lightcurves, the y-axis units are counts/sec/det where a det is 0.4 x 0.4 = 0.16 sq cm.
- 5) The verticle lines correspond to following: green dotted lines are T50 interval, black dotted lines are T90 interval, blue solid line(s) is a spacecraft slew start time, and orange solid line(s) is a spacecraft slew end time.
- 6) Time of each bin is in the middle of the bin.
1 s binning
From T0-310 s to T0+310 s
From T100_start - 20 s to T100_end + 30 s
Full time interval
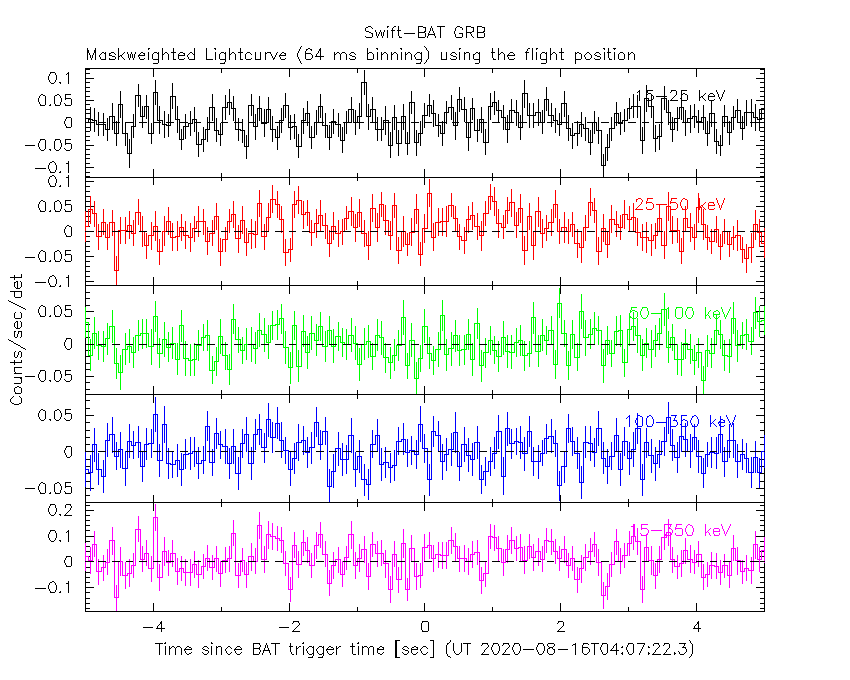
64 ms binning
Full time interval
From T100_start to T100_end
From T0-5 sec to T0+5 sec
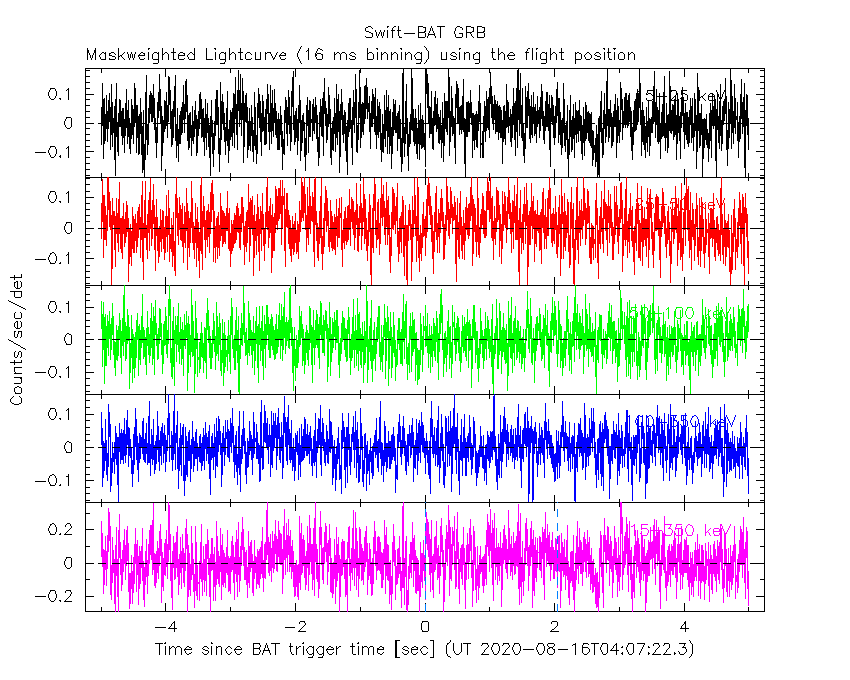
16 ms binning
From T100_start-5 s to T100_start+5 s
Blue+Cyan dotted lines: Time interval of the scaled map
From 0.000000 to 2.048000
8 ms binning
From T100_start-3 s to T100_start+3 s
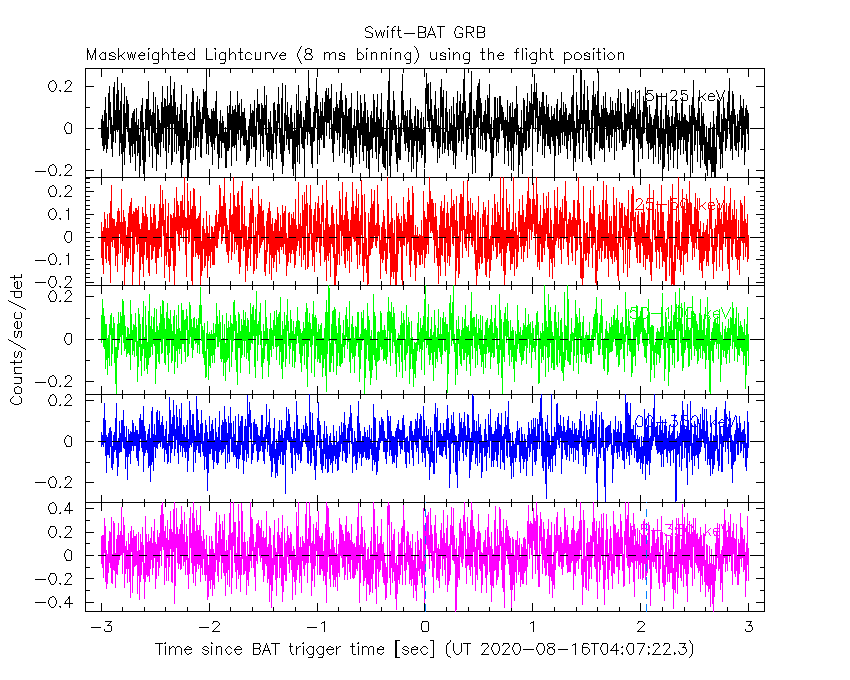
Blue+Cyan dotted lines: Time interval of the scaled map
From 0.000000 to 2.048000
2 ms binning
From T100_start-1 s to T100_start+1 s
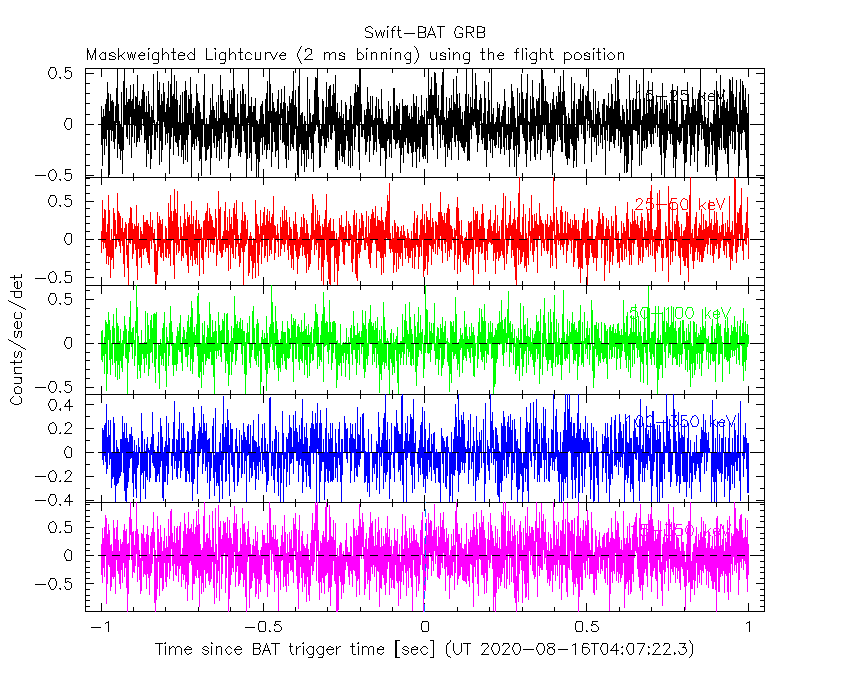
Blue+Cyan dotted lines: Time interval of the scaled map
From 0.000000 to 2.048000
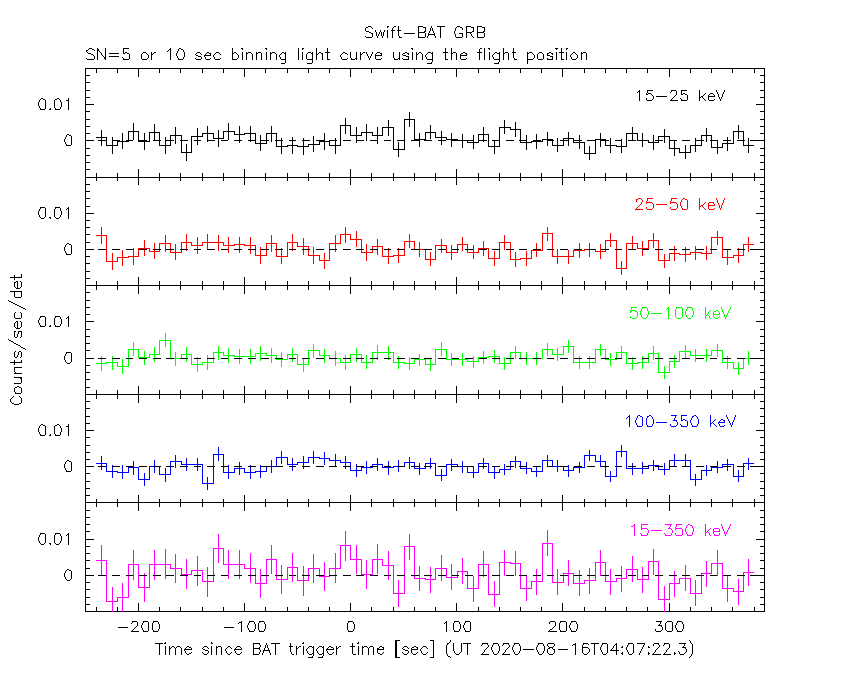
SN=5 or 10 sec. binning (whichever binning is satisfied first)
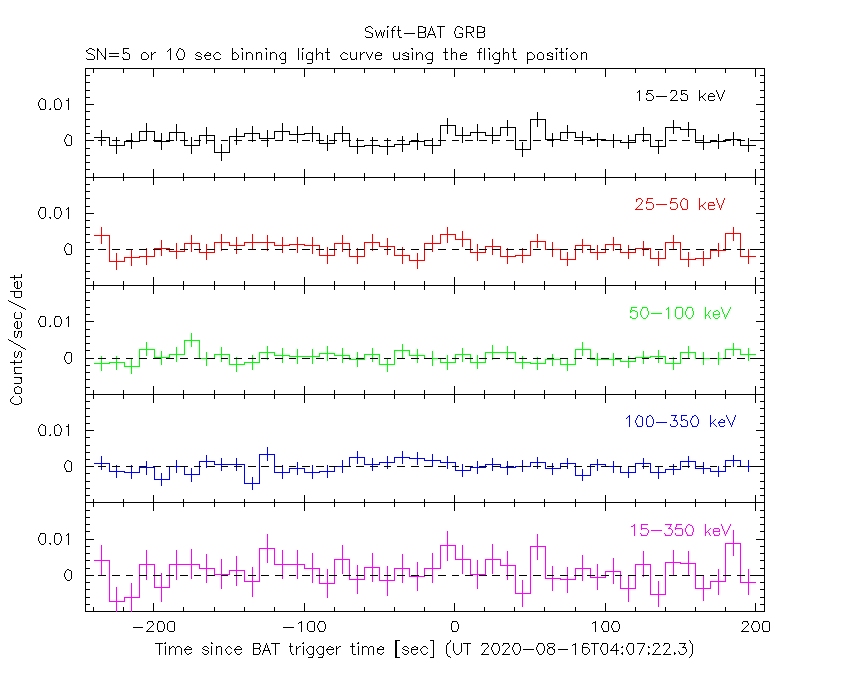
SN=5 or 10 sec. binning (T < 200 sec)
Spectra
Notes:
- 1) The fitting includes the systematic errors.
- 2) For long bursts, a spectral fit of the pre-slew DRM will introduce some errors in both a spectral shape and a normalization if the PHA file contains a lot of the slew/post-slew time interval.
- 3) For fits to more complicated models (e.g. a power-law over a cutoff power-law), the BAT team has decided to require a chi-square improvement of more than 6 for each extra dof.
- 4) For short bursts (T90<1sec), the specrtum is also fit with Blackbody, OTTB, and Double Blackbody.
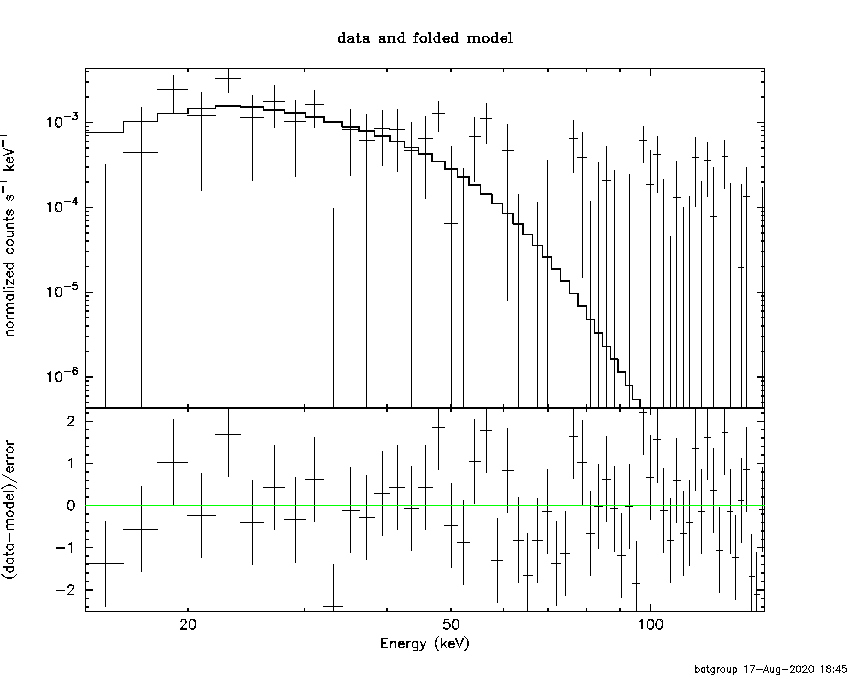
Time averaged spectrum fit using the pre-slew DRM
Power-law model
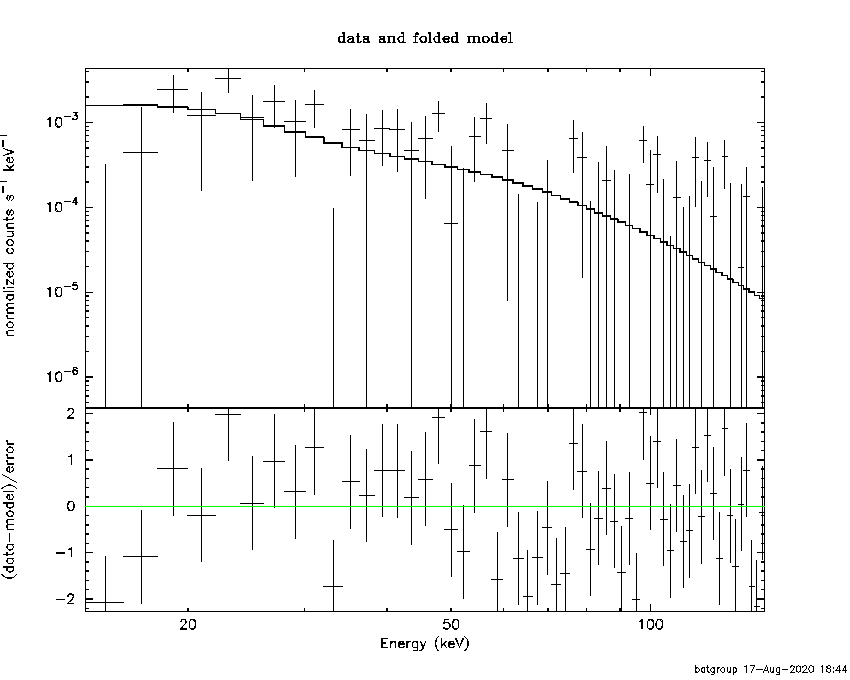
Time interval is from    0.000 sec. to    2.048 sec.

Spectral model in power-law:
------------------------------------------------------------
Parameters  : value       lower 90%   higher 90%
Photon index: 2.08962     ( -0.558431   0.627381 )
Norm@50keV  : 2.03868E-03    ( -0.000988451   0.000919771 )
------------------------------------------------------------
#Fit statistic : Chi-Squared =          76.49 using 59 PHA bins.
# Reduced chi-squared =          1.342 for     57 degrees of freedom
# Null hypothesis probability =   4.344987e-02

Photon flux (15-150 keV)    in 2.048 sec: 0.319016 ( -0.113731  0.113727 ) ph/cm2/s
Energy fluence (15-150 keV)             : 3.84924e-08 ( -1.55795e-08  1.70288e-08 ) ergs/cm2
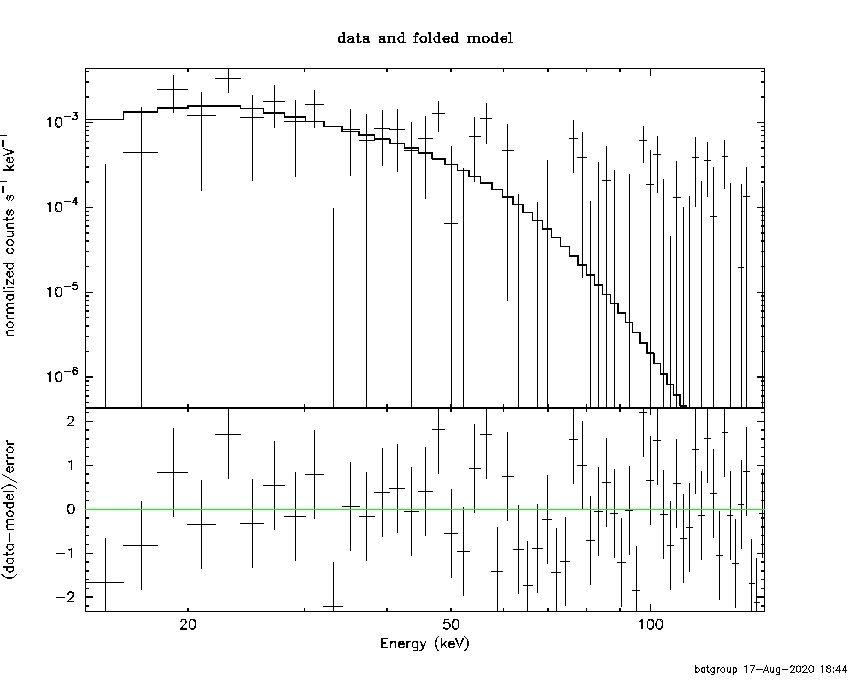
Cutoff power-law model

Time interval is from    0.000 sec. to    2.048 sec.
Spectral model in the cutoff power-law:
------------------------------------------------------------
Parameters  : value       lower 90%   higher 90%
Photon index: -4.10031     ( 4.57768   4.64169 )
Epeak [keV] : 33.1317      ( -6.269 8.23265 )
Norm@50keV  : 21.4059    ( -21.0537   519134 )
------------------------------------------------------------
#Fit statistic : Chi-Squared =          68.90 using 59 PHA bins.
# Reduced chi-squared =          1.230 for     56 degrees of freedom
# Null hypothesis probability =   1.154310e-01

Photon flux (15-150 keV)    in 2.048 sec: 0.313569 ( -0.101642  0.104853 ) ph/cm2/s
Energy fluence (15-150 keV)             : 3.12476e-08 ( -1.02902e-08  1.11553e-08 ) ergs/cm2
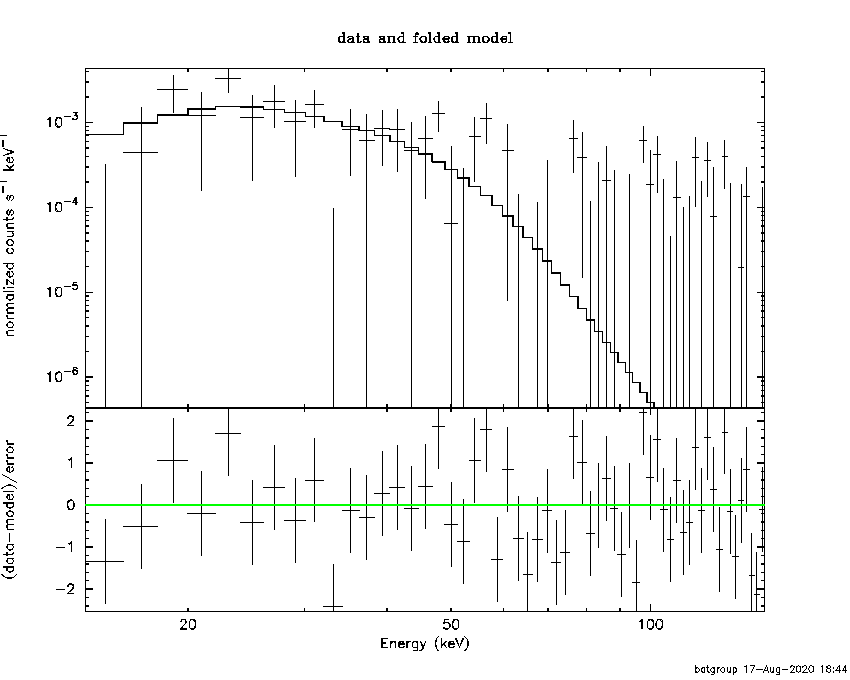
Band function

Time interval is from    0.000 sec. to    2.048 sec.

Spectral model in the Band function:
------------------------------------------------------------
Parameters  : value       lower 90%   higher 90%
alpha       : 4.48828   ( -4.54404   -4.48828 )
beta        : -9.33928    ( 9.33928   19.2996 )
Epeak [keV] : 33.1739      ( -6.40772 7.33899 )
Norm@50keV   : 37.3047    ( -11.4222   616.148 )
------------------------------------------------------------
#Fit statistic : Chi-Squared =          68.93 using 59 PHA bins.
# Reduced chi-squared =          1.253 for     55 degrees of freedom
# Null hypothesis probability =   9.812101e-02

Photon flux (15-150 keV)    in 2.048 sec:  (    ) ph/cm2/s
Energy fluence (15-150 keV)             : 0 ( 0  0 ) ergs/cm2
Single BB

Spectral model blackbody:
------------------------------------------------------------
Parameters  : value    Lower 90%  Upper 90%
kT [keV]    : 8.51595  (-1.9333  2.50035)
R^2/D10^2   : 0.326207  (-0.32618   0.573387)
(R is the radius in km and D10 is the distance to the source in units of 10 kpc)
------------------------------------------------------------
#Fit statistic : Chi-Squared =          69.73 using 59 PHA bins.
# Reduced chi-squared =          1.223 for     57 degrees of freedom
# Null hypothesis probability =   1.200489e-01

Energy  Fluence     90% Error
[keV]   [erg/cm2]   [erg/cm2]
15- 25  9.141e-09   5.655e-09
25- 50  1.778e-08   1.160e-08
50-150  5.712e-09   4.433e-09
15-150  3.263e-08   2.051e-08
Thermal bremsstrahlung (OTTB)
Spectral model: thermal bremsstrahlung
------------------------------------------------------------
Parameters  : value         Lower 90%    Upper 90%
kT [keV]    : 42.3878       (-21.1419      73.3193)
Norm        : 2.09425       (-0.93456     1.57478)
------------------------------------------------------------
#Fit statistic : Chi-Squared =          74.11 using 59 PHA bins.
# Reduced chi-squared =          1.300 for     57 degrees of freedom
# Null hypothesis probability =   6.343943e-02

Energy  Fluence     90% Error
[keV]   [erg/cm2]   [erg/cm2]
15- 25  1.003e-08   6.193e-09
25- 50  1.353e-08   8.330e-09
50-150  1.114e-08   9.297e-09
15-150  3.470e-08   2.359e-08
Double BB
Spectral model: bbodyrad<1> + bbodyrad<2>
------------------------------------------------------------
Parameters  : value         Lower 90%    Upper 90%
kT1 [keV]   : 8.54020        (-8.52783      -8.52783)
R1^2/D10^2  : 0.109447        (-0.109151      -0.109151)
kT2 [keV]   : 8.49469        (-8.51293      -8.51293)
R2^2/D10^2  : 0.217675    (-0.217231   -0.217231)
------------------------------------------------------------
#Fit statistic : Chi-Squared =          69.73 using 59 PHA bins.
# Reduced chi-squared =          1.268 for     55 degrees of freedom
# Null hypothesis probability =   8.727355e-02

Energy  Fluence     90% Error
[keV]   [erg/cm2]   [erg/cm2]
15- 25  9.150e-09   1.070e-01
25- 50  1.778e-08   9.456e-01
50-150  5.698e-09   2.243e+01
15-150  3.263e-08   2.473e+01
Peak spectrum fit
Power-law model

Time interval is from    0.000 sec. to    2.048 sec.

Spectral model in power-law:
------------------------------------------------------------
Parameters  : value       lower 90%   higher 90%
Photon index: 2.08962     ( -0.558431   0.627381 )
Norm@50keV  : 2.03868E-03    ( -0.000988451   0.000919771 )
------------------------------------------------------------
#Fit statistic : Chi-Squared =          76.49 using 59 PHA bins.
# Reduced chi-squared =          1.342 for     57 degrees of freedom
# Null hypothesis probability =   4.344987e-02

Photon flux (15-150 keV)    in 2.048 sec: 0.319016 ( -0.113731  0.113727 ) ph/cm2/s
Energy fluence (15-150 keV)             : 3.84924e-08 ( -1.55795e-08  1.70288e-08 ) ergs/cm2
Cutoff power-law model

Time interval is from    0.000 sec. to    2.048 sec.
Spectral model in the cutoff power-law:
------------------------------------------------------------
Parameters  : value       lower 90%   higher 90%
Photon index: -4.10031     ( 4.57768   4.64169 )
Epeak [keV] : 33.1317      ( -6.269 8.23265 )
Norm@50keV  : 21.4059    ( -21.0537   519134 )
------------------------------------------------------------
#Fit statistic : Chi-Squared =          68.90 using 59 PHA bins.
# Reduced chi-squared =          1.230 for     56 degrees of freedom
# Null hypothesis probability =   1.154310e-01

Photon flux (15-150 keV)    in 2.048 sec: 0.313569 ( -0.101642  0.104853 ) ph/cm2/s
Energy fluence (15-150 keV)             : 3.12476e-08 ( -1.02902e-08  1.11553e-08 ) ergs/cm2
Band function
Time interval is from    0.000 sec. to    2.048 sec.

Spectral model in the Band function:
------------------------------------------------------------
Parameters  : value       lower 90%   higher 90%
alpha       : 4.48828   ( -4.54404   -4.48828 )
beta        : -9.33928    ( 9.33928   19.2996 )
Epeak [keV] : 33.1739      ( -6.40772 7.33899 )
Norm@50keV   : 37.3047    ( -11.4222   616.148 )
------------------------------------------------------------
#Fit statistic : Chi-Squared =          68.93 using 59 PHA bins.
# Reduced chi-squared =          1.253 for     55 degrees of freedom
# Null hypothesis probability =   9.812101e-02

Photon flux (15-150 keV)    in 2.048 sec:  (    ) ph/cm2/s
Energy fluence (15-150 keV)             : 0 ( 0  0 ) ergs/cm2
Single BB

Spectral model blackbody:
------------------------------------------------------------
Parameters  : value    Lower 90%  Upper 90%
kT [keV]    : 8.51595  (-1.9333  2.50035)
R^2/D10^2   : 0.326207  (-0.32618   0.573387)
(R is the radius in km and D10 is the distance to the source in units of 10 kpc)
------------------------------------------------------------
#Fit statistic : Chi-Squared =          69.73 using 59 PHA bins.
# Reduced chi-squared =          1.223 for     57 degrees of freedom
# Null hypothesis probability =   1.200489e-01

Energy  Fluence     90% Error
[keV]   [erg/cm2]   [erg/cm2]
15- 25  9.141e-09   5.557e-09
25- 50  1.778e-08   1.141e-08
50-150  5.712e-09   4.392e-09
15-150  3.263e-08   2.070e-08
Thermal bremsstrahlung (OTTB)

Spectral model: thermal bremsstrahlung
------------------------------------------------------------
Parameters  : value         Lower 90%    Upper 90%
kT [keV]    : 42.3878       (-21.1419      73.3193)
Norm        : 2.09425       (-0.93456     1.57478)
------------------------------------------------------------
#Fit statistic : Chi-Squared =          74.11 using 59 PHA bins.
# Reduced chi-squared =          1.300 for     57 degrees of freedom
# Null hypothesis probability =   6.343943e-02

Energy  Fluence     90% Error
[keV]   [erg/cm2]   [erg/cm2]
15- 25  1.003e-08   6.332e-09
25- 50  1.353e-08   8.348e-09
50-150  1.114e-08   9.773e-09
15-150  3.470e-08   2.245e-08
Double BB

Spectral model: bbodyrad<1> + bbodyrad<2>
------------------------------------------------------------
Parameters  : value         Lower 90%    Upper 90%
kT1 [keV]   : 8.54020        (-8.52783      -8.52783)
R1^2/D10^2  : 0.109447        (-0.109151      -0.109151)
kT2 [keV]   : 8.49469        (-8.51293      -8.51293)
R2^2/D10^2  : 0.217675    (-0.217231   -0.217231)
------------------------------------------------------------
#Fit statistic : Chi-Squared =          69.73 using 59 PHA bins.
# Reduced chi-squared =          1.268 for     55 degrees of freedom
# Null hypothesis probability =   8.727355e-02

Energy  Fluence     90% Error
[keV]   [erg/cm2]   [erg/cm2]
15- 25  9.150e-09   1.169e-01
25- 50  1.778e-08   9.734e-01
50-150  5.698e-09   2.273e+01
15-150  3.263e-08   2.612e+01
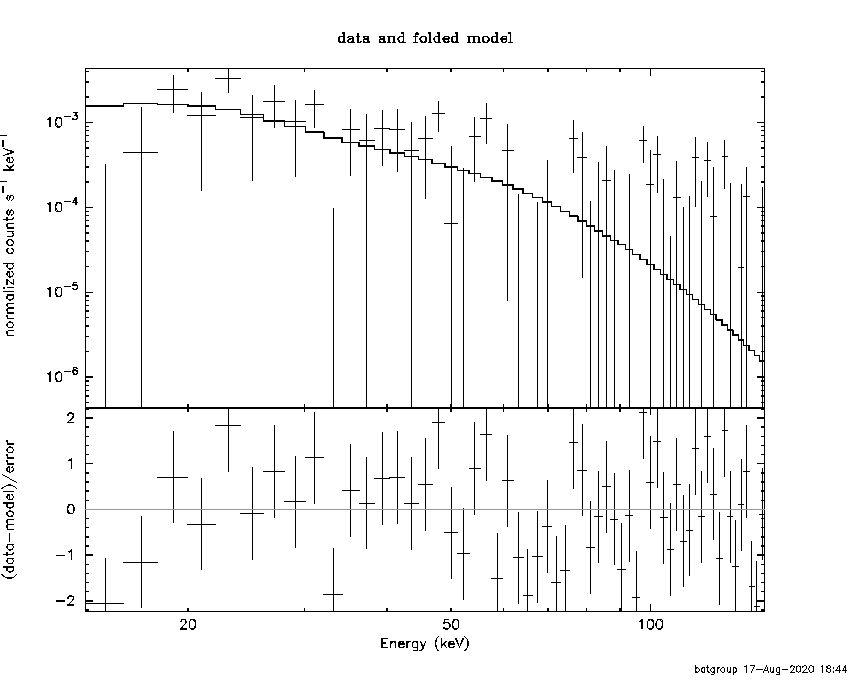
Pre-slew spectrum (Pre-slew PHA with pre-slew DRM)
Power-law model

Spectral model in power-law:
------------------------------------------------------------
Parameters  : value       lower 90%   higher 90%
Photon index: 2.08962     ( -0.558431   0.627381 )
Norm@50keV  : 2.03868E-03    ( -0.000988451   0.000919771 )
------------------------------------------------------------
#Fit statistic : Chi-Squared =          76.49 using 59 PHA bins.
# Reduced chi-squared =          1.342 for     57 degrees of freedom
# Null hypothesis probability =   4.344987e-02

Photon flux (15-150 keV)    in 2.048 sec: 0.319016 ( -0.113731  0.113727 ) ph/cm2/s
Energy fluence (15-150 keV)             : 3.84924e-08 ( -1.55795e-08  1.70288e-08 ) ergs/cm2
Cutoff power-law model
Spectral model in the cutoff power-law:
------------------------------------------------------------
Parameters  : value       lower 90%   higher 90%
Photon index: -4.10031     ( 4.57768   4.64169 )
Epeak [keV] : 33.1317      ( -6.269 8.23265 )
Norm@50keV  : 21.4059    ( -21.0537   519134 )
------------------------------------------------------------
#Fit statistic : Chi-Squared =          68.90 using 59 PHA bins.
# Reduced chi-squared =          1.230 for     56 degrees of freedom
# Null hypothesis probability =   1.154310e-01

Photon flux (15-150 keV)    in 2.048 sec: 0.313569 ( -0.101642  0.104853 ) ph/cm2/s
Energy fluence (15-150 keV)             : 3.12476e-08 ( -1.02902e-08  1.11553e-08 ) ergs/cm2
Band function

Spectral model in the Band function:
------------------------------------------------------------
Parameters  : value       lower 90%   higher 90%
alpha       : 4.48828   ( -4.54404   -4.48828 )
beta        : -9.33928    ( 9.33928   19.2996 )
Epeak [keV] : 33.1739      ( -6.40772 7.33899 )
Norm@50keV   : 37.3047    ( -11.4222   616.148 )
------------------------------------------------------------
#Fit statistic : Chi-Squared =          68.93 using 59 PHA bins.
# Reduced chi-squared =          1.253 for     55 degrees of freedom
# Null hypothesis probability =   9.812101e-02

Photon flux (15-150 keV)    in 2.048 sec:  (    ) ph/cm2/s
Energy fluence (15-150 keV)             : 0 ( 0  0 ) ergs/cm2
S(25-50 keV) vs. S(50-100 keV) plot
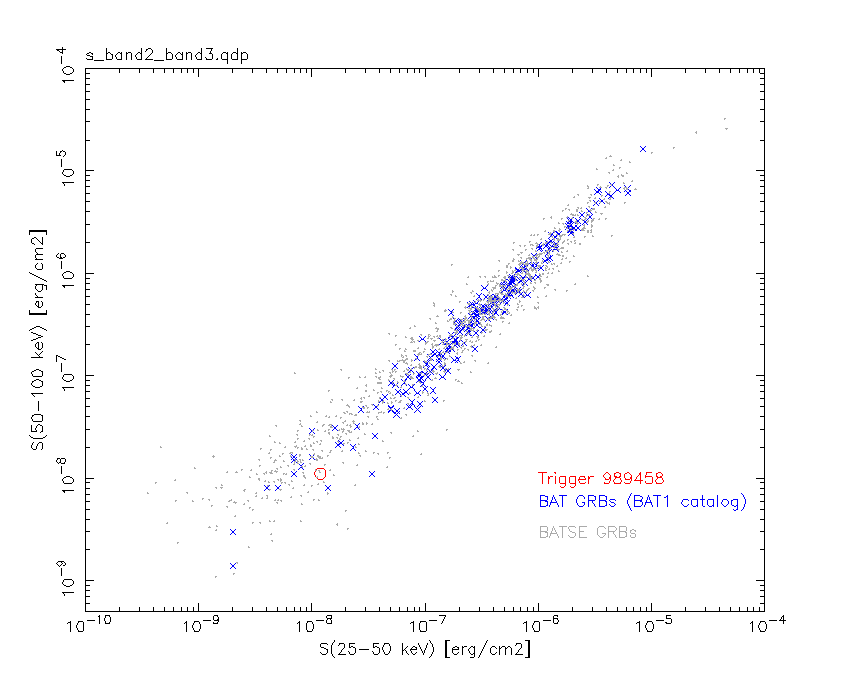
S(25-50 keV)  = 1.19e-08
S(50-100 keV) = 1.11e-08
T90 vs. Hardness ratio plot
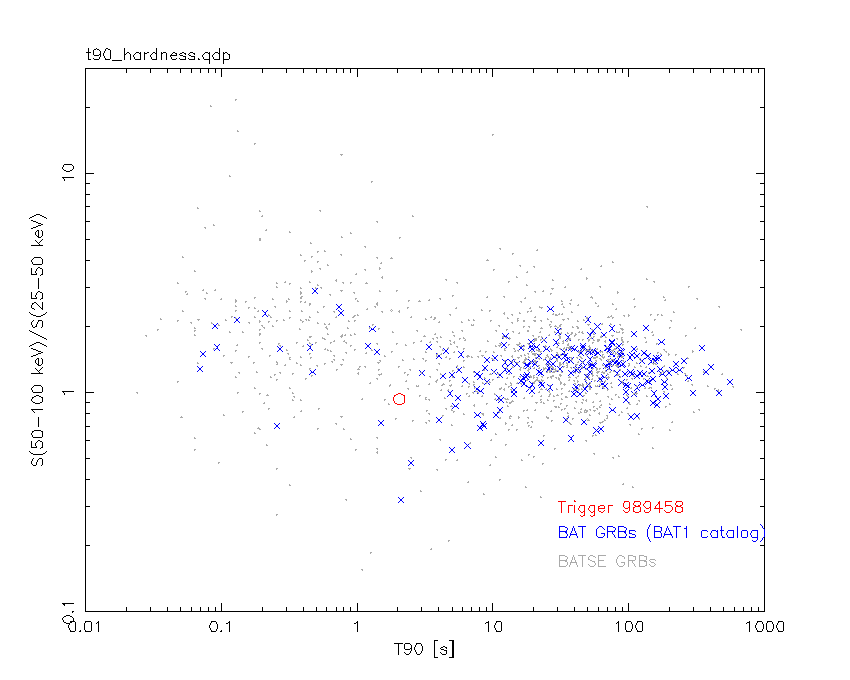
T90                                   = 2.04799997806549 sec.
Hardness ratio (energy fluence ratio) = 0.932773
Color vs. Color plot
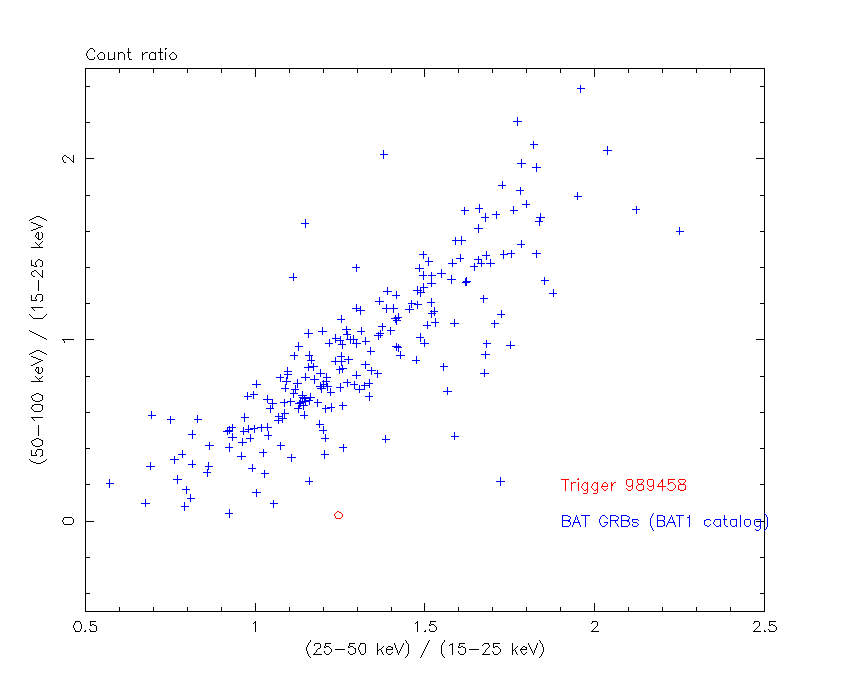
Count Ratio  (25-50 keV) / (15-25 keV) = 1.24519
Count Ratio (50-100 keV) / (15-25 keV) = 0.0321378
Mask shadow pattern
IMX = -5.601406343818897E-01, IMY = 1.678484570837852E-01
TIME vs. PHA plot around the trigger time
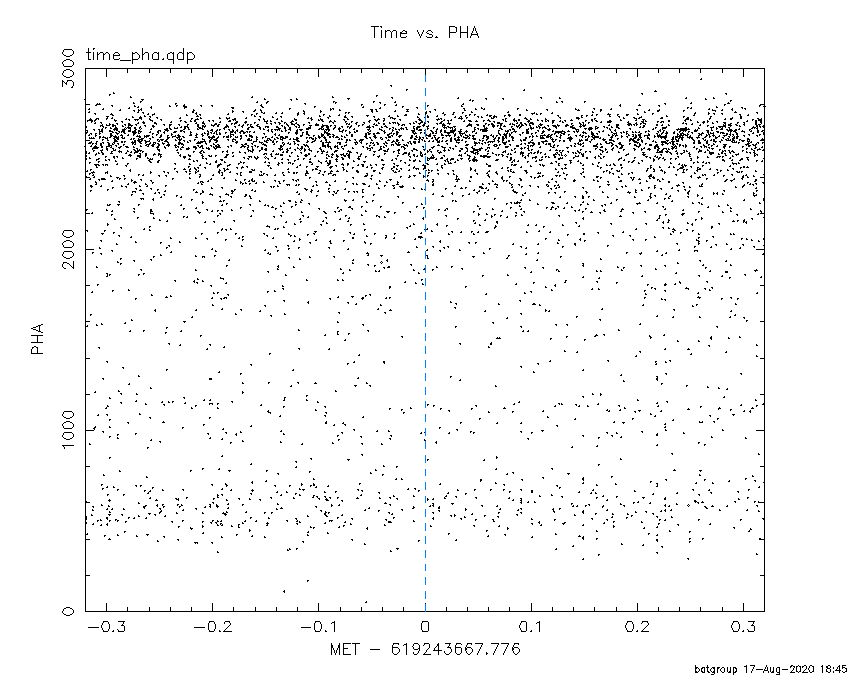
Blue+Cyan dotted lines: Time interval of the scaled map
From 0.000000 to 2.048000
TIME vs. DetID plot around the trigger time
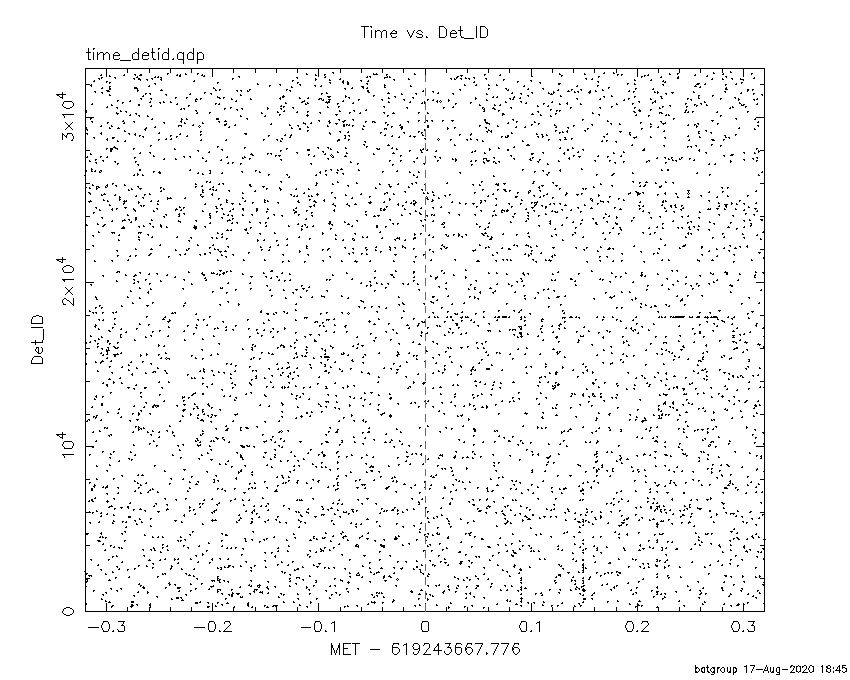
Blue+Cyan dotted lines: Time interval of the scaled map
From 0.000000 to 2.048000
100 us light curve (15-350 keV)
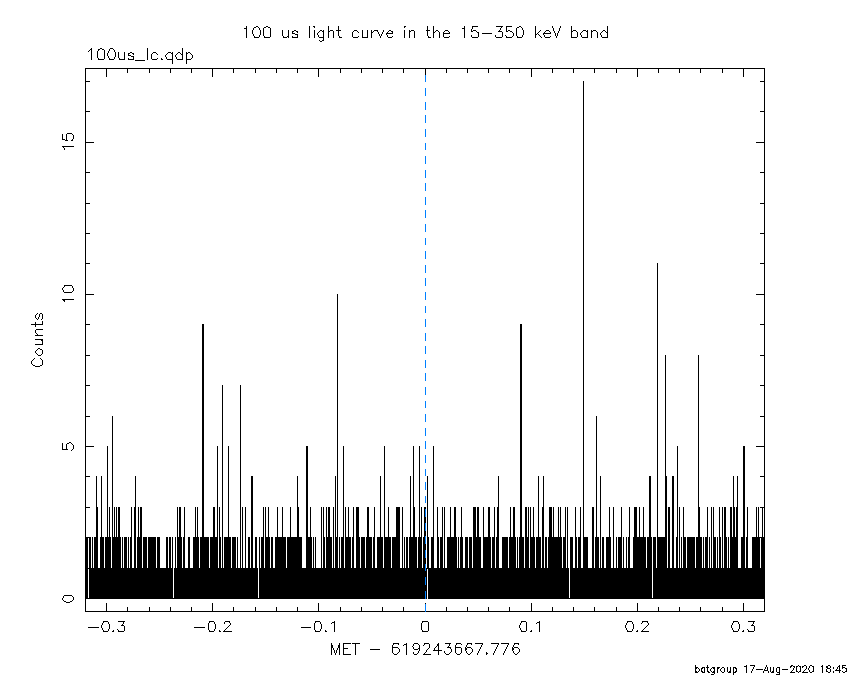
Blue+Cyan dotted lines: Time interval of the scaled map
From 0.000000 to 2.048000
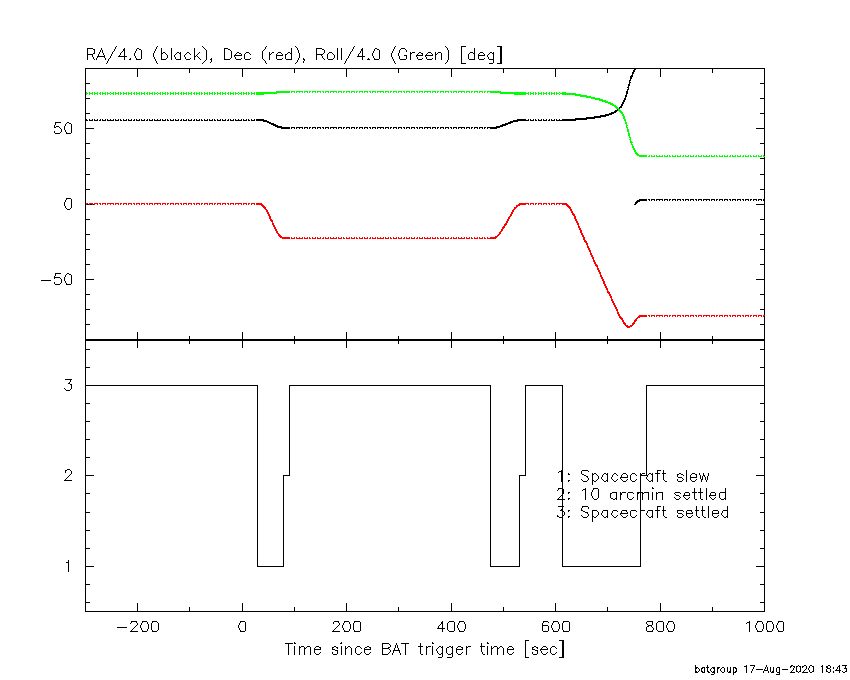
Spacecraft aspect plot
Bright source in the pre-burst/pre-slew/post-slew images
Pre-burst image of 15-350 keV band
Time interval of the image:
-239.776000 -11.776000

# RAcent  DECcent POSerr Theta    Phi  PeakCts   SNR AngSep     Name
#  [deg]    [deg]    ['] [deg]  [deg]                   [']
244.9720 -15.6455    0.6  26.8  103.8   7.0055  20.1    0.5	Sco X-1
254.4345  35.2801    3.1  45.7   13.1  -1.5625  -3.8    3.9	Her X-1
268.1949  31.1720    2.1  52.8   26.3   6.0145   5.5 ------	UNKNOWN
230.6056 -41.5861    3.1  42.3  148.3   2.3627   3.8 ------	UNKNOWN
189.7196 -45.3993    2.4  54.2 -174.9   4.2176   4.8 ------	UNKNOWN
186.5421 -15.8205    2.6  39.4 -139.0   1.8068   4.4 ------	UNKNOWN
175.0284 -14.7970    2.8  49.8 -133.0   5.4458   4.1 ------	UNKNOWN
Pre-slew background subtracted image of 15-350 keV band
Time interval of the image:
0.000000 2.048000

# RAcent  DECcent POSerr Theta    Phi  PeakCts   SNR AngSep     Name
#  [deg]    [deg]    ['] [deg]  [deg]                   [']
244.7992 -15.7239    8.0  26.7  104.2   0.0319   1.4   11.6	Sco X-1
254.5729  35.2925    5.9  45.8   13.2   0.0652   2.0    6.4	Her X-1
179.5393  -1.4597    2.7  43.5 -115.6   0.2578   4.3 ------	UNKNOWN
Post-slew image of 15-350 keV band
Time interval of the image:
79.424600 379.254000

# RAcent  DECcent POSerr Theta    Phi  PeakCts   SNR AngSep     Name
#  [deg]    [deg]    ['] [deg]  [deg]                   [']
170.3517 -60.4726    9.4  44.0  174.7  -0.6936  -1.2    9.1	Cen X-3
186.4711 -62.8062    7.4  41.7  163.5   0.8581   1.5    5.5	GX 301-2
244.9824 -15.6596    1.6  40.6   60.5   7.1173   7.1    1.2	Sco X-1
223.7389 -70.6455    2.5  49.6  143.5   7.1414   4.7 ------	UNKNOWN
Plot creation:
Mon Aug 17 18:45:46 EDT 2020