Estimated redshift from machine learning (Ukwatta et al. 2016) - may take a few minute to calcaulte
Image
Pre-slew 15.0-350.0 keV image (Event data)

#   RAcent    DECcent   POSerr    Theta     Phi              Peak Cts       SNR   Name
   21.5128    63.0640   0.0178    22.2992  -167.6158         0.6665924     10.784 TRIG_00992099

Foreground time interval of the image:
 -0.712  25.533 (delta_t =  26.245 [sec])
Background time interval of the image:
-239.368  -0.712 (delta_t = 238.656 [sec])
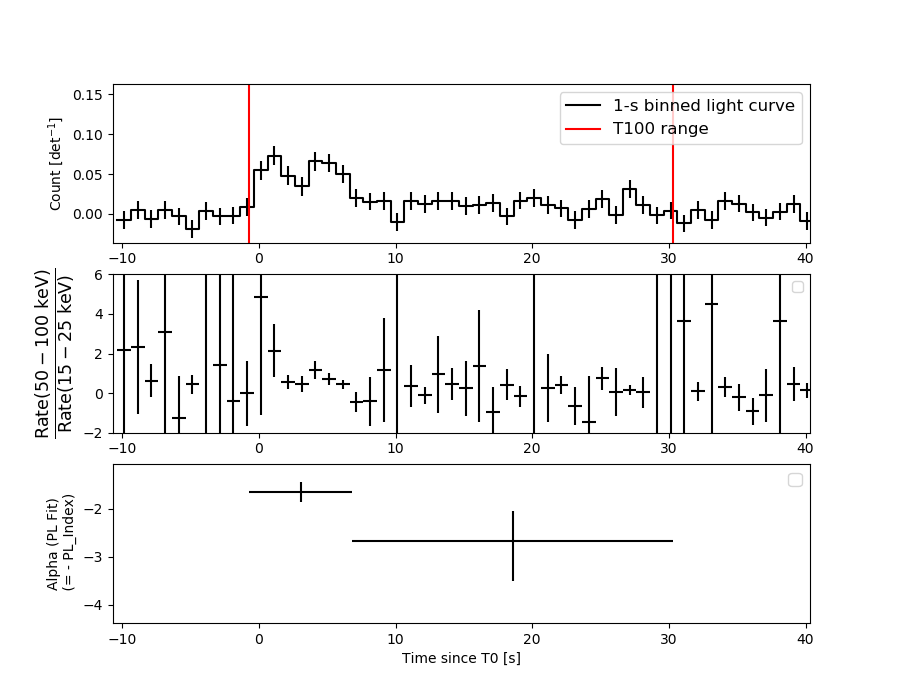
Lightcurves
Notes:
- 1) The mask-weighted light curves are using the flight position.
- 2) Multiple plots of different time binning/intervals are shown to cover all scenarios of short/long GRBs, rate/image triggers, and real/false positives.
- 3) For all the mask-weighted lightcurves, the y-axis units are counts/sec/det where a det is 0.4 x 0.4 = 0.16 sq cm.
- 4) The verticle lines correspond to following: green dotted lines are T50 interval, black dotted lines are T90 interval, blue solid line(s) is a spacecraft slew start time, and orange solid line(s) is a spacecraft slew end time.
- 5) Time of each bin is in the middle of the bin.
1 s binning
From T0-310 s to T0+310 s

From T100_start - 20 s to T100_end + 30 s

Full time interval

64 ms binning
Full time interval

From T100_start to T100_end

From T0-5 sec to T0+5 sec

16 ms binning
From T100_start-5 s to T100_start+5 s

Blue+Cyan dotted lines: Time interval of the scaled map
From 0.000000 to 2.048000
8 ms binning
From T100_start-3 s to T100_start+3 s

Blue+Cyan dotted lines: Time interval of the scaled map
From 0.000000 to 2.048000
2 ms binning
From T100_start-1 s to T100_start+1 s

Blue+Cyan dotted lines: Time interval of the scaled map
From 0.000000 to 2.048000
SN=5 or 10 sec. binning (whichever binning is satisfied first)

SN=5 or 10 sec. binning (T < 200 sec)

Quad-rate summed light curves (from T0-300s to T0+1000s)

Spectral Evolution
Spectra
Notes:
- 1) The fitting includes the systematic errors.
- 2) When the burst includes telescope slew time periods, the fitting uses an average response file made from multiple 5-s response files through out the slew time plus single time preiod for the non-slew times, and weighted by the total counts in the corresponding time period using addrmf. An average response file is needed becuase a spectral fit using the pre-slew DRM will introduce some errors in both a spectral shape and a normalization if the PHA file contains a lot of the slew/post-slew time interval.
- 3) For fits to more complicated models (e.g. a power-law over a cutoff power-law), the BAT team has decided to require a chi-square improvement of more than 6 for each extra dof.
Time averaged spectrum fit using the average DRM
Power-law model

Time interval is from   -0.712 sec. to   30.328 sec.

Spectral model in power-law:
------------------------------------------------------------
Parameters  : value       lower 90%   higher 90%
Photon index: 2.05410     ( -0.279909   0.308037 )
Norm@50keV  : 1.15468E-03    ( -0.000243188   0.000235258 )
------------------------------------------------------------
#Fit statistic  : Chi-Squared                   54.38     using 59 bins.
 Reduced chi-squared = 0.954035
# Null hypothesis probability of 5.74e-01 with 57 degrees of freedom

Photon flux (15-150 keV)    in 31.04 sec: 0.177668 ( -0.026269  0.026271 ) ph/cm2/s
Energy fluence (15-150 keV)             : 3.31743e-07 ( -6.23653e-08  6.49382e-08 ) ergs/cm2
Cutoff power-law model

Time interval is from   -0.712 sec. to   30.328 sec.
Spectral model in the cutoff power-law:
------------------------------------------------------------
Parameters  : value       lower 90%   higher 90%
Photon index: 1.72796     ( -1.32712   0.388281 )
Epeak [keV] : 32.6571      ( -30.893 -32.6571 )
Norm@50keV  : 1.82089E-03    ( -0.000974299   0.0105457 )
------------------------------------------------------------
#Fit statistic  : Chi-Squared                   54.09     using 59 bins.
 Reduced chi-squared = 0.965893
# Null hypothesis probability of 5.48e-01 with 56 degrees of freedom

Photon flux (15-150 keV)    in 31.04 sec: 0.175761 ( -0.026837  0.026891 ) ph/cm2/s
Energy fluence (15-150 keV)             : 3.18495e-07 ( -7.1555e-08  6.99697e-08 ) ergs/cm2
Band function

Time interval is from   -0.712 sec. to   30.328 sec.


Spectral model in the Band function:
------------------------------------------------------------
Parameters  : value       lower 90%   higher 90%
alpha       :    (     )
beta        :     (     )
Epeak [keV] :       (   )
Norm@50keV   :     (     )
------------------------------------------------------------

Photon flux (15-150 keV)    in  sec:  (    ) ph/cm2/s
Energy fluence (15-150 keV)             : 0 ( 0  0 ) ergs/cm2
Single BB

Spectral model blackbody:
------------------------------------------------------------
Parameters  : value    Lower 90%  Upper 90%
kT [keV]    : 8.23197  (-1.42772  1.80875)
R^2/D10^2   : 0.172750  (-0.0927145   0.192684)
(R is the radius in km and D10 is the distance to the source in units of 10 kpc)
------------------------------------------------------------
#Fit statistic  : Chi-Squared                   63.66     using 59 bins.
 Reduced chi-squared =
# Null hypothesis probability of 2.54e-01 with 57 degrees of freedom

Energy  Fluence     90% Error
[keV]   [erg/cm2]   [erg/cm2]
15- 25  6.706e-08   1.858e-08
25- 50  1.233e-07   3.099e-08
50-150  3.553e-08   1.644e-08
15-150  2.259e-07   5.466e-08
Thermal bremsstrahlung (OTTB)

Spectral model: thermal bremsstrahlung
------------------------------------------------------------
Parameters  : value         Lower 90%    Upper 90%
kT [keV]    : 57.4936       (-21.3461      43.5342)
Norm        : 0.950136       (-0.218632     0.300287)
------------------------------------------------------------
#Fit statistic  : Chi-Squared                   54.41     using 59 bins.
 Reduced chi-squared =
# Null hypothesis probability of 5.73e-01 with 57 degrees of freedom

Energy  Fluence     90% Error
[keV]   [erg/cm2]   [erg/cm2]
15- 25  7.359e-08   1.471e-08
25- 50  1.105e-07   2.036e-08
50-150  1.213e-07   5.373e-08
15-150  3.054e-07   7.063e-08
Double BB

Spectral model: bbodyrad<1> + bbodyrad<2>
------------------------------------------------------------
Parameters  : value         Lower 90%    Upper 90%
kT1 [keV]   : 5.74645        (-1.51524      1.69778)
R1^2/D10^2  : 0.560888        (-0.348918      1.26564)
kT2 [keV]   : 22.5125        (-8.68603      25.284)
R2^2/D10^2  : 2.44530E-03    (-0.00226228   0.0142226)
------------------------------------------------------------
#Fit statistic  : Chi-Squared                   52.11     using 59 bins.
 Reduced chi-squared =
# Null hypothesis probability of 5.86e-01 with 55 degrees of freedom

Energy  Fluence     90% Error
[keV]   [erg/cm2]   [erg/cm2]
15- 25  7.865e-08   4.426e-08
25- 50  1.027e-07   4.793e-08
50-150  1.479e-07   8.739e-08
15-150  3.292e-07   1.662e-07
Peak spectrum fit
Power-law model

Time interval is from    0.292 sec. to    1.292 sec.

Spectral model in power-law:
------------------------------------------------------------
Parameters  : value       lower 90%   higher 90%
Photon index: 1.07005     ( -0.415157   0.393538 )
Norm@50keV  : 5.35172E-03    ( -0.00124593   0.00124176 )
------------------------------------------------------------
#Fit statistic  : Chi-Squared                   60.82     using 59 bins.
 Reduced chi-squared = 1.06702
# Null hypothesis probability of 3.40e-01 with 57 degrees of freedom

Photon flux (15-150 keV)    in 1 sec: 0.619089 ( -0.147095  0.14792 ) ph/cm2/s
Energy fluence (15-150 keV)             : 5.65067e-08 ( -1.41444e-08  1.43319e-08 ) ergs/cm2
Cutoff power-law model

Time interval is from    0.292 sec. to    1.292 sec.
Spectral model in the cutoff power-law:
------------------------------------------------------------
Parameters  : value       lower 90%   higher 90%
Photon index: 0.388637     ( -2.09991   2.08468 )
Epeak [keV] : 133.399      ( -133.393 -133.393 )
Norm@50keV  : 1.08718E-02    ( -0.00656608   0.064855 )
------------------------------------------------------------
#Fit statistic  : Chi-Squared                   60.23     using 59 bins.
 Reduced chi-squared = 1.07554
# Null hypothesis probability of 3.26e-01 with 56 degrees of freedom

Photon flux (15-150 keV)    in 1 sec: 0.601722 ( -0.152666  0.15281 ) ph/cm2/s
Energy fluence (15-150 keV)             : 5.45519e-08 ( -1.49743e-08  1.50707e-08 ) ergs/cm2
Band function

Time interval is from    0.292 sec. to    1.292 sec.


Spectral model in the Band function:
------------------------------------------------------------
Parameters  : value       lower 90%   higher 90%
alpha       :    (     )
beta        :     (     )
Epeak [keV] :       (   )
Norm@50keV   :     (     )
------------------------------------------------------------

Photon flux (15-150 keV)    in  sec:  (    ) ph/cm2/s
Energy fluence (15-150 keV)             : 0 ( 0  0 ) ergs/cm2
Single BB

Spectral model blackbody:
------------------------------------------------------------
Parameters  : value    Lower 90%  Upper 90%
kT [keV]    : 21.6018  (-5.54143  8.2558)
R^2/D10^2   : 2.33259E-02  (-0.014877   0.0371598)
(R is the radius in km and D10 is the distance to the source in units of 10 kpc)
------------------------------------------------------------
#Fit statistic  : Chi-Squared                   62.22     using 59 bins.
 Reduced chi-squared =
# Null hypothesis probability of 2.96e-01 with 57 degrees of freedom

Energy  Fluence     90% Error
[keV]   [erg/cm2]   [erg/cm2]
15- 25  2.031e-09   1.029e-09
25- 50  1.062e-08   4.865e-09
50-150  3.701e-08   2.047e-08
15-150  4.967e-08   2.675e-08
Thermal bremsstrahlung (OTTB)

Spectral model: thermal bremsstrahlung
------------------------------------------------------------
Parameters  : value         Lower 90%    Upper 90%
kT [keV]    : 200.000       (-76.5166      -200)
Norm        : 2.54341       (-0.609464     0.609464)
------------------------------------------------------------
#Fit statistic  : Chi-Squared                   64.49     using 59 bins.
 Reduced chi-squared =
# Null hypothesis probability of 2.31e-01 with 57 degrees of freedom

Energy  Fluence     90% Error
[keV]   [erg/cm2]   [erg/cm2]
15- 25  6.333e-09   3.800e-09
25- 50  1.218e-08   7.160e-09
50-150  2.672e-08   1.576e-08
15-150  4.523e-08   2.719e-08
Double BB

Spectral model: bbodyrad<1> + bbodyrad<2>
------------------------------------------------------------
Parameters  : value         Lower 90%    Upper 90%
kT1 [keV]   : 6.85838        (-7.09369      21.5448)
R1^2/D10^2  : 0.434319        (-0.416989      83.8209)
kT2 [keV]   : 28.1504        (-26.7151      -28.3164)
R2^2/D10^2  : 8.85324E-03    (-0.00437987   0.0164075)
------------------------------------------------------------
#Fit statistic  : Chi-Squared                   59.29     using 59 bins.
 Reduced chi-squared =
# Null hypothesis probability of 3.22e-01 with 55 degrees of freedom

Energy  Fluence     90% Error
[keV]   [erg/cm2]   [erg/cm2]
15- 25  4.352e-09   2.625e-09
25- 50  1.107e-08   6.085e-09
50-150  3.983e-08   2.419e-08
15-150  5.525e-08   3.060e-08
Pre-slew spectrum (Pre-slew PHA with pre-slew DRM)
Power-law model
Spectral model in power-law:
------------------------------------------------------------
Parameters  : value       lower 90%   higher 90%
Photon index: 1.97885     ( -0.277774   0.303617 )
Norm@50keV  : 1.31306E-03    ( -0.000263944   0.000254207 )
------------------------------------------------------------
#Fit statistic  : Chi-Squared                   52.98     using 59 bins.
 Reduced chi-squared =
# Null hypothesis probability of 6.27e-01 with 57 degrees of freedom

Photon flux (15-150 keV)    in 26.24 sec: 0.195068 ( -0.0286939  0.028694 ) ph/cm2/s
Energy fluence (15-150 keV)             : 3.17415e-07 ( -5.87865e-08  6.09802e-08 ) ergs/cm2
Cutoff power-law model
Spectral model in the cutoff power-law:
------------------------------------------------------------
Parameters  : value       lower 90%   higher 90%
Photon index: 1.78024     ( -1.2274   0.383449 )
Epeak [keV] : 45.5732      ( -45.2549 -45.5732 )
Norm@50keV  : 1.71790E-03    ( -0.0017179   0.00747318 )
------------------------------------------------------------
#Fit statistic  : Chi-Squared                   52.87     using 59 bins.
 Reduced chi-squared =
# Null hypothesis probability of 5.94e-01 with 56 degrees of freedom

Photon flux (15-150 keV)    in 26.24 sec: 0.193675 ( -0.029134  0.029431 ) ph/cm2/s
Energy fluence (15-150 keV)             : 3.10322e-07 ( -6.71508e-08  3.51537e-08 ) ergs/cm2
Band function
Spectral model in the Band function:
------------------------------------------------------------
Parameters  : value       lower 90%   higher 90%
alpha       :    (     )
beta        :     (     )
Epeak [keV] :       (   )
Norm@50keV   :     (     )
------------------------------------------------------------

Photon flux (15-150 keV)    in  sec:  (    ) ph/cm2/s
Energy fluence (15-150 keV)             : 0 ( 0  0 ) ergs/cm2
S(25-50 keV) vs. S(50-100 keV) plot

S(25-50 keV)  = 1.02e-07
S(50-100 keV) = 9.78e-08
T90 vs. Hardness ratio plot

T90                                   = 26.9439998865128 sec.
Hardness ratio (energy fluence ratio) = 0.958824
Color vs. Color plot

Count Ratio  (25-50 keV) / (15-25 keV) = 0.974237
Count Ratio (50-100 keV) / (15-25 keV) = 0.520128
Mask shadow pattern

IMX = -4.005701245528479E-01, IMY = 8.795511655533213E-02
TIME vs. PHA plot around the trigger time
Blue+Cyan dotted lines: Time interval of the scaled map
From 0.000000 to 2.048000
TIME vs. DetID plot around the trigger time

Blue+Cyan dotted lines: Time interval of the scaled map
From 0.000000 to 2.048000
100 us light curve (15-350 keV)

Blue+Cyan dotted lines: Time interval of the scaled map
From 0.000000 to 2.048000
Spacecraft aspect plot
Bright source in the pre-burst/pre-slew/post-slew images
Pre-burst image of 15-350 keV band
Time interval of the image:
-239.368000 -0.712000

# RAcent  DECcent POSerr Theta    Phi  PeakCts   SNR AngSep     Name
#  [deg]    [deg]    ['] [deg]  [deg]                   [']
 83.6145  22.0082    0.7  44.7  -49.1   9.9860  15.5    1.1	Crab
356.1080  18.7787    2.3  40.8   96.4   4.9701   5.1 ------	UNKNOWN
 18.6218   6.7705    2.4  38.6   57.0   2.6128   4.7 ------	UNKNOWN
 51.0199  -5.5505    3.3  49.9    9.1   2.1389   3.4 ------	UNKNOWN
 23.5766  37.6858    2.1  10.3   96.5   1.3160   5.6 ------	UNKNOWN
 13.0712  53.5854    2.7  18.7  164.0   0.9869   4.3 ------	UNKNOWN
 78.4117  36.4747    2.7  33.2  -65.1   1.8446   4.3 ------	UNKNOWN
Pre-slew background subtracted image of 15-350 keV band
Time interval of the image:
-0.712000 25.532600

# RAcent  DECcent POSerr Theta    Phi  PeakCts   SNR AngSep     Name
#  [deg]    [deg]    ['] [deg]  [deg]                   [']
 83.6777  22.0665   16.2  44.7  -49.2  -0.1161  -0.7    4.0	Crab
 21.5127  63.0640    1.1  22.3 -167.6   0.6666  10.8 ------	UNKNOWN
Post-slew image of 15-350 keV band
Time interval of the image:
68.932590 604.232600

# RAcent  DECcent POSerr Theta    Phi  PeakCts   SNR AngSep     Name
#  [deg]    [deg]    ['] [deg]  [deg]                   [']
308.0043  40.9533   14.8  47.0  137.9   1.6911   0.8    4.8	Cyg X-3
326.1592  38.3409   30.1  40.9  119.3  -0.6639  -0.4    1.3	Cyg X-2
286.8774  43.8813    3.5  53.7  156.6   8.6149   3.3 ------	UNKNOWN
 33.4038  26.2964    2.7  37.6   21.8   3.1686   4.2 ------	UNKNOWN
266.9617  48.8197    2.2  56.8  173.9  13.3591   5.3 ------	UNKNOWN
223.6385  67.7275    3.0  48.3 -151.5   4.1470   3.8 ------	UNKNOWN
 84.9630  32.5345    2.7  49.5  -43.5   7.3317   4.2 ------	UNKNOWN
Plot creation:
Sun Nov 15 21:51:37 EST 2020