Estimated redshift from machine learning (Ukwatta et al. 2016) - may take a few minutes to calcaulte
Image
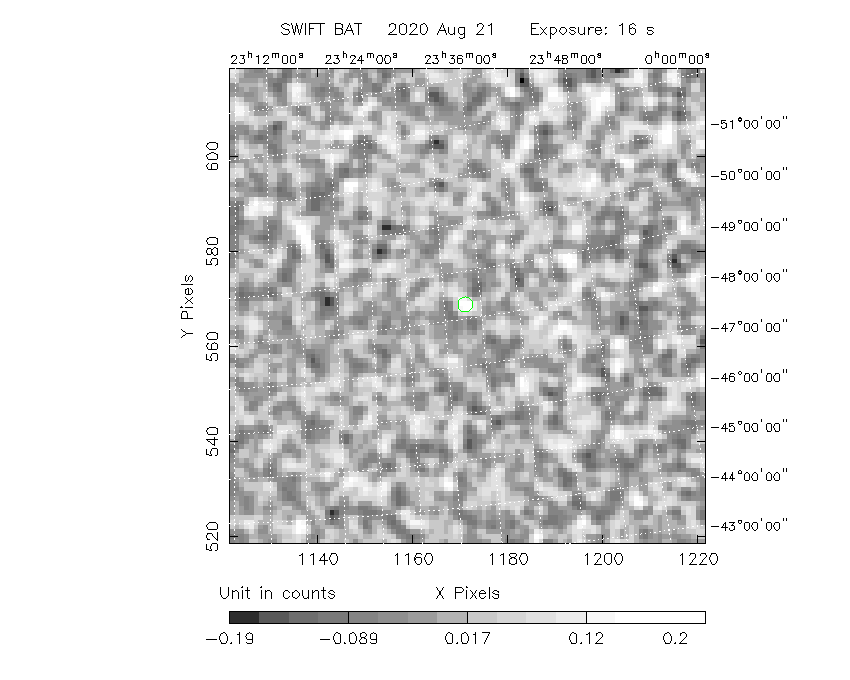
Pre-slew 15-350 keV image (Event data; bkg subtracted)
#   RAcent  DECcent POSerr  Theta    Phi     Peak Cts     SNR  Name
  353.5840 -48.3042 0.0408   32.7 -162.4       0.2581     4.7  TRIG_00992444
------------------------------------------

Foreground time interval of the image:
  0.000  16.384 (delta_t =  16.384 [sec])
Background time interval of the image:
-126.507 -35.008 (delta_t =  91.499 [sec])
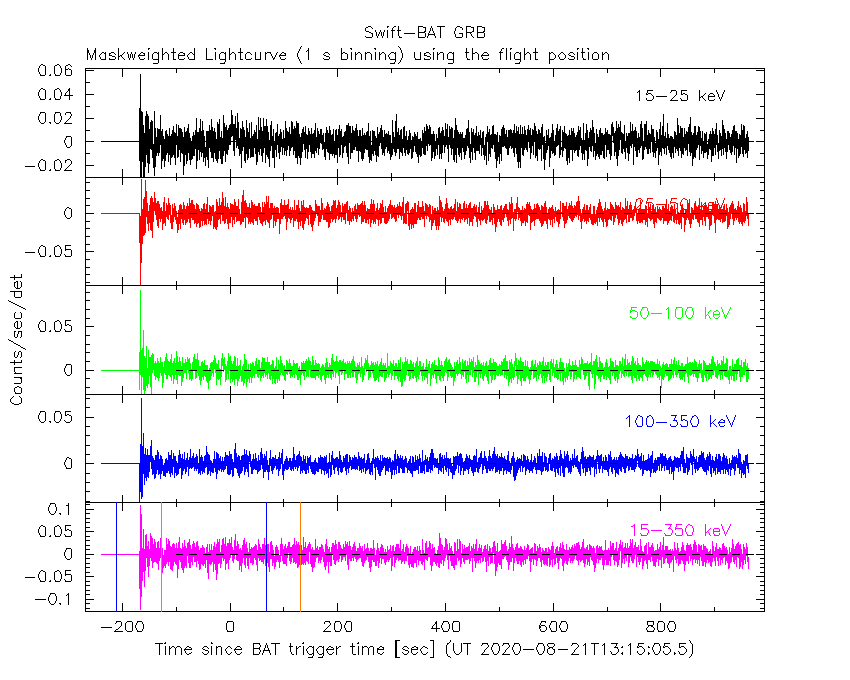
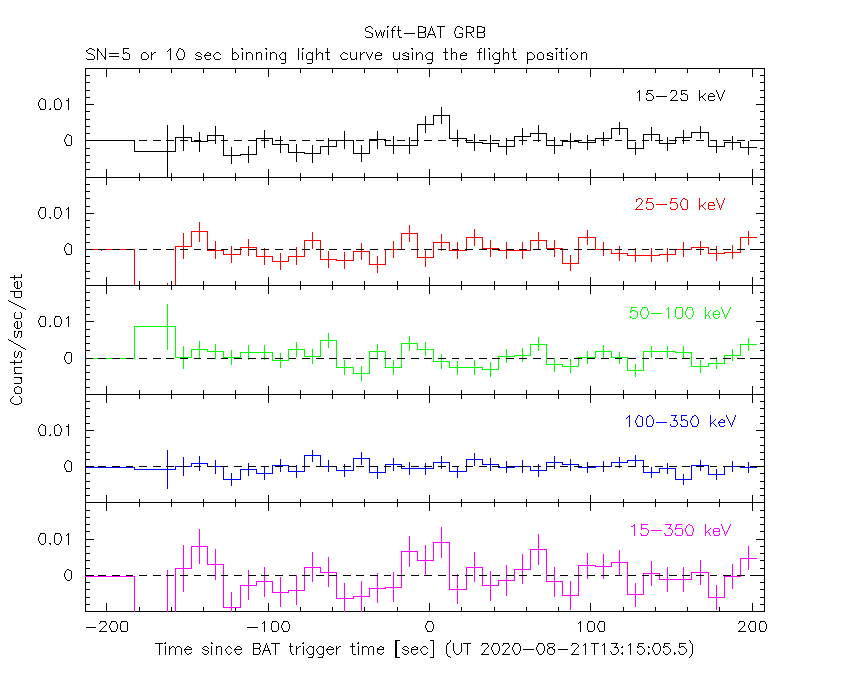
Lightcurves
Notes:
- 1) All plots contain as much data as has been downloaded to date.
- 2) The mask-weighted light curves are using the flight position.
- 3) Multiple plots of different time binning/intervals are shown to cover all scenarios of short/long GRBs, rate/image triggers, and real/false positives.
- 4) For all the mask-weighted lightcurves, the y-axis units are counts/sec/det where a det is 0.4 x 0.4 = 0.16 sq cm.
- 5) The verticle lines correspond to following: green dotted lines are T50 interval, black dotted lines are T90 interval, blue solid line(s) is a spacecraft slew start time, and orange solid line(s) is a spacecraft slew end time.
- 6) Time of each bin is in the middle of the bin.
1 s binning
From T0-310 s to T0+310 s

From T100_start - 20 s to T100_end + 30 s

Full time interval
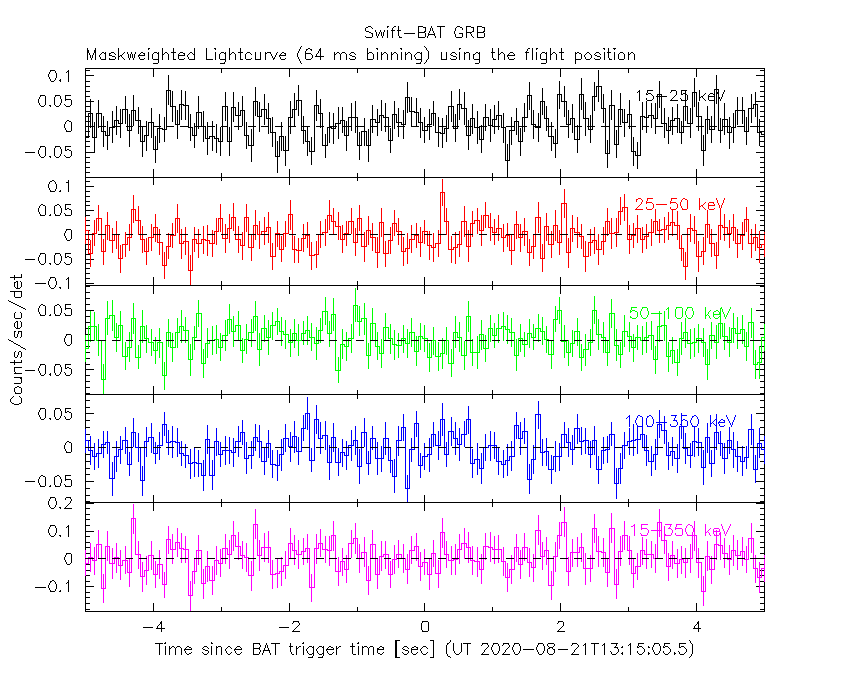
64 ms binning
Full time interval

From T100_start to T100_end
From T0-5 sec to T0+5 sec
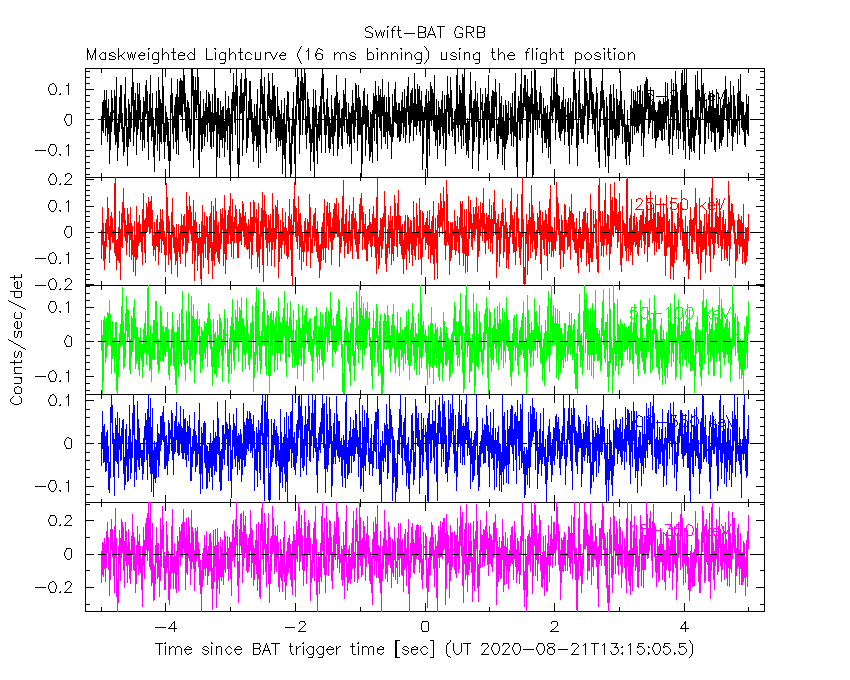
16 ms binning
From T100_start-5 s to T100_start+5 s
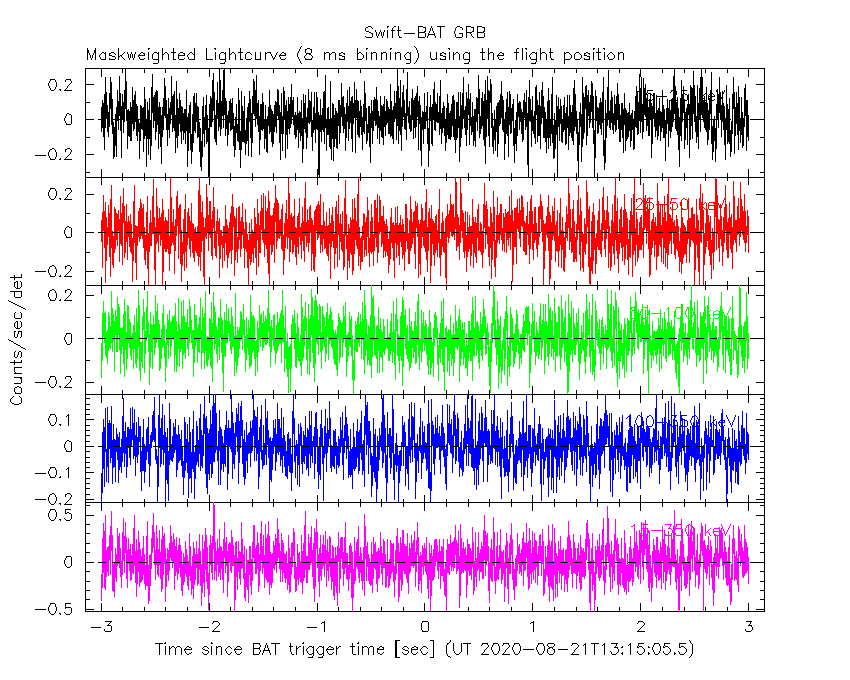
8 ms binning
From T100_start-3 s to T100_start+3 s
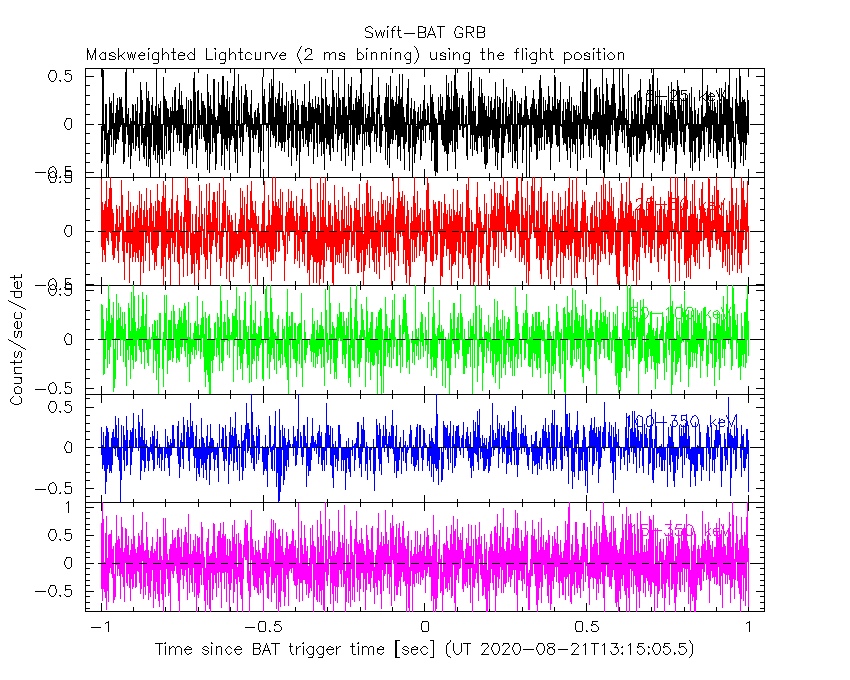
2 ms binning
From T100_start-1 s to T100_start+1 s
SN=5 or 10 sec. binning (whichever binning is satisfied first)
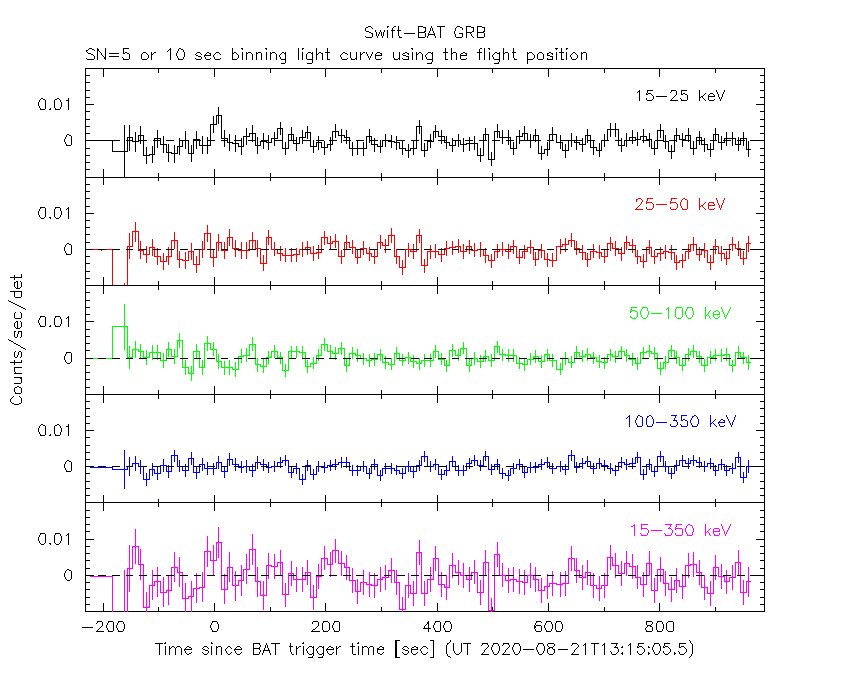
SN=5 or 10 sec. binning (T < 200 sec)
Spectra
Notes:
- 1) The fitting includes the systematic errors.
- 2) For long bursts, a spectral fit of the pre-slew DRM will introduce some errors in both a spectral shape and a normalization if the PHA file contains a lot of the slew/post-slew time interval.
- 3) For fits to more complicated models (e.g. a power-law over a cutoff power-law), the BAT team has decided to require a chi-square improvement of more than 6 for each extra dof.
- 4) For short bursts (T90<1sec), the specrtum is also fit with Blackbody, OTTB, and Double Blackbody.
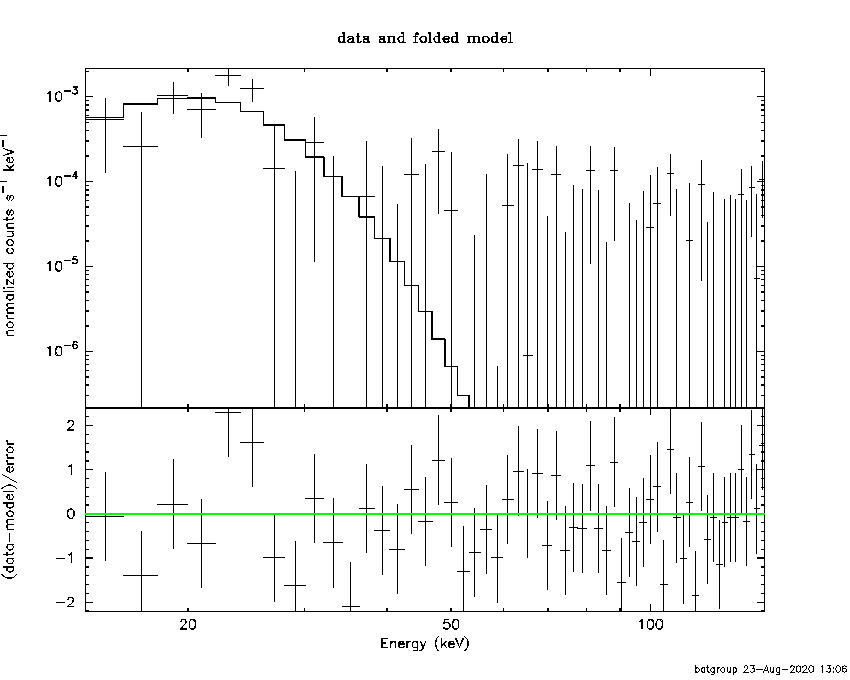
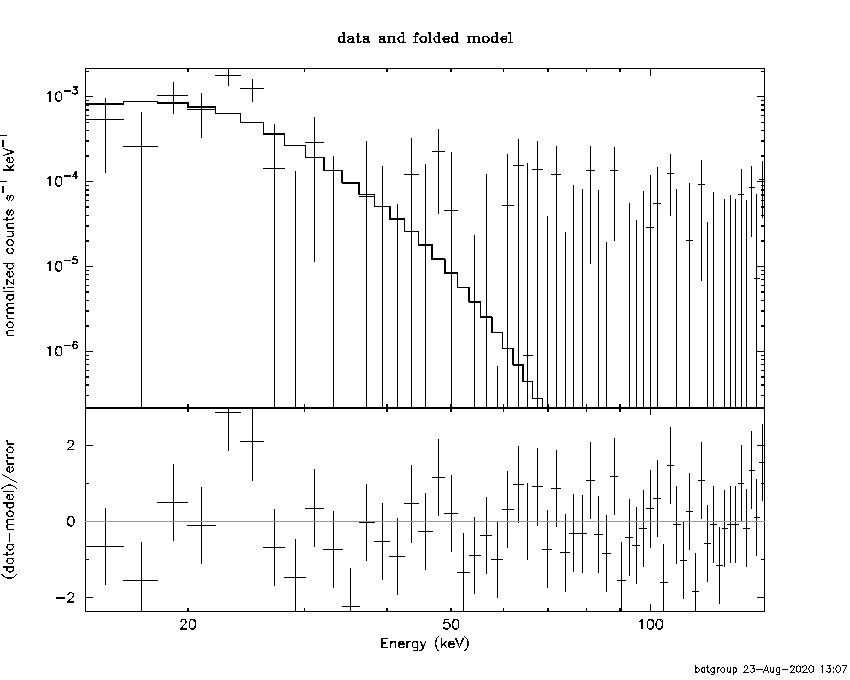
Time averaged spectrum fit using the pre-slew DRM
Power-law model

Time interval is from    0.000 sec. to   16.384 sec.

Spectral model in power-law:
------------------------------------------------------------
Parameters  : value       lower 90%   higher 90%
Photon index: 3.35145     ( -0.865843   1.13613 )
Norm@50keV  : 2.80732E-04    ( -0.000278007   0.000293424 )
------------------------------------------------------------
#Fit statistic : Chi-Squared =          64.34 using 59 PHA bins.
# Reduced chi-squared =          1.129 for     57 degrees of freedom
# Null hypothesis probability =   2.352267e-01

Photon flux (15-150 keV)    in 16.38 sec: 0.100782 ( -0.0394713  0.0405547 ) ph/cm2/s
Energy fluence (15-150 keV)             : 6.62286e-08 ( -2.84814e-08  3.65222e-08 ) ergs/cm2
Cutoff power-law model
Time interval is from    0.000 sec. to   16.384 sec.
Spectral model in the cutoff power-law:
------------------------------------------------------------
Parameters  : value       lower 90%   higher 90%
Photon index: -9.99898     ( 9.9997   4.79437 )
Epeak [keV] : 21.3283      ( -2.47542 2.46851 )
Norm@50keV  : 7.46662E+06    ( -7.51278e+06   4.98858e+07 )
------------------------------------------------------------
#Fit statistic : Chi-Squared =          53.37 using 59 PHA bins.
# Reduced chi-squared =         0.9529 for     56 degrees of freedom
# Null hypothesis probability =   5.752279e-01

Photon flux (15-150 keV)    in 16.38 sec: 0.119636 0.119846 (    ) ph/cm2/s
Energy fluence (15-150 keV)             : 1.724e-17 ( 0  0 ) ergs/cm2
Band function
Time interval is from    0.000 sec. to   16.384 sec.

Spectral model in the Band function:
------------------------------------------------------------
Parameters  : value       lower 90%   higher 90%
alpha       : 5.00000   ( -1.4033   -5 )
beta        : -9.37167    ( 9.37167   5.33909 )
Epeak [keV] : 20.0713      ( -3.17495 3.50581 )
Norm@50keV   : 955.353    ( -302.008   2550.36 )
------------------------------------------------------------
#Fit statistic : Chi-Squared =          56.22 using 59 PHA bins.
# Reduced chi-squared =          1.022 for     55 degrees of freedom
# Null hypothesis probability =   4.289096e-01

Photon flux (15-150 keV)    in 16.38 sec:  (    ) ph/cm2/s
Energy fluence (15-150 keV)             : 0 ( 0  0 ) ergs/cm2
Single BB

Spectral model blackbody:
------------------------------------------------------------
Parameters  : value    Lower 90%  Upper 90%
kT [keV]    : 4.47917  (-1.02995  1.23424)
R^2/D10^2   : 1.69634  (-1.68029   3.90281)
(R is the radius in km and D10 is the distance to the source in units of 10 kpc)
------------------------------------------------------------
#Fit statistic : Chi-Squared =          58.62 using 59 PHA bins.
# Reduced chi-squared =          1.028 for     57 degrees of freedom
# Null hypothesis probability =   4.159071e-01

Energy  Fluence     90% Error
[keV]   [erg/cm2]   [erg/cm2]
15- 25  4.260e-08   2.569e-08
25- 50  2.100e-08   1.411e-08
50-150  4.867e-10   5.458e-10
15-150  6.409e-08   3.948e-08
Thermal bremsstrahlung (OTTB)

Spectral model: thermal bremsstrahlung
------------------------------------------------------------
Parameters  : value         Lower 90%    Upper 90%
kT [keV]    : 11.9054       (-5.12011      10.2668)
Norm        : 2.65282       (-1.58388     4.50163)
------------------------------------------------------------
#Fit statistic : Chi-Squared =          61.67 using 59 PHA bins.
# Reduced chi-squared =          1.082 for     57 degrees of freedom
# Null hypothesis probability =   3.126261e-01

Energy  Fluence     90% Error
[keV]   [erg/cm2]   [erg/cm2]
15- 25  3.868e-08   2.277e-08
25- 50  2.072e-08   1.345e-08
50-150  2.217e-09   2.577e-09
15-150  6.162e-08   3.815e-08
Double BB

Spectral model: bbodyrad<1> + bbodyrad<2>
------------------------------------------------------------
Parameters  : value         Lower 90%    Upper 90%
kT1 [keV]   : 4.50180        (-0.984925      1.28018)
R1^2/D10^2  : 1.66329        (-1.65041      3.92934)
kT2 [keV]   : 9.99616E-04        (-0.000999616      -0.000999616)
R2^2/D10^2  : 1.19878E-04    (-0.000120098   -0.000120098)
------------------------------------------------------------
#Fit statistic : Chi-Squared =          58.61 using 59 PHA bins.
# Reduced chi-squared =          1.066 for     55 degrees of freedom
# Null hypothesis probability =   3.443809e-01

Energy  Fluence     90% Error
[keV]   [erg/cm2]   [erg/cm2]
15- 25  0.000e+00   0.000e+00
25- 50  0.000e+00   0.000e+00
50-150  0.000e+00   0.000e+00
15-150  0.000e+00   0.000e+00
Peak spectrum fit
Power-law model

Time interval is from    0.000 sec. to   16.384 sec.

Spectral model in power-law:
------------------------------------------------------------
Parameters  : value       lower 90%   higher 90%
Photon index: 3.35145     ( -0.865843   1.13613 )
Norm@50keV  : 2.80732E-04    ( -0.000278007   0.000293424 )
------------------------------------------------------------
#Fit statistic : Chi-Squared =          64.34 using 59 PHA bins.
# Reduced chi-squared =          1.129 for     57 degrees of freedom
# Null hypothesis probability =   2.352267e-01

Photon flux (15-150 keV)    in 16.38 sec: 0.100782 ( -0.0394713  0.0405547 ) ph/cm2/s
Energy fluence (15-150 keV)             : 6.62286e-08 ( -2.84814e-08  3.65222e-08 ) ergs/cm2
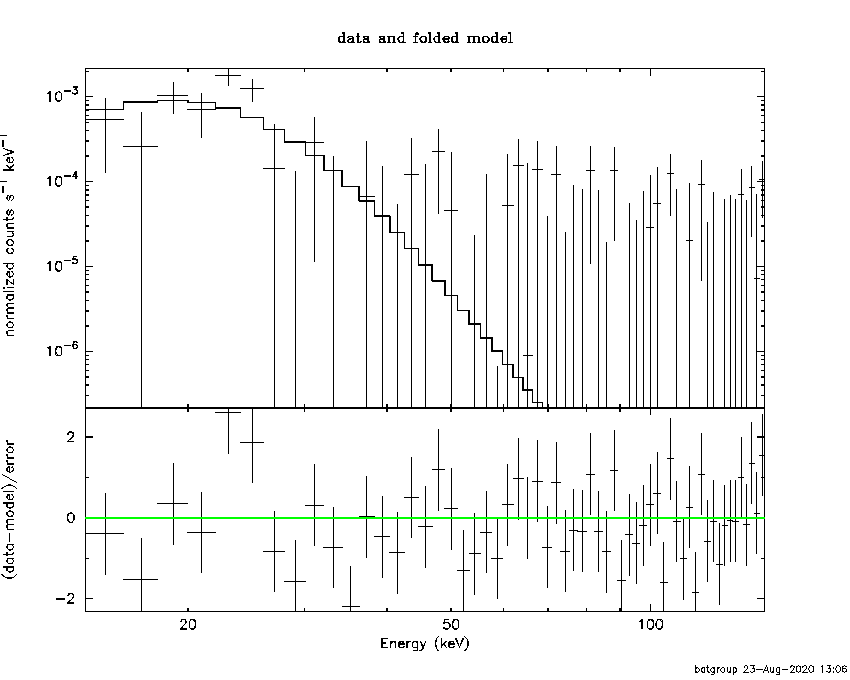
Cutoff power-law model
Time interval is from    0.000 sec. to   16.384 sec.
Spectral model in the cutoff power-law:
------------------------------------------------------------
Parameters  : value       lower 90%   higher 90%
Photon index: -9.99898     ( 9.9997   4.79437 )
Epeak [keV] : 21.3283      ( -2.47542 2.46851 )
Norm@50keV  : 7.46662E+06    ( -7.51278e+06   4.98858e+07 )
------------------------------------------------------------
#Fit statistic : Chi-Squared =          53.37 using 59 PHA bins.
# Reduced chi-squared =         0.9529 for     56 degrees of freedom
# Null hypothesis probability =   5.752279e-01

Photon flux (15-150 keV)    in 16.38 sec: 0.119636 0.119846 (    ) ph/cm2/s
Energy fluence (15-150 keV)             : 1.724e-17 ( 0  0 ) ergs/cm2
Band function

Time interval is from    0.000 sec. to   16.384 sec.

Spectral model in the Band function:
------------------------------------------------------------
Parameters  : value       lower 90%   higher 90%
alpha       : 5.00000   ( -1.4033   -5 )
beta        : -9.37167    ( 9.37167   5.33909 )
Epeak [keV] : 20.0713      ( -3.17495 3.50581 )
Norm@50keV   : 955.353    ( -302.008   2550.36 )
------------------------------------------------------------
#Fit statistic : Chi-Squared =          56.22 using 59 PHA bins.
# Reduced chi-squared =          1.022 for     55 degrees of freedom
# Null hypothesis probability =   4.289096e-01

Photon flux (15-150 keV)    in 16.38 sec:  (    ) ph/cm2/s
Energy fluence (15-150 keV)             : 0 ( 0  0 ) ergs/cm2
Single BB
Spectral model blackbody:
------------------------------------------------------------
Parameters  : value    Lower 90%  Upper 90%
kT [keV]    : 4.47917  (-1.02995  1.23424)
R^2/D10^2   : 1.69634  (-1.68029   3.90281)
(R is the radius in km and D10 is the distance to the source in units of 10 kpc)
------------------------------------------------------------
#Fit statistic : Chi-Squared =          58.62 using 59 PHA bins.
# Reduced chi-squared =          1.028 for     57 degrees of freedom
# Null hypothesis probability =   4.159071e-01

Energy  Fluence     90% Error
[keV]   [erg/cm2]   [erg/cm2]
15- 25  4.260e-08   2.628e-08
25- 50  2.100e-08   1.499e-08
50-150  4.867e-10   6.058e-10
15-150  6.409e-08   3.862e-08
Thermal bremsstrahlung (OTTB)
Spectral model: thermal bremsstrahlung
------------------------------------------------------------
Parameters  : value         Lower 90%    Upper 90%
kT [keV]    : 11.9054       (-5.12011      10.2668)
Norm        : 2.65282       (-1.58388     4.50163)
------------------------------------------------------------
#Fit statistic : Chi-Squared =          61.67 using 59 PHA bins.
# Reduced chi-squared =          1.082 for     57 degrees of freedom
# Null hypothesis probability =   3.126261e-01

Energy  Fluence     90% Error
[keV]   [erg/cm2]   [erg/cm2]
15- 25  3.868e-08   2.264e-08
25- 50  2.072e-08   1.397e-08
50-150  2.217e-09   2.662e-09
15-150  6.162e-08   3.940e-08
Double BB

Spectral model: bbodyrad<1> + bbodyrad<2>
------------------------------------------------------------
Parameters  : value         Lower 90%    Upper 90%
kT1 [keV]   : 4.50180        (-0.984925      1.28018)
R1^2/D10^2  : 1.66329        (-1.65041      3.92934)
kT2 [keV]   : 9.99616E-04        (-0.000999616      -0.000999616)
R2^2/D10^2  : 1.19878E-04    (-0.000120098   -0.000120098)
------------------------------------------------------------
#Fit statistic : Chi-Squared =          58.61 using 59 PHA bins.
# Reduced chi-squared =          1.066 for     55 degrees of freedom
# Null hypothesis probability =   3.443809e-01

Energy  Fluence     90% Error
[keV]   [erg/cm2]   [erg/cm2]
15- 25  0.000e+00   0.000e+00
25- 50  0.000e+00   0.000e+00
50-150  0.000e+00   0.000e+00
15-150  0.000e+00   0.000e+00
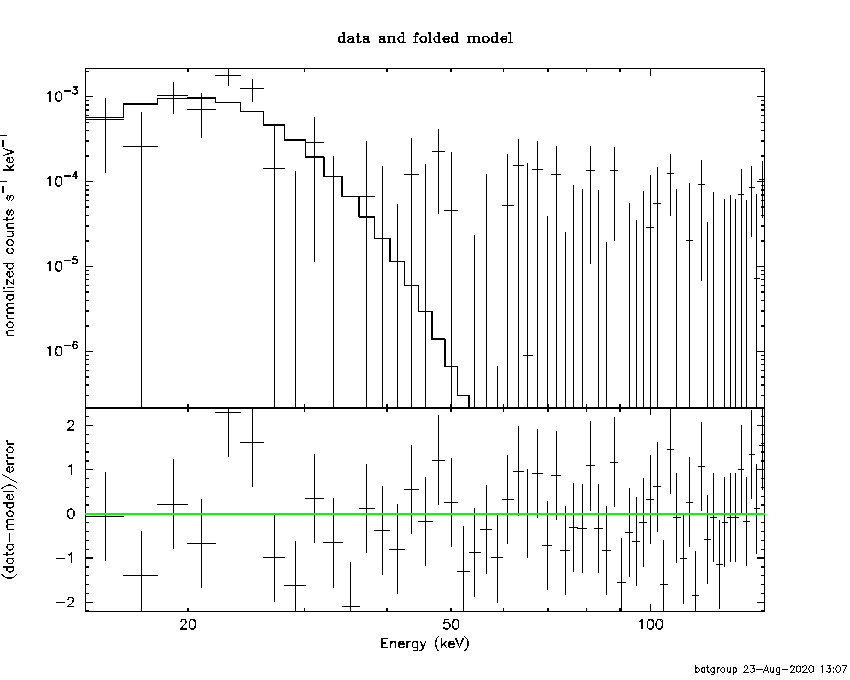
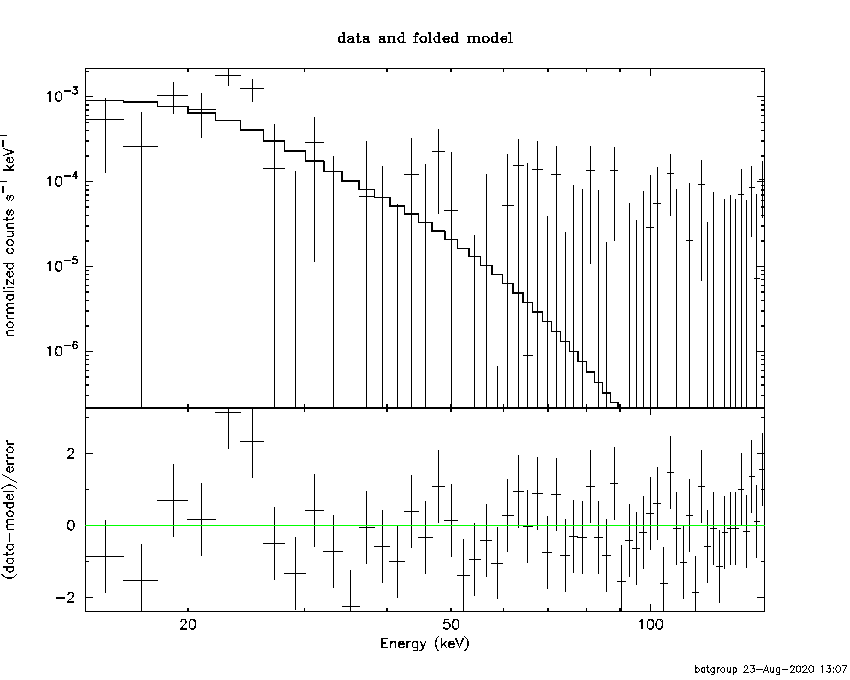
Pre-slew spectrum (Pre-slew PHA with pre-slew DRM)
Power-law model

Spectral model in power-law:
------------------------------------------------------------
Parameters  : value       lower 90%   higher 90%
Photon index: 3.35145     ( -0.865843   1.13613 )
Norm@50keV  : 2.80732E-04    ( -0.000278007   0.000293424 )
------------------------------------------------------------
#Fit statistic : Chi-Squared =          64.34 using 59 PHA bins.
# Reduced chi-squared =          1.129 for     57 degrees of freedom
# Null hypothesis probability =   2.352267e-01

Photon flux (15-150 keV)    in 16.38 sec: 0.100782 ( -0.0394713  0.0405547 ) ph/cm2/s
Energy fluence (15-150 keV)             : 6.62286e-08 ( -2.84814e-08  3.65222e-08 ) ergs/cm2
Cutoff power-law model

Spectral model in the cutoff power-law:
------------------------------------------------------------
Parameters  : value       lower 90%   higher 90%
Photon index: -9.99898     ( 9.9997   4.79437 )
Epeak [keV] : 21.3283      ( -2.47542 2.46851 )
Norm@50keV  : 7.46662E+06    ( -7.51278e+06   4.98858e+07 )
------------------------------------------------------------
#Fit statistic : Chi-Squared =          53.37 using 59 PHA bins.
# Reduced chi-squared =         0.9529 for     56 degrees of freedom
# Null hypothesis probability =   5.752279e-01

Photon flux (15-150 keV)    in 16.38 sec: 0.119636 0.119846 (    ) ph/cm2/s
Energy fluence (15-150 keV)             : 1.724e-17 ( 0  0 ) ergs/cm2
Band function

Spectral model in the Band function:
------------------------------------------------------------
Parameters  : value       lower 90%   higher 90%
alpha       : 5.00000   ( -1.4033   -5 )
beta        : -9.37167    ( 9.37167   5.33909 )
Epeak [keV] : 20.0713      ( -3.17495 3.50581 )
Norm@50keV   : 955.353    ( -302.008   2550.36 )
------------------------------------------------------------
#Fit statistic : Chi-Squared =          56.22 using 59 PHA bins.
# Reduced chi-squared =          1.022 for     55 degrees of freedom
# Null hypothesis probability =   4.289096e-01

Photon flux (15-150 keV)    in 16.38 sec:  (    ) ph/cm2/s
Energy fluence (15-150 keV)             : 0 ( 0  0 ) ergs/cm2
S(25-50 keV) vs. S(50-100 keV) plot

S(25-50 keV)  = 2.11e-08
S(50-100 keV) = 8.01e-09
T90 vs. Hardness ratio plot

T90                                   = 16.3839999437332 sec.
Hardness ratio (energy fluence ratio) = 0.379621
Color vs. Color plot
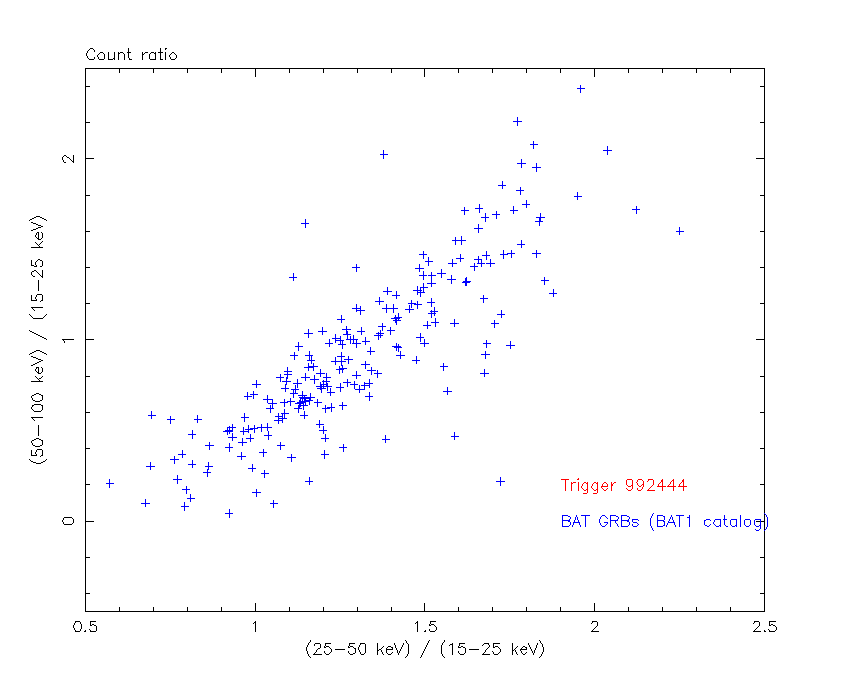
Count Ratio  (25-50 keV) / (15-25 keV) = 0.206888
Count Ratio (50-100 keV) / (15-25 keV) = -0.133032
Mask shadow pattern

IMX = 0, IMY = 0
TIME vs. PHA plot around the trigger time

TIME vs. DetID plot around the trigger time

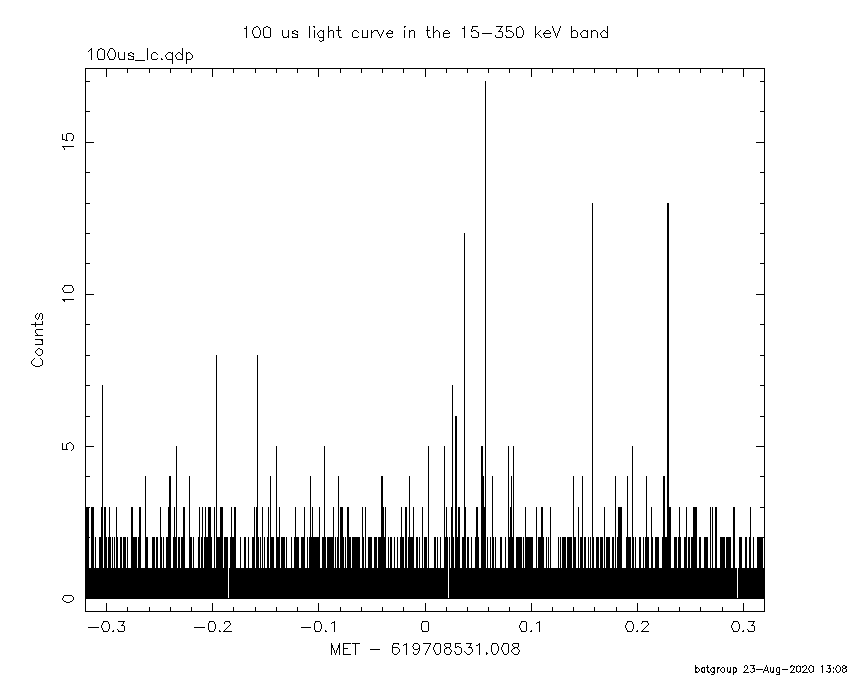
100 us light curve (15-350 keV)
Spacecraft aspect plot

Bright source in the pre-burst/pre-slew/post-slew images
Pre-burst image of 15-350 keV band
Time interval of the image:
-126.507400 -35.008000

# RAcent  DECcent POSerr Theta    Phi  PeakCts   SNR AngSep     Name
#  [deg]    [deg]    ['] [deg]  [deg]                   [']
255.8837 -37.8392    2.5  46.2  -42.5   1.4450   4.7    4.9	4U 1700-377
256.2628 -36.3738    5.4  46.3  -40.4   0.6376   2.1    8.8	GX 349+2
263.0230 -24.9518   52.3  44.6  -22.6   0.0519   0.2   12.4	GX 1+4
264.7428 -44.4483   46.9  38.7  -50.8   0.0623   0.2    0.1	4U 1735-44
268.4408  -1.6009    6.6  53.3    7.2  -0.7851  -1.8    9.9	SW J1753.5-0127
270.3398 -24.9800    4.4  38.5  -18.5   0.4291   2.6    6.7	GX 5-1
270.2875 -25.7032    6.0  38.3  -19.6   0.3143   1.9    2.5	GRS 1758-258
274.0064 -14.0361   91.8  41.1   -1.0   0.0253   0.1    0.0	GX 17+2
275.9460 -30.2001    5.8  32.0  -24.0   0.2855   2.0   10.1	H1820-303
285.1703 -24.9623    5.0  26.4   -7.7  -0.3030  -2.3    7.7	HT1900.1-2455
262.8581 -33.7630  191.5  41.7  -34.8   0.0141   0.1    7.8	GX 354-0
300.7509   6.6978    2.6  42.6   50.4   1.7114   4.5 ------	UNKNOWN
352.0691 -37.8140    2.1  31.0  177.8   0.8132   5.5 ------	UNKNOWN
Pre-slew background subtracted image of 15-350 keV band
Time interval of the image:
0.000000 16.384000

# RAcent  DECcent POSerr Theta    Phi  PeakCts   SNR AngSep     Name
#  [deg]    [deg]    ['] [deg]  [deg]                   [']
255.8435 -37.8888    5.1  46.2  -42.6  -0.2881  -2.3    7.3	4U 1700-377
256.4146 -36.5581    4.2  46.1  -40.6   0.3164   2.7    8.2	GX 349+2
263.0252 -24.5771   62.0  44.7  -22.1  -0.0170  -0.2   10.1	GX 1+4
264.7529 -44.3582    8.8  38.7  -50.7   0.1215   1.3    5.5	4U 1735-44
268.3456  -1.4864    5.9  53.4    7.3   0.3500   1.9    2.4	SW J1753.5-0127
270.3769 -24.9916    5.5  38.5  -18.5  -0.1379  -2.1    7.3	GX 5-1
270.4931 -25.7639    6.4  38.1  -19.6   0.1155   1.8   10.4	GRS 1758-258
274.0621 -14.0199    7.9  41.0   -0.9   0.1158   1.4    3.4	GX 17+2
276.0159 -30.4547    3.7  31.9  -24.4   0.1778   3.2    7.1	H1820-303
284.9834 -24.8085    6.4  26.6   -7.6   0.0893   1.8    7.3	HT1900.1-2455
263.0662 -33.6998    3.7  41.6  -34.6  -0.2643  -3.1    9.0	GX 354-0
  9.0042 -25.3072    2.3  48.2  164.7   0.6371   5.0 ------	UNKNOWN
Post-slew image of 15-350 keV band
Time interval of the image:
130.492600 615.282000
615.992000 963.053600

# RAcent  DECcent POSerr Theta    Phi  PeakCts   SNR AngSep     Name
#  [deg]    [deg]    ['] [deg]  [deg]                   [']
  6.4764  -6.4756    3.0  43.2  143.9   6.6683   3.9  548.9	UNKNOWN
 22.1972 -10.4577    3.0  44.8  167.0   5.5794   3.8 ------	UNKNOWN
 49.3053 -26.1673    3.4  48.3 -151.4   5.1812   3.5 ------	UNKNOWN
 96.0785 -83.6164    3.2  43.5  -64.1   9.8670   3.6 ------	UNKNOWN
Plot creation:
Sun Aug 23 13:08:54 EDT 2020