Special notes of this burst
Image
Pre-slew 15.0-350.0 keV image (Event data)
#   RAcent    DECcent   POSerr    Theta     Phi              Peak Cts       SNR   Name
  251.1393    72.3640   0.0149    22.7217   -33.4050         1.8650209     12.917 TRIG_00993768

Foreground time interval of the image:
-12.099  72.501 (delta_t =  84.600 [sec])
Background time interval of the image:
Lightcurves
Notes:
- 1) The mask-weighted light curves are using the flight position.
- 2) Multiple plots of different time binning/intervals are shown to cover all scenarios of short/long GRBs, rate/image triggers, and real/false positives.
- 3) For all the mask-weighted lightcurves, the y-axis units are counts/sec/det where a det is 0.4 x 0.4 = 0.16 sq cm.
- 4) The verticle lines correspond to following: green dotted lines are T50 interval, black dotted lines are T90 interval, blue solid line(s) is a spacecraft slew start time, and orange solid line(s) is a spacecraft slew end time.
- 5) Time of each bin is in the middle of the bin.
1 s binning
From T0-310 s to T0+310 s
From T100_start - 20 s to T100_end + 30 s

Full time interval
64 ms binning
Full time interval

From T100_start to T100_end
From T0-5 sec to T0+5 sec
16 ms binning
From T100_start-5 s to T100_start+5 s
Blue+Cyan dotted lines: Time interval of the scaled map
From 0.000000 to 64.000000
8 ms binning
From T100_start-3 s to T100_start+3 s
Blue+Cyan dotted lines: Time interval of the scaled map
From 0.000000 to 64.000000
2 ms binning
From T100_start-1 s to T100_start+1 s
Blue+Cyan dotted lines: Time interval of the scaled map
From 0.000000 to 64.000000
SN=5 or 10 sec. binning (whichever binning is satisfied first)
SN=5 or 10 sec. binning (T < 200 sec)
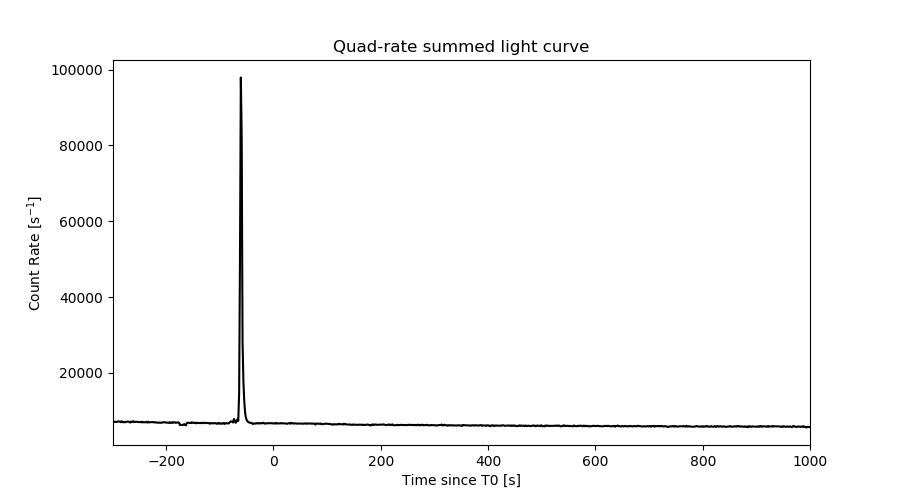
Quad-rate summed light curves (from T0-300s to T0+1000s)
Spectral Evolution

Spectra
Notes:
- 1) The fitting includes the systematic errors.
- 2) When the burst includes telescope slew time periods, the fitting uses an average response file made from multiple 5-s response files through out the slew time plus single time preiod for the non-slew times, and weighted by the total counts in the corresponding time period using addrmf. An average response file is needed becuase a spectral fit using the pre-slew DRM will introduce some errors in both a spectral shape and a normalization if the PHA file contains a lot of the slew/post-slew time interval.
- 3) For fits to more complicated models (e.g. a power-law over a cutoff power-law), the BAT team has decided to require a chi-square improvement of more than 6 for each extra dof.
Time averaged spectrum fit using the average DRM
Power-law model
Time interval is from  -74.768 sec. to  204.076 sec.

Spectral model in power-law:
------------------------------------------------------------
Parameters  : value       lower 90%   higher 90%
Photon index: 1.02508     ( -0.0240847   0.0239666 )
Norm@50keV  : 1.65253E-02    ( -0.000239245   0.000238608 )
------------------------------------------------------------
#Fit statistic  : Chi-Squared                   21.29     using 59 bins.
 Reduced chi-squared = 0.373509
# Null hypothesis probability of 1.00e+00 with 57 degrees of freedom

Photon flux (15-150 keV)    in 278.8 sec: 1.90532 ( -0.02906  0.02913 ) ph/cm2/s
Energy fluence (15-150 keV)             : 4.93905e-05 ( -6.23901e-07  6.236e-07 ) ergs/cm2
Cutoff power-law model
Time interval is from  -74.768 sec. to  204.076 sec.
Spectral model in the cutoff power-law:
------------------------------------------------------------
Parameters  : value       lower 90%   higher 90%
Photon index: 0.919370     ( -0.10226   0.0506214 )
Epeak [keV] : 694.212      ( -303.848 7233.44 )
Norm@50keV  : 1.80739E-02    ( -0.00134685   0.00160187 )
------------------------------------------------------------
#Fit statistic  : Chi-Squared                   18.08     using 59 bins.
 Reduced chi-squared = 0.322857
# Null hypothesis probability of 1.00e+00 with 56 degrees of freedom

Photon flux (15-150 keV)    in 278.8 sec: 0.316846 ( -0.043777  0.032488 ) ph/cm2/s
Energy fluence (15-150 keV)             : 4.93245e-05 ( -6.28518e-07  6.27529e-07 ) ergs/cm2
Band function

Time interval is from  -74.768 sec. to  204.076 sec.


Spectral model in the Band function:
------------------------------------------------------------
Parameters  : value       lower 90%   higher 90%
alpha       :    (     )
beta        :     (     )
Epeak [keV] :       (   )
Norm@50keV   :     (     )
------------------------------------------------------------

Photon flux (15-150 keV)    in  sec:  (    ) ph/cm2/s
Energy fluence (15-150 keV)             : 0 ( 0  0 ) ergs/cm2
Single BB
Spectral model blackbody:
------------------------------------------------------------
Parameters  : value    Lower 90%  Upper 90%
kT [keV]    : 26.1109  (  )
R^2/D10^2   : 3.95722E-02  (   )
(R is the radius in km and D10 is the distance to the source in units of 10 kpc)
------------------------------------------------------------
#Fit statistic  : Chi-Squared                  903.68     using 59 bins.
 Reduced chi-squared =
# Null hypothesis probability of 1.12e-152 with 57 degrees of freedom

Energy  Fluence     90% Error
[keV]   [erg/cm2]   [erg/cm2]
15- 25  1.276e-06   3.541e-08
25- 50  7.399e-06   1.589e-07
50-150  3.713e-05   5.715e-07
15-150  4.580e-05   5.994e-07
Thermal bremsstrahlung (OTTB)

Spectral model: thermal bremsstrahlung
------------------------------------------------------------
Parameters  : value         Lower 90%    Upper 90%
kT [keV]    : 199.363       (      )
Norm        : 8.69962       (     )
------------------------------------------------------------
#Fit statistic  : Chi-Squared                 1685.85     using 59 bins.
 Reduced chi-squared =
# Null hypothesis probability of 4.34e-315 with 57 degrees of freedom

Energy  Fluence     90% Error
[keV]   [erg/cm2]   [erg/cm2]
15- 25  6.040e-06   9.061e-08
25- 50  1.162e-05   1.687e-07
50-150  2.548e-05   3.917e-07
15-150  4.314e-05   6.134e-07
Double BB
Spectral model: bbodyrad<1> + bbodyrad<2>
------------------------------------------------------------
Parameters  : value         Lower 90%    Upper 90%
kT1 [keV]   : 9.72981        (-0.663534      0.704938)
R1^2/D10^2  : 0.473009        (-0.0892799      0.116284)
kT2 [keV]   : 40.1191        (-2.23406      2.73925)
R2^2/D10^2  : 8.97013E-03    (-0.00167732   0.00180973)
------------------------------------------------------------
#Fit statistic  : Chi-Squared                   37.56     using 59 bins.
 Reduced chi-squared =
# Null hypothesis probability of 9.65e-01 with 55 degrees of freedom

Energy  Fluence     90% Error
[keV]   [erg/cm2]   [erg/cm2]
15- 25  3.036e-06   1.756e-07
25- 50  9.556e-06   2.579e-07
50-150  3.685e-05   8.225e-07
15-150  4.944e-05   1.101e-06
Peak spectrum fit
Power-law model
Time interval is from  -60.068 sec. to  -59.068 sec.

Spectral model in power-law:
------------------------------------------------------------
Parameters  : value       lower 90%   higher 90%
Photon index: 0.770524     ( -0.0289792   0.0288229 )
Norm@50keV  : 0.884779    ( -0.0158786   0.0158357 )
------------------------------------------------------------
#Fit statistic  : Chi-Squared                   64.02     using 59 bins.
 Reduced chi-squared = 1.12316
# Null hypothesis probability of 2.44e-01 with 57 degrees of freedom

Photon flux (15-150 keV)    in 1 sec: 3.41045 (    ) ph/cm2/s
Energy fluence (15-150 keV)             : 1.04708e-05 ( -1.75713e-07  1.75777e-07 ) ergs/cm2
Cutoff power-law model

Time interval is from  -60.068 sec. to  -59.068 sec.
Spectral model in the cutoff power-law:
------------------------------------------------------------
Parameters  : value       lower 90%   higher 90%
Photon index: 0.368350     ( -0.129726   0.12634 )
Epeak [keV] : 270.821      ( -49.1883 90.1713 )
Norm@50keV  : 1.25758    ( -0.128667   0.146315 )
------------------------------------------------------------
#Fit statistic  : Chi-Squared                   33.13     using 59 bins.
 Reduced chi-squared = 0.591607
# Null hypothesis probability of 9.94e-01 with 56 degrees of freedom

Photon flux (15-150 keV)    in 1 sec: 100.512 ( -1.7938  1.799 ) ph/cm2/s
Energy fluence (15-150 keV)             : 1.04674e-05 ( -1.77764e-07  1.77951e-07 ) ergs/cm2
Band function

Time interval is from  -60.068 sec. to  -59.068 sec.


Spectral model in the Band function:
------------------------------------------------------------
Parameters  : value       lower 90%   higher 90%
alpha       :    (     )
beta        :     (     )
Epeak [keV] :       (   )
Norm@50keV   :     (     )
------------------------------------------------------------

Photon flux (15-150 keV)    in  sec:  (    ) ph/cm2/s
Energy fluence (15-150 keV)             : 0 ( 0  0 ) ergs/cm2
Single BB

Spectral model blackbody:
------------------------------------------------------------
Parameters  : value    Lower 90%  Upper 90%
kT [keV]    : 28.2542  (  )
R^2/D10^2   : 1.87388  (   )
(R is the radius in km and D10 is the distance to the source in units of 10 kpc)
------------------------------------------------------------
#Fit statistic  : Chi-Squared                  370.52     using 59 bins.
 Reduced chi-squared =
# Null hypothesis probability of 1.65e-47 with 57 degrees of freedom

Energy  Fluence     90% Error
[keV]   [erg/cm2]   [erg/cm2]
15- 25  2.426e-07   7.650e-09
25- 50  1.459e-06   3.700e-08
50-150  8.401e-06   1.710e-07
15-150  1.010e-05   1.790e-07
Thermal bremsstrahlung (OTTB)
Spectral model: thermal bremsstrahlung
------------------------------------------------------------
Parameters  : value         Lower 90%    Upper 90%
kT [keV]    : 199.363       (      )
Norm        : 413.767       (     )
------------------------------------------------------------
#Fit statistic  : Chi-Squared                 2042.23     using 59 bins.
 Reduced chi-squared =
# Null hypothesis probability of 0.00e+00 with 57 degrees of freedom

Energy  Fluence     90% Error
[keV]   [erg/cm2]   [erg/cm2]
15- 25  1.030e-06   1.850e-08
25- 50  1.982e-06   3.750e-08
50-150  4.347e-06   7.850e-08
15-150  7.359e-06   1.425e-07
Double BB
Spectral model: bbodyrad<1> + bbodyrad<2>
------------------------------------------------------------
Parameters  : value         Lower 90%    Upper 90%
kT1 [keV]   : 10.3169        (-1.10832      1.2307)
R1^2/D10^2  : 15.5166        (-3.90051      5.74396)
kT2 [keV]   : 40.5931        (-2.76673      3.70056)
R2^2/D10^2  : 0.563103    (-0.133508   0.140789)
------------------------------------------------------------
#Fit statistic  : Chi-Squared                   32.90     using 59 bins.
 Reduced chi-squared =
# Null hypothesis probability of 9.92e-01 with 55 degrees of freedom

Energy  Fluence     90% Error
[keV]   [erg/cm2]   [erg/cm2]
15- 25  4.582e-07   3.415e-08
25- 50  1.694e-06   9.050e-08
50-150  8.402e-06   2.925e-07
15-150  1.055e-05   3.300e-07
Pre-slew spectrum (Pre-slew PHA with pre-slew DRM)
Power-law model
Spectral model in power-law:
------------------------------------------------------------
Parameters  : value       lower 90%   higher 90%
Photon index: 2.46074     ( -0.236408   0.258517 )
Norm@50keV  : 9.61043E-04    ( -0.000178894   0.000178032 )
------------------------------------------------------------
#Fit statistic  : Chi-Squared                   48.17     using 59 bins.
 Reduced chi-squared =
# Null hypothesis probability of 7.91e-01 with 57 degrees of freedom

Photon flux (15-150 keV)    in 84.6 sec: 0.184345 ( -0.0195596  0.0195619 ) ph/cm2/s
Energy fluence (15-150 keV)             : 8.04731e-07 ( -1.09813e-07  1.14696e-07 ) ergs/cm2
Cutoff power-law model

Spectral model in the cutoff power-law:
------------------------------------------------------------
Parameters  : value       lower 90%   higher 90%
Photon index: 1.92853     (     )
Epeak [keV] : 4.85951      (   )
Norm@50keV  : 2.07585E-03    (     )
------------------------------------------------------------
#Fit statistic  : Chi-Squared                   47.32     using 59 bins.
 Reduced chi-squared =
# Null hypothesis probability of 7.89e-01 with 56 degrees of freedom

Photon flux (15-150 keV)    in 84.6 sec: 0.181334 ( -0.020043  0.020118 ) ph/cm2/s
Energy fluence (15-150 keV)             : 7.63869e-07 ( -1.18853e-07  1.3537e-07 ) ergs/cm2
Band function
Spectral model in the Band function:
------------------------------------------------------------
Parameters  : value       lower 90%   higher 90%
alpha       :    (     )
beta        :     (     )
Epeak [keV] :       (   )
Norm@50keV   :     (     )
------------------------------------------------------------

Photon flux (15-150 keV)    in  sec:  (    ) ph/cm2/s
Energy fluence (15-150 keV)             : 0 ( 0  0 ) ergs/cm2
S(25-50 keV) vs. S(50-100 keV) plot
S(25-50 keV)  = 9.31e-06
S(50-100 keV) = 1.83e-05
T90 vs. Hardness ratio plot
T90                                   = 13.0999999046326 sec.
Hardness ratio (energy fluence ratio) = 1.96563
Color vs. Color plot
Count Ratio  (25-50 keV) / (15-25 keV) = 1.81669
Count Ratio (50-100 keV) / (15-25 keV) = 2.17963
Mask shadow pattern

IMX = 3.495756185963115E-01, IMY = 2.305463279172886E-01
TIME vs. PHA plot around the trigger time

Blue+Cyan dotted lines: Time interval of the scaled map
From 0.000000 to 64.000000
TIME vs. DetID plot around the trigger time
Blue+Cyan dotted lines: Time interval of the scaled map
From 0.000000 to 64.000000
100 us light curve (15-350 keV)

Blue+Cyan dotted lines: Time interval of the scaled map
From 0.000000 to 64.000000
Spacecraft aspect plot

Bright source in the pre-burst/pre-slew/post-slew images
Pre-burst image of 15-350 keV band
Time interval of the image:
Pre-slew background subtracted image of 15-350 keV band
Time interval of the image:
-12.099400 72.500600

# RAcent  DECcent POSerr Theta    Phi  PeakCts   SNR AngSep     Name
#  [deg]    [deg]    ['] [deg]  [deg]                   [']
254.6293  35.2697    4.4  21.0 -150.9   0.3565   2.6    9.5	Her X-1
268.3256  -1.3882    4.9  53.2  169.2  -1.3108  -2.4    4.6	SW J1753.5-0127
288.8475  10.9404    6.8  42.8  140.1  -0.6521  -1.7    2.9	GRS 1915+105
299.6075  35.1847    2.6  25.2  104.0   0.8218   4.5    1.3	Cyg X-1
308.1355  40.9731    3.6  26.3   83.7   0.6096   3.2    1.7	Cyg X-3
326.1318  38.4348   13.8  38.9   72.0  -0.3934  -0.8    7.0	Cyg X-2
251.1394  72.3639    0.9  22.7  -33.4   1.8640  12.9 ------	UNKNOWN
Post-slew image of 15-350 keV band
Time interval of the image:
117.300590 963.094800

# RAcent  DECcent POSerr Theta    Phi  PeakCts   SNR AngSep     Name
#  [deg]    [deg]    ['] [deg]  [deg]                   [']
254.5869  35.3285    7.0  37.1  170.2  -1.9063  -1.6    6.4	Her X-1
301.3835  54.9474    3.1  26.9   97.8   3.8536   3.8 ------	UNKNOWN
251.2052  72.3353    1.7   0.0 -110.7   4.8972   6.9 ------	UNKNOWN
100.8998  69.3454    3.0  37.0  -22.1   3.7645   3.9 ------	UNKNOWN
Plot creation:
Sun Nov 15 21:50:34 EST 2020