Estimated redshift from machine learning (Ukwatta et al. 2016) - may take a few minute to calcaulte
Image
Pre-slew 15.0-350.0 keV image (Event data)
#   RAcent    DECcent   POSerr    Theta     Phi              Peak Cts       SNR   Name
  217.8603   -38.7042   0.0301    24.2814    27.1109         0.8194602      6.370 TRIG_00994165

Foreground time interval of the image:
 32.140 113.701 (delta_t =  81.561 [sec])
Background time interval of the image:
-239.000  32.140 (delta_t = 271.140 [sec])
Lightcurves
Notes:
- 1) The mask-weighted light curves are using the flight position.
- 2) Multiple plots of different time binning/intervals are shown to cover all scenarios of short/long GRBs, rate/image triggers, and real/false positives.
- 3) For all the mask-weighted lightcurves, the y-axis units are counts/sec/det where a det is 0.4 x 0.4 = 0.16 sq cm.
- 4) The verticle lines correspond to following: green dotted lines are T50 interval, black dotted lines are T90 interval, blue solid line(s) is a spacecraft slew start time, and orange solid line(s) is a spacecraft slew end time.
- 5) Time of each bin is in the middle of the bin.
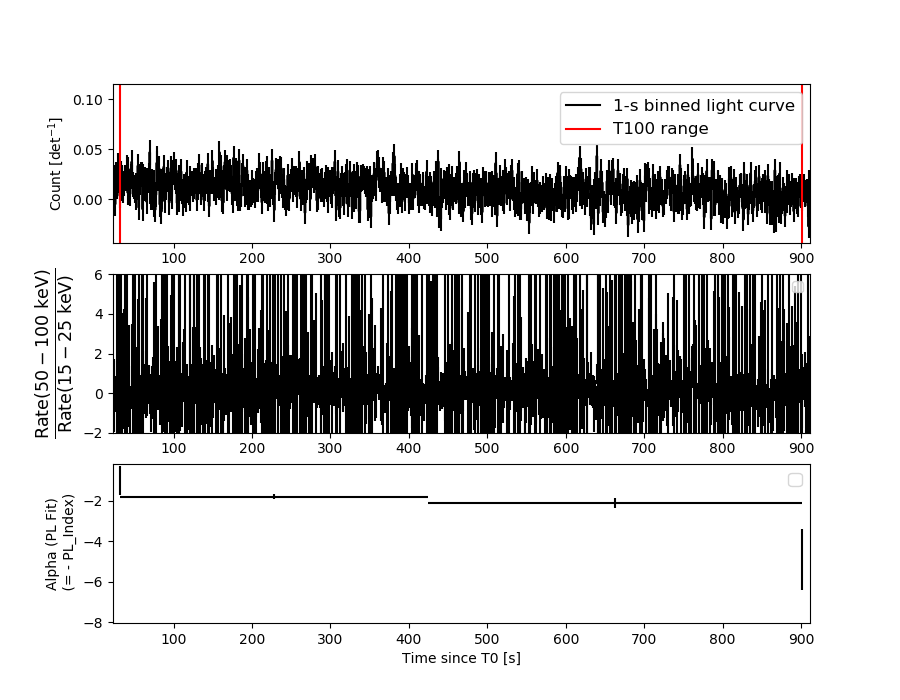
1 s binning
From T0-310 s to T0+310 s
From T100_start - 20 s to T100_end + 30 s

Full time interval

64 ms binning
Full time interval

From T100_start to T100_end
From T0-5 sec to T0+5 sec

16 ms binning
From T100_start-5 s to T100_start+5 s
8 ms binning
From T100_start-3 s to T100_start+3 s
2 ms binning
From T100_start-1 s to T100_start+1 s
SN=5 or 10 sec. binning (whichever binning is satisfied first)
SN=5 or 10 sec. binning (T < 200 sec)
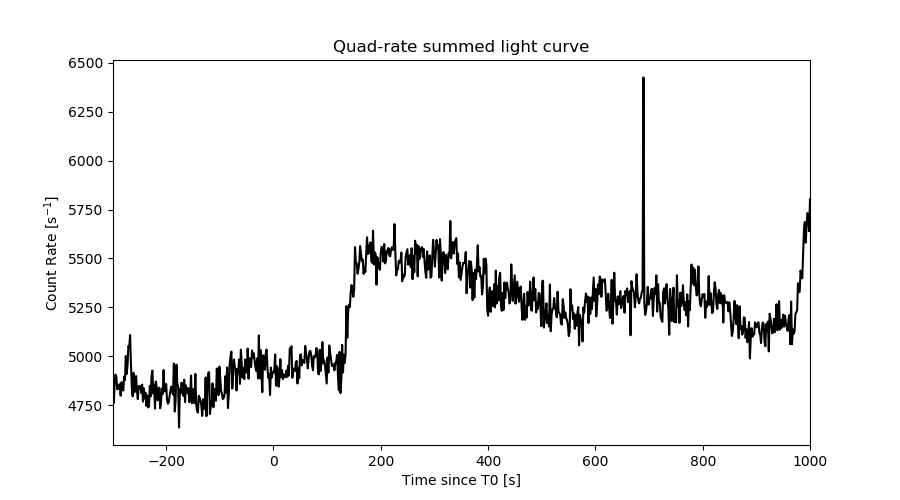
Quad-rate summed light curves (from T0-300s to T0+1000s)
Spectral Evolution
Spectra
Notes:
- 1) The fitting includes the systematic errors.
- 2) When the burst includes telescope slew time periods, the fitting uses an average response file made from multiple 5-s response files through out the slew time plus single time preiod for the non-slew times, and weighted by the total counts in the corresponding time period using addrmf. An average response file is needed becuase a spectral fit using the pre-slew DRM will introduce some errors in both a spectral shape and a normalization if the PHA file contains a lot of the slew/post-slew time interval.
- 3) For fits to more complicated models (e.g. a power-law over a cutoff power-law), the BAT team has decided to require a chi-square improvement of more than 6 for each extra dof.
Time averaged spectrum fit using the average DRM
Power-law model
Time interval is from   32.140 sec. to  901.324 sec.

Spectral model in power-law:
------------------------------------------------------------
Parameters  : value       lower 90%   higher 90%
Photon index: 1.92792     ( -0.122909   0.126029 )
Norm@50keV  : 5.64250E-04    ( -4.40333e-05   4.35507e-05 )
------------------------------------------------------------
#Fit statistic  : Chi-Squared                   71.30     using 59 bins.
 Reduced chi-squared = 1.25088
# Null hypothesis probability of 9.63e-02 with 57 degrees of freedom

Photon flux (15-150 keV)    in 869.2 sec: 8.19579E-02 ( -0.0055905  0.0055984 ) ph/cm2/s
Energy fluence (15-150 keV)             : 4.51159e-06 ( -3.4194e-07  3.45986e-07 ) ergs/cm2
Cutoff power-law model
Time interval is from   32.140 sec. to  901.324 sec.
Spectral model in the cutoff power-law:
------------------------------------------------------------
Parameters  : value       lower 90%   higher 90%
Photon index: 0.928094     ( -0.665728   0.577505 )
Epeak [keV] : 47.2005      ( -6.90131 10.6453 )
Norm@50keV  : 1.99500E-03    ( -0.00101872   0.00258658 )
------------------------------------------------------------
#Fit statistic  : Chi-Squared                   61.74     using 59 bins.
 Reduced chi-squared = 1.1025
# Null hypothesis probability of 2.79e-01 with 56 degrees of freedom

Photon flux (15-150 keV)    in 869.2 sec: 7.78071E-02 ( -0.0060325  0.0060414 ) ph/cm2/s
Energy fluence (15-150 keV)             : 4.11367e-06 ( -3.80313e-07  3.974e-07 ) ergs/cm2
Band function

Time interval is from   32.140 sec. to  901.324 sec.


Spectral model in the Band function:
------------------------------------------------------------
Parameters  : value       lower 90%   higher 90%
alpha       :    (     )
beta        :     (     )
Epeak [keV] :       (   )
Norm@50keV   :     (     )
------------------------------------------------------------

Photon flux (15-150 keV)    in  sec:  (    ) ph/cm2/s
Energy fluence (15-150 keV)             : 0 ( 0  0 ) ergs/cm2
Single BB

Spectral model blackbody:
------------------------------------------------------------
Parameters  : value    Lower 90%  Upper 90%
kT [keV]    : 11.3256  (-0.819081  0.886046)
R^2/D10^2   : 2.37008E-02  (-0.00593782   0.00788146)
(R is the radius in km and D10 is the distance to the source in units of 10 kpc)
------------------------------------------------------------
#Fit statistic  : Chi-Squared                   87.60     using 59 bins.
 Reduced chi-squared =
# Null hypothesis probability of 5.69e-03 with 57 degrees of freedom

Energy  Fluence     90% Error
[keV]   [erg/cm2]   [erg/cm2]
15- 25  5.550e-07   6.780e-08
25- 50  1.628e-06   1.321e-07
50-150  1.206e-06   1.956e-07
15-150  3.390e-06   2.942e-07
Thermal bremsstrahlung (OTTB)

Spectral model: thermal bremsstrahlung
------------------------------------------------------------
Parameters  : value         Lower 90%    Upper 90%
kT [keV]    : 76.0895       (-14.5909      20.7493)
Norm        : 0.389639       (-0.0403301     0.0459557)
------------------------------------------------------------
#Fit statistic  : Chi-Squared                   62.90     using 59 bins.
 Reduced chi-squared =
# Null hypothesis probability of 2.75e-01 with 57 degrees of freedom

Energy  Fluence     90% Error
[keV]   [erg/cm2]   [erg/cm2]
15- 25  8.756e-07   8.292e-08
25- 50  1.424e-06   9.648e-08
50-150  1.942e-06   3.220e-07
15-150  4.241e-06   4.159e-07
Double BB
Spectral model: bbodyrad<1> + bbodyrad<2>
------------------------------------------------------------
Parameters  : value         Lower 90%    Upper 90%
kT1 [keV]   : 3.89751        (-1.16693      1.87101)
R1^2/D10^2  : 0.753540        (-0.599763      2.314)
kT2 [keV]   : 13.9442        (-1.60586      2.66959)
R2^2/D10^2  : 9.45325E-03    (-0.00517824   0.00642128)
------------------------------------------------------------
#Fit statistic  : Chi-Squared                   61.00     using 59 bins.
 Reduced chi-squared =
# Null hypothesis probability of 2.69e-01 with 55 degrees of freedom

Energy  Fluence     90% Error
[keV]   [erg/cm2]   [erg/cm2]
15- 25  8.622e-07   3.413e-07
25- 50  1.426e-06   2.794e-07
50-150  1.600e-06   3.546e-07
15-150  3.888e-06   7.875e-07
Peak spectrum fit
Power-law model

Time interval is from   68.624 sec. to   69.624 sec.

Spectral model in power-law:
------------------------------------------------------------
Parameters  : value       lower 90%   higher 90%
Photon index: 1.99881     ( -2.83472   2.42802 )
Norm@50keV  : 2.63664E-03    ( -0.00259802   0.00165248 )
------------------------------------------------------------
#Fit statistic  : Chi-Squared                   52.47     using 59 bins.
 Reduced chi-squared = 0.920526
# Null hypothesis probability of 6.45e-01 with 57 degrees of freedom

Photon flux (15-150 keV)    in 1 sec: 0.395295 ( -0.162387  0.162296 ) ph/cm2/s
Energy fluence (15-150 keV)             : 2.31244e-08 ( -1.50743e-08  2.04218e-08 ) ergs/cm2
Cutoff power-law model
Time interval is from   68.624 sec. to   69.624 sec.
Spectral model in the cutoff power-law:
------------------------------------------------------------
Parameters  : value       lower 90%   higher 90%
Photon index: 5.03486     ( -2.16373   1.18886 )
Epeak [keV] : 590.743      ( -60.835 81.9559 )
Norm@50keV  : 9.99235E-05    ( -0.000159116   0.00111829 )
------------------------------------------------------------
#Fit statistic  : Chi-Squared                   46.83     using 59 bins.
 Reduced chi-squared = 0.83625
# Null hypothesis probability of 8.04e-01 with 56 degrees of freedom

Photon flux (15-150 keV)    in 1 sec: 0.198798 ( -0.135855  0.16968 ) ph/cm2/s
Energy fluence (15-150 keV)             : 1.68372e-08 ( -1.68368e-08  1.09971e-08 ) ergs/cm2
Band function

Time interval is from   68.624 sec. to   69.624 sec.


Spectral model in the Band function:
------------------------------------------------------------
Parameters  : value       lower 90%   higher 90%
alpha       :    (     )
beta        :     (     )
Epeak [keV] :       (   )
Norm@50keV   :     (     )
------------------------------------------------------------

Photon flux (15-150 keV)    in  sec:  (    ) ph/cm2/s
Energy fluence (15-150 keV)             : 0 ( 0  0 ) ergs/cm2
Single BB
Spectral model blackbody:
------------------------------------------------------------
Parameters  : value    Lower 90%  Upper 90%
kT [keV]    : 4.26315  (-1.62268  2.24746)
R^2/D10^2   : 6.27783  (-6.27783   74.4859)
(R is the radius in km and D10 is the distance to the source in units of 10 kpc)
------------------------------------------------------------
#Fit statistic  : Chi-Squared                   53.64     using 59 bins.
 Reduced chi-squared =
# Null hypothesis probability of 6.02e-01 with 57 degrees of freedom

Energy  Fluence     90% Error
[keV]   [erg/cm2]   [erg/cm2]
15- 25  7.710e-09   4.542e-09
25- 50  3.326e-09   2.375e-09
50-150  5.868e-11   7.700e-11
15-150  1.109e-08   7.265e-09
Thermal bremsstrahlung (OTTB)
Spectral model: thermal bremsstrahlung
------------------------------------------------------------
Parameters  : value         Lower 90%    Upper 90%
kT [keV]    : 11.6929       (-6.78997      -11.6929)
Norm        : 8.42540       (-8.4254     49.358)
------------------------------------------------------------
#Fit statistic  : Chi-Squared                   53.89     using 59 bins.
 Reduced chi-squared =
# Null hypothesis probability of 5.93e-01 with 57 degrees of freedom

Energy  Fluence     90% Error
[keV]   [erg/cm2]   [erg/cm2]
15- 25  7.303e-09   4.598e-09
25- 50  3.830e-09   2.545e-09
50-150  3.924e-10   4.289e-10
15-150  1.153e-08   7.000e-09
Double BB
Spectral model: bbodyrad<1> + bbodyrad<2>
------------------------------------------------------------
Parameters  : value         Lower 90%    Upper 90%
kT1 [keV]   : 3.90816        (-1.6218      0.976852)
R1^2/D10^2  : 9.15532        (-7.9202      91.1949)
kT2 [keV]   : 198.117        (-160.596      -198.066)
R2^2/D10^2  : 1.09105E-04    (-5.1596e-05   0.00074277)
------------------------------------------------------------
#Fit statistic  : Chi-Squared                   41.56     using 59 bins.
 Reduced chi-squared =
# Null hypothesis probability of 9.10e-01 with 55 degrees of freedom

Energy  Fluence     90% Error
[keV]   [erg/cm2]   [erg/cm2]
15- 25  7.471e-09   4.653e-09
25- 50  4.135e-09   2.523e-09
50-150  2.877e-08   2.705e-08
15-150  4.038e-08   3.031e-08
Pre-slew spectrum (Pre-slew PHA with pre-slew DRM)
Power-law model

Spectral model in power-law:
------------------------------------------------------------
Parameters  : value       lower 90%   higher 90%
Photon index: 1.52564     ( -0.227369   0.228804 )
Norm@50keV  : 1.01363E-03    ( -0.000147541   0.000146443 )
------------------------------------------------------------
#Fit statistic  : Chi-Squared                   48.92     using 59 bins.
 Reduced chi-squared =
# Null hypothesis probability of 7.68e-01 with 57 degrees of freedom

Photon flux (15-150 keV)    in 81.56 sec: 0.127433 ( -0.0179726  0.0179975 ) ph/cm2/s
Energy fluence (15-150 keV)             : 7.81073e-07 ( -1.22269e-07  1.24316e-07 ) ergs/cm2
Cutoff power-law model

Spectral model in the cutoff power-law:
------------------------------------------------------------
Parameters  : value       lower 90%   higher 90%
Photon index: 1.45371E-02     ( -2.43173   1.26204 )
Epeak [keV] : 56.8483      ( -13.7599 70.7922 )
Norm@50keV  : 7.16550E-03    ( -0.00725181   0.189679 )
------------------------------------------------------------
#Fit statistic  : Chi-Squared                   44.41     using 59 bins.
 Reduced chi-squared =
# Null hypothesis probability of 8.68e-01 with 56 degrees of freedom

Photon flux (15-150 keV)    in 81.56 sec: 0.120928 ( -0.019329  0.018966 ) ph/cm2/s
Energy fluence (15-150 keV)             : 6.66695e-07 ( -1.53247e-07  1.57974e-07 ) ergs/cm2
Band function
Spectral model in the Band function:
------------------------------------------------------------
Parameters  : value       lower 90%   higher 90%
alpha       :    (     )
beta        :     (     )
Epeak [keV] :       (   )
Norm@50keV   :     (     )
------------------------------------------------------------

Photon flux (15-150 keV)    in  sec:  (    ) ph/cm2/s
Energy fluence (15-150 keV)             : 0 ( 0  0 ) ergs/cm2
S(25-50 keV) vs. S(50-100 keV) plot
S(25-50 keV)  = 1.33e-06
S(50-100 keV) = 1.40e-06
T90 vs. Hardness ratio plot
T90                                   = 705.939999938011 sec.
Hardness ratio (energy fluence ratio) = 1.05263
Color vs. Color plot
Count Ratio  (25-50 keV) / (15-25 keV) = 1.15264
Count Ratio (50-100 keV) / (15-25 keV) = 0.582591
Mask shadow pattern
IMX = 4.015590938595142E-01, IMY = -2.055848774308623E-01
TIME vs. PHA plot around the trigger time

TIME vs. DetID plot around the trigger time

100 us light curve (15-350 keV)
Spacecraft aspect plot

Bright source in the pre-burst/pre-slew/post-slew images
Pre-burst image of 15-350 keV band
Time interval of the image:
-239.000000 32.140000

# RAcent  DECcent POSerr Theta    Phi  PeakCts   SNR AngSep     Name
#  [deg]    [deg]    ['] [deg]  [deg]                   [']
135.5101 -40.5642    2.0  36.8 -146.5   2.1506   5.8    1.0	Vela X-1
170.2748 -60.6293    2.9  15.1  163.1   1.0586   4.0    1.3	Cen X-3
186.6673 -62.7867    1.6  13.9  130.9   2.0001   7.2    1.0	GX 301-2
263.3151 -68.0876    2.5  40.8   96.6   4.5047   4.7 ------	UNKNOWN
251.8401 -48.4778    3.9  41.5   65.3   2.7114   3.0 ------	UNKNOWN
246.5523 -26.5735    2.7  50.6   36.8   4.8677   4.3 ------	UNKNOWN
224.7086 -67.5722    2.2  26.5   98.7   1.9817   5.3 ------	UNKNOWN
217.8175 -38.7045    2.1  24.3   27.1   1.5692   5.4 ------	UNKNOWN
101.3755 -53.1271    2.3  50.7 -179.1   3.7770   5.0 ------	UNKNOWN
213.2085  -3.8270    2.3  50.3  -14.8   2.6662   4.9 ------	UNKNOWN
213.2429   2.7220    2.4  56.4  -17.7   4.8888   4.9 ------	UNKNOWN
122.2011 -37.1685    3.0  47.3 -150.8   2.4359   3.9 ------	UNKNOWN
203.9202  -1.6642    3.0  49.4  -27.2   2.1480   3.8 ------	UNKNOWN
Pre-slew background subtracted image of 15-350 keV band
Time interval of the image:
32.140000 113.700610

# RAcent  DECcent POSerr Theta    Phi  PeakCts   SNR AngSep     Name
#  [deg]    [deg]    ['] [deg]  [deg]                   [']
135.4494 -40.6006    3.2  36.8 -146.6   0.6063   3.6    4.5	Vela X-1
170.7257 -60.6863    0.0  15.0  162.3  -0.1762  -1.6   12.6	Cen X-3
186.6064 -62.8130   25.3  13.9  131.0  -0.0533  -0.5    2.9	GX 301-2
232.3020 -32.6677    2.0  37.3   31.6   1.1483   5.7 ------	UNKNOWN
217.8620 -38.7053    1.8  24.3   27.1   0.8019   6.2 ------	UNKNOWN
Post-slew image of 15-350 keV band
Time interval of the image:
158.900590 961.700620

# RAcent  DECcent POSerr Theta    Phi  PeakCts   SNR AngSep     Name
#  [deg]    [deg]    ['] [deg]  [deg]                   [']
170.0687 -60.7219    5.6  36.7 -170.8  -2.8695  -2.1    9.4	Cen X-3
186.6423 -62.7741    3.6  30.5  179.7   3.8795   3.2    0.5	GX 301-2
244.9782 -15.6371    0.2  33.1   25.3  65.1660  50.9    0.2	Sco X-1
255.9878 -37.8681    1.7  29.7   72.4  11.0145   6.9    1.4	4U 1700-377
256.2480 -36.5372   11.9  30.3   69.9  -1.5777  -1.0   11.3	GX 349+2
262.9592 -24.7514   33.6  40.4   55.3  -0.8351  -0.3    2.7	GX 1+4
264.8166 -44.4106    7.5  35.1   86.7   3.6432   1.5    3.9	4U 1735-44
263.1073 -33.8848    9.1  36.4   68.6   2.9243   1.3    6.6	GX 354-0
257.7147 -54.2850    2.5  31.0  105.2   7.7086   4.6 ------	UNKNOWN
251.8794 -50.1385    3.5  26.5   98.5   5.0186   3.3 ------	UNKNOWN
249.6187 -12.2981    2.9  38.6   27.4   6.3633   3.9 ------	UNKNOWN
217.8145 -38.6973    1.7   0.0  -98.2   5.9996   6.6 ------	UNKNOWN
240.4748  14.0346    2.6  56.8   -1.7  17.4729   4.4 ------	UNKNOWN
231.8975   4.6631    2.7  45.3   -8.2   6.9931   4.4 ------	UNKNOWN
229.6716   7.9047    4.3  47.9  -12.3   4.9980   2.7 ------	UNKNOWN
197.0726 -16.3727    3.7  28.8  -73.1   5.0768   3.1 ------	UNKNOWN
222.5980  16.4241    3.9  55.3  -22.6  10.1631   3.0 ------	UNKNOWN
167.6099 -25.7366    3.2  43.9 -116.4  19.3018   3.7 ------	UNKNOWN
Plot creation:
Thu Oct 20 00:52:21 EDT 2022