Estimated redshift from machine learning (Ukwatta et al. 2016) - may take a few minute to calcaulte
Image
Pre-slew 15.0-350.0 keV image (Event data)
#   RAcent    DECcent   POSerr    Theta     Phi              Peak Cts       SNR   Name
  164.3123    50.4873   0.0043    26.7965   -45.3375         4.5626258     45.039 TRIG_00994389

Foreground time interval of the image:
-19.176  10.876 (delta_t =  30.052 [sec])
Background time interval of the image:
-239.000 -19.176 (delta_t = 219.824 [sec])
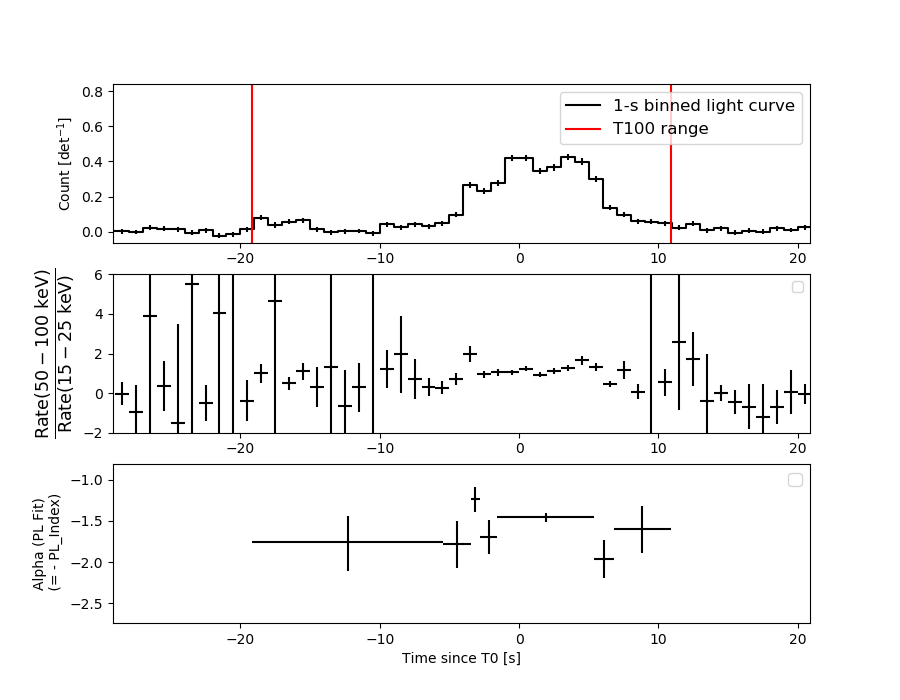
Lightcurves
Notes:
- 1) The mask-weighted light curves are using the flight position.
- 2) Multiple plots of different time binning/intervals are shown to cover all scenarios of short/long GRBs, rate/image triggers, and real/false positives.
- 3) For all the mask-weighted lightcurves, the y-axis units are counts/sec/det where a det is 0.4 x 0.4 = 0.16 sq cm.
- 4) The verticle lines correspond to following: green dotted lines are T50 interval, black dotted lines are T90 interval, blue solid line(s) is a spacecraft slew start time, and orange solid line(s) is a spacecraft slew end time.
- 5) Time of each bin is in the middle of the bin.
1 s binning
From T0-310 s to T0+310 s
From T100_start - 20 s to T100_end + 30 s
Full time interval
64 ms binning
Full time interval
From T100_start to T100_end
From T0-5 sec to T0+5 sec
16 ms binning
From T100_start-5 s to T100_start+5 s
Blue+Cyan dotted lines: Time interval of the scaled map
From 0.000000 to 1.024000
8 ms binning
From T100_start-3 s to T100_start+3 s
Blue+Cyan dotted lines: Time interval of the scaled map
From 0.000000 to 1.024000
2 ms binning
From T100_start-1 s to T100_start+1 s
Blue+Cyan dotted lines: Time interval of the scaled map
From 0.000000 to 1.024000
SN=5 or 10 sec. binning (whichever binning is satisfied first)
SN=5 or 10 sec. binning (T < 200 sec)

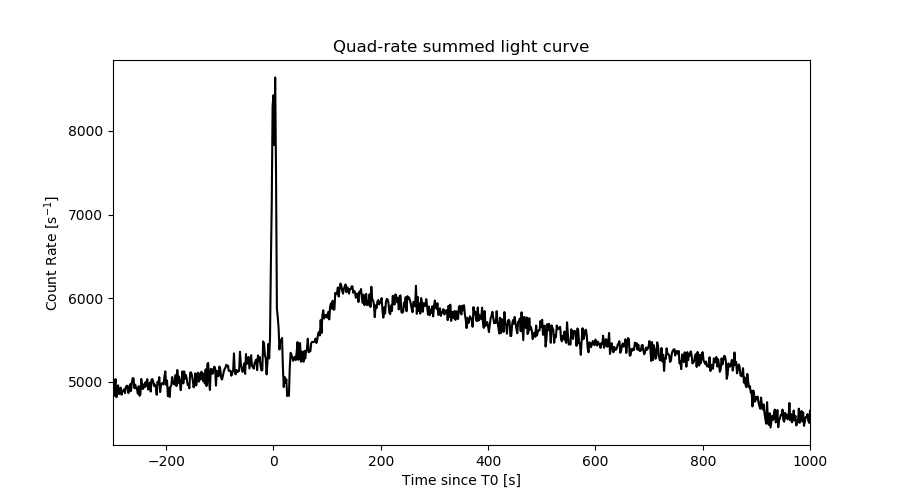
Quad-rate summed light curves (from T0-300s to T0+1000s)
Spectral Evolution
Spectra
Notes:
- 1) The fitting includes the systematic errors.
- 2) When the burst includes telescope slew time periods, the fitting uses an average response file made from multiple 5-s response files through out the slew time plus single time preiod for the non-slew times, and weighted by the total counts in the corresponding time period using addrmf. An average response file is needed becuase a spectral fit using the pre-slew DRM will introduce some errors in both a spectral shape and a normalization if the PHA file contains a lot of the slew/post-slew time interval.
- 3) For fits to more complicated models (e.g. a power-law over a cutoff power-law), the BAT team has decided to require a chi-square improvement of more than 6 for each extra dof.
Time averaged spectrum fit using the average DRM
Power-law model
Time interval is from  -19.176 sec. to   10.876 sec.

Spectral model in power-law:
------------------------------------------------------------
Parameters  : value       lower 90%   higher 90%
Photon index: 1.55040     ( -0.0624645   0.0626394 )
Norm@50keV  : 1.00950E-02    ( -0.000351434   0.000351111 )
------------------------------------------------------------
#Fit statistic  : Chi-Squared                   63.65     using 59 bins.
 Reduced chi-squared = 1.11667
# Null hypothesis probability of 2.54e-01 with 57 degrees of freedom

Photon flux (15-150 keV)    in 30.05 sec: 1.27815 ( -0.04652  0.0466 ) ph/cm2/s
Energy fluence (15-150 keV)             : 2.85604e-06 ( -1.06474e-07  1.06772e-07 ) ergs/cm2
Cutoff power-law model

Time interval is from  -19.176 sec. to   10.876 sec.
Spectral model in the cutoff power-law:
------------------------------------------------------------
Parameters  : value       lower 90%   higher 90%
Photon index: 1.04006     ( -0.271785   0.256043 )
Epeak [keV] : 97.0968      ( -17.3636 45.1216 )
Norm@50keV  : 1.78597E-02    ( -0.00434387   0.0061554 )
------------------------------------------------------------
#Fit statistic  : Chi-Squared                   51.39     using 59 bins.
 Reduced chi-squared = 0.917679
# Null hypothesis probability of 6.50e-01 with 56 degrees of freedom

Photon flux (15-150 keV)    in 30.05 sec: 1.23822 ( -0.05015  0.05025 ) ph/cm2/s
Energy fluence (15-150 keV)             : 2.74843e-06 ( -1.19286e-07  1.19209e-07 ) ergs/cm2
Band function

Time interval is from  -19.176 sec. to   10.876 sec.


Spectral model in the Band function:
------------------------------------------------------------
Parameters  : value       lower 90%   higher 90%
alpha       :    (     )
beta        :     (     )
Epeak [keV] :       (   )
Norm@50keV   :     (     )
------------------------------------------------------------

Photon flux (15-150 keV)    in  sec:  (    ) ph/cm2/s
Energy fluence (15-150 keV)             : 0 ( 0  0 ) ergs/cm2
Single BB
Spectral model blackbody:
------------------------------------------------------------
Parameters  : value    Lower 90%  Upper 90%
kT [keV]    : 15.3499  (  )
R^2/D10^2   : 0.129821  (   )
(R is the radius in km and D10 is the distance to the source in units of 10 kpc)
------------------------------------------------------------
#Fit statistic  : Chi-Squared                  195.07     using 59 bins.
 Reduced chi-squared =
# Null hypothesis probability of 5.32e-17 with 57 degrees of freedom

Energy  Fluence     90% Error
[keV]   [erg/cm2]   [erg/cm2]
15- 25  1.917e-07   1.247e-08
25- 50  7.777e-07   3.576e-08
50-150  1.260e-06   8.519e-08
15-150  2.229e-06   9.316e-08
Thermal bremsstrahlung (OTTB)
Spectral model: thermal bremsstrahlung
------------------------------------------------------------
Parameters  : value         Lower 90%    Upper 90%
kT [keV]    : 200.000       (-31.1647      -200)
Norm        : 5.19189       (-0.177785     0.177785)
------------------------------------------------------------
#Fit statistic  : Chi-Squared                   53.41     using 59 bins.
 Reduced chi-squared =
# Null hypothesis probability of 6.11e-01 with 57 degrees of freedom

Energy  Fluence     90% Error
[keV]   [erg/cm2]   [erg/cm2]
15- 25  3.888e-07   1.442e-08
25- 50  7.479e-07   2.840e-08
50-150  1.640e-06   6.235e-08
15-150  2.777e-06   9.886e-08
Double BB
Spectral model: bbodyrad<1> + bbodyrad<2>
------------------------------------------------------------
Parameters  : value         Lower 90%    Upper 90%
kT1 [keV]   : 6.89682        (-0.865348      0.965303)
R1^2/D10^2  : 1.28560        (-0.45254      0.774895)
kT2 [keV]   : 23.9129        (-2.36442      3.19098)
R2^2/D10^2  : 2.16201E-02    (-0.0082008   0.0107433)
------------------------------------------------------------
#Fit statistic  : Chi-Squared                   48.70     using 59 bins.
 Reduced chi-squared =
# Null hypothesis probability of 7.13e-01 with 55 degrees of freedom

Energy  Fluence     90% Error
[keV]   [erg/cm2]   [erg/cm2]
15- 25  3.567e-07   4.746e-08
25- 50  7.527e-07   6.927e-08
50-150  1.621e-06   1.808e-07
15-150  2.730e-06   2.778e-07
Peak spectrum fit
Power-law model
Time interval is from    0.144 sec. to    1.144 sec.

Spectral model in power-law:
------------------------------------------------------------
Parameters  : value       lower 90%   higher 90%
Photon index: 1.38699     ( -0.115131   0.115986 )
Norm@50keV  : 3.07570E-02    ( -0.00221539   0.00221109 )
------------------------------------------------------------
#Fit statistic  : Chi-Squared                   58.06     using 59 bins.
 Reduced chi-squared = 1.0186
# Null hypothesis probability of 4.36e-01 with 57 degrees of freedom

Photon flux (15-150 keV)    in 1 sec: 3.73478 ( -0.26884  0.269 ) ph/cm2/s
Energy fluence (15-150 keV)             : 2.9803e-07 ( -2.36895e-08  2.38396e-08 ) ergs/cm2
Cutoff power-law model
Time interval is from    0.144 sec. to    1.144 sec.
Spectral model in the cutoff power-law:
------------------------------------------------------------
Parameters  : value       lower 90%   higher 90%
Photon index: 0.638475     ( -0.535187   0.477403 )
Epeak [keV] : 94.6219      ( -20.5581 72.8445 )
Norm@50keV  : 7.19407E-02    ( -0.0295031   0.0577259 )
------------------------------------------------------------
#Fit statistic  : Chi-Squared                   50.46     using 59 bins.
 Reduced chi-squared = 0.901071
# Null hypothesis probability of 6.84e-01 with 56 degrees of freedom

Photon flux (15-150 keV)    in 1 sec: 3.65006 ( -0.27467  0.27458 ) ph/cm2/s
Energy fluence (15-150 keV)             : 2.86952e-07 ( -2.50433e-08  2.51309e-08 ) ergs/cm2
Band function

Time interval is from    0.144 sec. to    1.144 sec.


Spectral model in the Band function:
------------------------------------------------------------
Parameters  : value       lower 90%   higher 90%
alpha       :    (     )
beta        :     (     )
Epeak [keV] :       (   )
Norm@50keV   :     (     )
------------------------------------------------------------

Photon flux (15-150 keV)    in  sec:  (    ) ph/cm2/s
Energy fluence (15-150 keV)             : 0 ( 0  0 ) ergs/cm2
Single BB
Spectral model blackbody:
------------------------------------------------------------
Parameters  : value    Lower 90%  Upper 90%
kT [keV]    : 16.4226  (-1.35946  1.49988)
R^2/D10^2   : 0.330576  (-0.0860554   0.114337)
(R is the radius in km and D10 is the distance to the source in units of 10 kpc)
------------------------------------------------------------
#Fit statistic  : Chi-Squared                   79.86     using 59 bins.
 Reduced chi-squared =
# Null hypothesis probability of 2.45e-02 with 57 degrees of freedom

Energy  Fluence     90% Error
[keV]   [erg/cm2]   [erg/cm2]
15- 25  1.832e-08   2.495e-09
25- 50  7.881e-08   7.485e-09
50-150  1.500e-07   1.960e-08
15-150  2.471e-07   2.110e-08
Thermal bremsstrahlung (OTTB)
Spectral model: thermal bremsstrahlung
------------------------------------------------------------
Parameters  : value         Lower 90%    Upper 90%
kT [keV]    : 200.000       (-25.9316      -200)
Norm        : 15.4617       (-1.09643     1.09643)
------------------------------------------------------------
#Fit statistic  : Chi-Squared                   59.21     using 59 bins.
 Reduced chi-squared =
# Null hypothesis probability of 3.95e-01 with 57 degrees of freedom

Energy  Fluence     90% Error
[keV]   [erg/cm2]   [erg/cm2]
15- 25  3.850e-08   3.185e-09
25- 50  7.405e-08   6.925e-09
50-150  1.624e-07   4.228e-08
15-150  2.750e-07   4.440e-08
Double BB

Spectral model: bbodyrad<1> + bbodyrad<2>
------------------------------------------------------------
Parameters  : value         Lower 90%    Upper 90%
kT1 [keV]   : 6.93117        (-1.96341      2.35535)
R1^2/D10^2  : 3.07171        (-1.78728      6.61933)
kT2 [keV]   : 23.6080        (-3.79311      6.55797)
R2^2/D10^2  : 7.72518E-02    (-0.0473595   0.0917552)
------------------------------------------------------------
#Fit statistic  : Chi-Squared                   49.54     using 59 bins.
 Reduced chi-squared =
# Null hypothesis probability of 6.82e-01 with 55 degrees of freedom

Energy  Fluence     90% Error
[keV]   [erg/cm2]   [erg/cm2]
15- 25  3.117e-08   1.300e-08
25- 50  7.392e-08   2.583e-08
50-150  1.813e-07   6.098e-08
15-150  2.864e-07   8.950e-08
Pre-slew spectrum (Pre-slew PHA with pre-slew DRM)
Power-law model

Spectral model in power-law:
------------------------------------------------------------
Parameters  : value       lower 90%   higher 90%
Photon index: 1.55040     ( -0.0624645   0.0626394 )
Norm@50keV  : 1.00950E-02    ( -0.000351434   0.000351111 )
------------------------------------------------------------
#Fit statistic  : Chi-Squared                   63.65     using 59 bins.
 Reduced chi-squared =
# Null hypothesis probability of 2.54e-01 with 57 degrees of freedom

Photon flux (15-150 keV)    in 30.05 sec: 1.27811 ( -0.0465055  0.0465999 ) ph/cm2/s
Energy fluence (15-150 keV)             : 2.85565e-06 ( -1.06476e-07  1.06776e-07 ) ergs/cm2
Cutoff power-law model

Spectral model in the cutoff power-law:
------------------------------------------------------------
Parameters  : value       lower 90%   higher 90%
Photon index: 1.04006     ( -0.271786   0.256042 )
Epeak [keV] : 97.0969      ( -17.3637 45.1215 )
Norm@50keV  : 1.78597E-02    ( -0.00434384   0.00615543 )
------------------------------------------------------------
#Fit statistic  : Chi-Squared                   51.39     using 59 bins.
 Reduced chi-squared =
# Null hypothesis probability of 6.50e-01 with 56 degrees of freedom

Photon flux (15-150 keV)    in 30.05 sec: 1.23808 ( -0.05014  0.05023 ) ph/cm2/s
Energy fluence (15-150 keV)             : 2.74942e-06 ( -1.19368e-07  1.19295e-07 ) ergs/cm2
Band function

Spectral model in the Band function:
------------------------------------------------------------
Parameters  : value       lower 90%   higher 90%
alpha       :    (     )
beta        :     (     )
Epeak [keV] :       (   )
Norm@50keV   :     (     )
------------------------------------------------------------

Photon flux (15-150 keV)    in  sec:  (    ) ph/cm2/s
Energy fluence (15-150 keV)             : 0 ( 0  0 ) ergs/cm2
S(25-50 keV) vs. S(50-100 keV) plot
S(25-50 keV)  = 7.24e-07
S(50-100 keV) = 9.89e-07
T90 vs. Hardness ratio plot
T90                                   = 22.9119999408722 sec.
Hardness ratio (energy fluence ratio) = 1.36602
Color vs. Color plot
Count Ratio  (25-50 keV) / (15-25 keV) = 1.43749
Count Ratio (50-100 keV) / (15-25 keV) = 1.0978
Mask shadow pattern
IMX = 3.550219012562849E-01, IMY = 3.592294551720819E-01
TIME vs. PHA plot around the trigger time
Blue+Cyan dotted lines: Time interval of the scaled map
From 0.000000 to 1.024000
TIME vs. DetID plot around the trigger time
Blue+Cyan dotted lines: Time interval of the scaled map
From 0.000000 to 1.024000
100 us light curve (15-350 keV)
Blue+Cyan dotted lines: Time interval of the scaled map
From 0.000000 to 1.024000
Spacecraft aspect plot
Bright source in the pre-burst/pre-slew/post-slew images
Pre-burst image of 15-350 keV band
Time interval of the image:
-239.000000 -19.176000

# RAcent  DECcent POSerr Theta    Phi  PeakCts   SNR AngSep     Name
#  [deg]    [deg]    ['] [deg]  [deg]                   [']
254.4502  35.2344    3.6  36.9  135.7   1.7203   3.2    6.5	Her X-1
256.5523  22.4676    3.0  47.8  145.9   4.2275   3.8 ------	UNKNOWN
106.7935  58.6393    2.8  51.0   -6.9   2.1534   4.2 ------	UNKNOWN
107.7589  50.4990    3.3  56.3  -14.7   3.3691   3.5 ------	UNKNOWN
Pre-slew background subtracted image of 15-350 keV band
Time interval of the image:
-19.176000 10.876000

# RAcent  DECcent POSerr Theta    Phi  PeakCts   SNR AngSep     Name
#  [deg]    [deg]    ['] [deg]  [deg]                   [']
254.3048  35.4572    3.9  36.6  135.6   0.4979   2.9   10.2	Her X-1
164.3123  50.4873    0.3  26.8  -45.3   4.5614  45.0 ------	UNKNOWN
162.7418  40.3953    1.9  33.2  -61.2   0.8298   5.9 ------	UNKNOWN
Post-slew image of 15-350 keV band
Time interval of the image:
172.100590 853.200600

# RAcent  DECcent POSerr Theta    Phi  PeakCts   SNR AngSep     Name
#  [deg]    [deg]    ['] [deg]  [deg]                   [']
244.9711 -15.6495    0.8  40.1  -52.5  21.3602  15.0    0.7	Sco X-1
255.7963 -37.8590  137.2  22.0  -85.2   0.0685   0.1    9.1	4U 1700-377
256.4561 -36.4257    8.3  21.7  -81.2   1.0910   1.4    1.0	GX 349+2
263.0142 -24.7482    5.6  21.2  -45.3   1.5068   2.1    0.3	GX 1+4
264.7448 -44.4409  169.3  16.2 -108.2  -0.0480  -0.1    0.6	4U 1735-44
268.2468  -1.4484   10.0  37.9   -9.1   1.0961   1.1    7.3	SW J1753.5-0127
270.3409 -25.0996    2.3  16.2  -31.7   3.1925   5.1    3.3	GX 5-1
270.3105 -25.6903    2.3  15.7  -33.2   3.4733   5.5    3.2	GRS 1758-258
274.0300 -14.0873    6.2  24.1   -6.8   1.3215   1.9    3.4	GX 17+2
275.7977 -30.2938    5.5   9.1  -31.3   1.4229   2.1    7.9	H1820-303
284.8310 -24.8200    0.0  11.9   22.0   0.3707   0.6   12.7	HT1900.1-2455
288.7129  10.8787  446.7  47.8   23.2  -0.0440  -0.0    6.4	GRS 1915+105
262.9524 -33.6927   19.8  17.1  -69.7   0.4328   0.6    8.7	GX 354-0
324.1951 -28.2280    4.1  35.0  104.4   4.3900   2.8 ------	UNKNOWN
 17.6941 -71.3262    3.0  56.8  173.9  15.9924   3.9 ------	UNKNOWN
260.3880  13.8096    3.8  55.0  -11.5   5.4792   3.0 ------	UNKNOWN
255.0836 -41.5595    2.2  22.5  -95.0   4.3416   5.4 ------	UNKNOWN
Plot creation:
Thu Oct 20 00:51:49 EDT 2022