Estimated redshift from machine learning (Ukwatta et al. 2016) - may take a few minute to calcaulte
Image
Pre-slew 15.0-350.0 keV image (Event data)
#   RAcent    DECcent   POSerr    Theta     Phi              Peak Cts       SNR   Name
   89.0187     6.9049   0.0150    23.5826   149.2167         0.2066859     12.798 TRIG_00995004

Foreground time interval of the image:
 -0.640   0.284 (delta_t =   0.924 [sec])
Background time interval of the image:
-239.768  -0.640 (delta_t = 239.128 [sec])
Lightcurves
Notes:
- 1) The mask-weighted light curves are using the flight position.
- 2) Multiple plots of different time binning/intervals are shown to cover all scenarios of short/long GRBs, rate/image triggers, and real/false positives.
- 3) For all the mask-weighted lightcurves, the y-axis units are counts/sec/det where a det is 0.4 x 0.4 = 0.16 sq cm.
- 4) The verticle lines correspond to following: green dotted lines are T50 interval, black dotted lines are T90 interval, blue solid line(s) is a spacecraft slew start time, and orange solid line(s) is a spacecraft slew end time.
- 5) Time of each bin is in the middle of the bin.
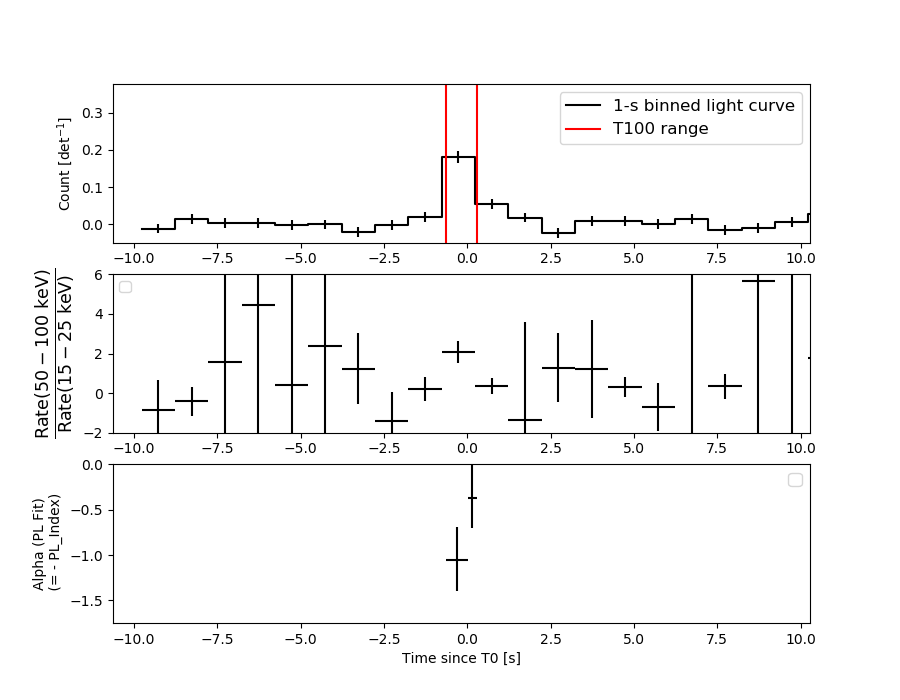
1 s binning
From T0-310 s to T0+310 s

From T100_start - 20 s to T100_end + 30 s
Full time interval

64 ms binning
Full time interval
From T100_start to T100_end

From T0-5 sec to T0+5 sec
16 ms binning
From T100_start-5 s to T100_start+5 s
Blue+Cyan dotted lines: Time interval of the scaled map
From 0.000000 to 0.256000
8 ms binning
From T100_start-3 s to T100_start+3 s
Blue+Cyan dotted lines: Time interval of the scaled map
From 0.000000 to 0.256000
2 ms binning
From T100_start-1 s to T100_start+1 s
Blue+Cyan dotted lines: Time interval of the scaled map
From 0.000000 to 0.256000
SN=5 or 10 sec. binning (whichever binning is satisfied first)
SN=5 or 10 sec. binning (T < 200 sec)
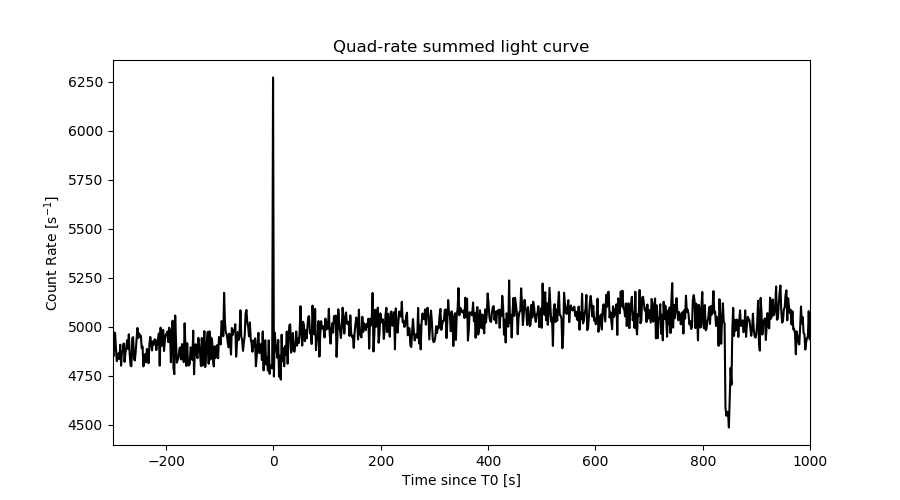
Quad-rate summed light curves (from T0-300s to T0+1000s)
Spectral Evolution
Spectra
Notes:
- 1) The fitting includes the systematic errors.
- 2) When the burst includes telescope slew time periods, the fitting uses an average response file made from multiple 5-s response files through out the slew time plus single time preiod for the non-slew times, and weighted by the total counts in the corresponding time period using addrmf. An average response file is needed becuase a spectral fit using the pre-slew DRM will introduce some errors in both a spectral shape and a normalization if the PHA file contains a lot of the slew/post-slew time interval.
- 3) For fits to more complicated models (e.g. a power-law over a cutoff power-law), the BAT team has decided to require a chi-square improvement of more than 6 for each extra dof.
Time averaged spectrum fit using the average DRM
Power-law model

Time interval is from   -0.640 sec. to    0.284 sec.

Spectral model in power-law:
------------------------------------------------------------
Parameters  : value       lower 90%   higher 90%
Photon index: 0.679718     ( -0.263759   0.244503 )
Norm@50keV  : 1.38031E-02    ( -0.00199794   0.001923 )
------------------------------------------------------------
#Fit statistic  : Chi-Squared                   40.31     using 59 bins.
 Reduced chi-squared = 0.707193
# Null hypothesis probability of 9.54e-01 with 57 degrees of freedom

Photon flux (15-150 keV)    in 0.924 sec: 1.59818 ( -0.21042  0.21135 ) ph/cm2/s
Energy fluence (15-150 keV)             : 1.57142e-07 ( -2.05415e-08  2.05722e-08 ) ergs/cm2
Cutoff power-law model

Time interval is from   -0.640 sec. to    0.284 sec.
Spectral model in the cutoff power-law:
------------------------------------------------------------
Parameters  : value       lower 90%   higher 90%
Photon index: 0.680110     ( -0.274924   0.238497 )
Epeak [keV] : 9999.36      ( -9999.36 -9999.36 )
Norm@50keV  : 1.39431E-02    ( -0.00185433   0.00736631 )
------------------------------------------------------------
#Fit statistic  : Chi-Squared                   40.35     using 59 bins.
 Reduced chi-squared = 0.720536
# Null hypothesis probability of 9.43e-01 with 56 degrees of freedom

Photon flux (15-150 keV)    in 0.924 sec: 1.59768 ( -0.21049  0.21121 ) ph/cm2/s
Energy fluence (15-150 keV)             : 1.57066e-07 ( 0  0 ) ergs/cm2
Band function

Time interval is from   -0.640 sec. to    0.284 sec.


Spectral model in the Band function:
------------------------------------------------------------
Parameters  : value       lower 90%   higher 90%
alpha       :    (     )
beta        :     (     )
Epeak [keV] :       (   )
Norm@50keV   :     (     )
------------------------------------------------------------

Photon flux (15-150 keV)    in  sec:  (    ) ph/cm2/s
Energy fluence (15-150 keV)             : 0 ( 0  0 ) ergs/cm2
Single BB
Spectral model blackbody:
------------------------------------------------------------
Parameters  : value    Lower 90%  Upper 90%
kT [keV]    : 33.1291  (-6.52571  9.80307)
R^2/D10^2   : 1.83569E-02  (-0.00904533   0.0156132)
(R is the radius in km and D10 is the distance to the source in units of 10 kpc)
------------------------------------------------------------
#Fit statistic  : Chi-Squared                   53.24     using 59 bins.
 Reduced chi-squared =
# Null hypothesis probability of 6.17e-01 with 57 degrees of freedom

Energy  Fluence     90% Error
[keV]   [erg/cm2]   [erg/cm2]
15- 25  2.734e-09   7.734e-10
25- 50  1.753e-08   4.366e-09
50-150  1.299e-07   3.038e-08
15-150  1.501e-07   3.799e-08
Thermal bremsstrahlung (OTTB)

Spectral model: thermal bremsstrahlung
------------------------------------------------------------
Parameters  : value         Lower 90%    Upper 90%
kT [keV]    : 200.000       (-23.7992      -200)
Norm        : 6.36239       (-0.875719     0.875719)
------------------------------------------------------------
#Fit statistic  : Chi-Squared                   76.48     using 59 bins.
 Reduced chi-squared =
# Null hypothesis probability of 4.35e-02 with 57 degrees of freedom

Energy  Fluence     90% Error
[keV]   [erg/cm2]   [erg/cm2]
15- 25  1.463e-08   8.395e-09
25- 50  2.815e-08   1.580e-08
50-150  6.173e-08   3.450e-08
15-150  1.045e-07   5.844e-08
Double BB

Spectral model: bbodyrad<1> + bbodyrad<2>
------------------------------------------------------------
Parameters  : value         Lower 90%    Upper 90%
kT1 [keV]   : 6.95984        (-2.9875      5.13494)
R1^2/D10^2  : 1.12503        (-0.943715      9.23637)
kT2 [keV]   : 48.7135        (-14.782      91.4861)
R2^2/D10^2  : 6.25338E-03    (-0.00535116   0.0100051)
------------------------------------------------------------
#Fit statistic  : Chi-Squared                   39.08     using 59 bins.
 Reduced chi-squared =
# Null hypothesis probability of 9.48e-01 with 55 degrees of freedom

Energy  Fluence     90% Error
[keV]   [erg/cm2]   [erg/cm2]
15- 25  9.568e-09   5.555e-09
25- 50  2.186e-08   1.087e-08
50-150  1.324e-07   7.074e-08
15-150  1.639e-07   7.836e-08
Peak spectrum fit
Power-law model

Time interval is from   -0.676 sec. to    0.324 sec.

Spectral model in power-law:
------------------------------------------------------------
Parameters  : value       lower 90%   higher 90%
Photon index: 0.636501     ( -0.263498   0.243258 )
Norm@50keV  : 1.29407E-02    ( -0.0019213   0.00184716 )
------------------------------------------------------------
#Fit statistic  : Chi-Squared                   43.97     using 59 bins.
 Reduced chi-squared = 0.771404
# Null hypothesis probability of 8.97e-01 with 57 degrees of freedom

Photon flux (15-150 keV)    in 1 sec: 1.50460 ( -0.19948  0.2006 ) ph/cm2/s
Energy fluence (15-150 keV)             : 1.6266e-07 ( -2.11165e-08  2.11546e-08 ) ergs/cm2
Cutoff power-law model

Time interval is from   -0.676 sec. to    0.324 sec.
Spectral model in the cutoff power-law:
------------------------------------------------------------
Parameters  : value       lower 90%   higher 90%
Photon index: 0.627300     ( -0.66186   0.333849 )
Epeak [keV] : 9999.35      ( -9999.36 -9999.36 )
Norm@50keV  : 1.30420E-02    ( -0.00177689   0.00958245 )
------------------------------------------------------------
#Fit statistic  : Chi-Squared                   43.99     using 59 bins.
 Reduced chi-squared = 0.785536
# Null hypothesis probability of 8.78e-01 with 56 degrees of freedom

Photon flux (15-150 keV)    in 1 sec: 1.51491 (    ) ph/cm2/s
Energy fluence (15-150 keV)             : 1.62619e-07 ( -2.11146e-08  2.11575e-08 ) ergs/cm2
Band function

Time interval is from   -0.676 sec. to    0.324 sec.


Spectral model in the Band function:
------------------------------------------------------------
Parameters  : value       lower 90%   higher 90%
alpha       :    (     )
beta        :     (     )
Epeak [keV] :       (   )
Norm@50keV   :     (     )
------------------------------------------------------------

Photon flux (15-150 keV)    in  sec:  (    ) ph/cm2/s
Energy fluence (15-150 keV)             : 0 ( 0  0 ) ergs/cm2
Single BB

Spectral model blackbody:
------------------------------------------------------------
Parameters  : value    Lower 90%  Upper 90%
kT [keV]    : 33.4580  (-6.42223  9.59914)
R^2/D10^2   : 1.70937E-02  (-0.00826421   0.0139609)
(R is the radius in km and D10 is the distance to the source in units of 10 kpc)
------------------------------------------------------------
#Fit statistic  : Chi-Squared                   54.02     using 59 bins.
 Reduced chi-squared =
# Null hypothesis probability of 5.88e-01 with 57 degrees of freedom

Energy  Fluence     90% Error
[keV]   [erg/cm2]   [erg/cm2]
15- 25  2.793e-09   8.410e-10
25- 50  1.797e-08   4.670e-09
50-150  1.351e-07   2.918e-08
15-150  1.558e-07   3.495e-08
Thermal bremsstrahlung (OTTB)

Spectral model: thermal bremsstrahlung
------------------------------------------------------------
Parameters  : value         Lower 90%    Upper 90%
kT [keV]    : 200.000       (-22.8378      -200)
Norm        : 5.96926       (-0.835302     0.835302)
------------------------------------------------------------
#Fit statistic  : Chi-Squared                   83.85     using 59 bins.
 Reduced chi-squared =
# Null hypothesis probability of 1.18e-02 with 57 degrees of freedom

Energy  Fluence     90% Error
[keV]   [erg/cm2]   [erg/cm2]
15- 25  1.487e-08   8.420e-09
25- 50  2.860e-08   1.601e-08
50-150  6.272e-08   3.476e-08
15-150  1.062e-07   5.925e-08
Double BB

Spectral model: bbodyrad<1> + bbodyrad<2>
------------------------------------------------------------
Parameters  : value         Lower 90%    Upper 90%
kT1 [keV]   : 6.93013        (-3.12336      5.99702)
R1^2/D10^2  : 0.957319        (-0.838719      9.42294)
kT2 [keV]   : 45.8954        (-12.9379      71.5354)
R2^2/D10^2  : 6.97030E-03    (-0.00543743   0.0100375)
------------------------------------------------------------
#Fit statistic  : Chi-Squared                   43.13     using 59 bins.
 Reduced chi-squared =
# Null hypothesis probability of 8.77e-01 with 55 degrees of freedom

Energy  Fluence     90% Error
[keV]   [erg/cm2]   [erg/cm2]
15- 25  9.020e-09   5.047e-09
25- 50  2.194e-08   1.099e-08
50-150  1.373e-07   7.202e-08
15-150  1.682e-07   7.591e-08
Pre-slew spectrum (Pre-slew PHA with pre-slew DRM)
Power-law model

Spectral model in power-law:
------------------------------------------------------------
Parameters  : value       lower 90%   higher 90%
Photon index: 0.679718     ( -0.263759   0.244503 )
Norm@50keV  : 1.38031E-02    ( -0.00199794   0.001923 )
------------------------------------------------------------
#Fit statistic  : Chi-Squared                   40.31     using 59 bins.
 Reduced chi-squared =
# Null hypothesis probability of 9.54e-01 with 57 degrees of freedom

Photon flux (15-150 keV)    in 0.924 sec: 1.59821 ( -0.210428  0.211346 ) ph/cm2/s
Energy fluence (15-150 keV)             : 1.5712e-07 ( -2.04981e-08  2.05953e-08 ) ergs/cm2
Cutoff power-law model

Spectral model in the cutoff power-law:
------------------------------------------------------------
Parameters  : value       lower 90%   higher 90%
Photon index: 0.668849     ( -0.264363   0.249469 )
Epeak [keV] : 9999.36      ( -9999.36 -9999.36 )
Norm@50keV  : 1.38480E-02    ( -0.00181598   0.00741227 )
------------------------------------------------------------
#Fit statistic  : Chi-Squared                   40.35     using 59 bins.
 Reduced chi-squared =
# Null hypothesis probability of 9.43e-01 with 56 degrees of freedom

Photon flux (15-150 keV)    in 0.924 sec: 1.60332 ( -0.21661  0.20608 ) ph/cm2/s
Energy fluence (15-150 keV)             : 1.57147e-07 ( -2.02541e-08  2.01164e-08 ) ergs/cm2
Band function

Spectral model in the Band function:
------------------------------------------------------------
Parameters  : value       lower 90%   higher 90%
alpha       :    (     )
beta        :     (     )
Epeak [keV] :       (   )
Norm@50keV   :     (     )
------------------------------------------------------------

Photon flux (15-150 keV)    in  sec:  (    ) ph/cm2/s
Energy fluence (15-150 keV)             : 0 ( 0  0 ) ergs/cm2
S(25-50 keV) vs. S(50-100 keV) plot
S(25-50 keV)  = 2.32e-08
S(50-100 keV) = 5.79e-08
T90 vs. Hardness ratio plot
T90                                   = 0.832000017166138 sec.
Hardness ratio (energy fluence ratio) = 2.49569
Color vs. Color plot
Count Ratio  (25-50 keV) / (15-25 keV) = 1.44227
Count Ratio (50-100 keV) / (15-25 keV) = 2.03961
Mask shadow pattern

IMX = -3.750242461204163E-01, IMY = -2.234109063977873E-01
TIME vs. PHA plot around the trigger time

Blue+Cyan dotted lines: Time interval of the scaled map
From 0.000000 to 0.256000
TIME vs. DetID plot around the trigger time

Blue+Cyan dotted lines: Time interval of the scaled map
From 0.000000 to 0.256000
100 us light curve (15-350 keV)
Blue+Cyan dotted lines: Time interval of the scaled map
From 0.000000 to 0.256000
Spacecraft aspect plot

Bright source in the pre-burst/pre-slew/post-slew images
Pre-burst image of 15-350 keV band
Time interval of the image:
-239.768000 -0.640000

# RAcent  DECcent POSerr Theta    Phi  PeakCts   SNR AngSep     Name
#  [deg]    [deg]    ['] [deg]  [deg]                   [']
 83.6246  22.0214    0.5  38.1  162.5  10.0430  22.6    0.6	Crab
135.5163 -40.5616    0.9  40.9  -14.9   5.1852  13.1    0.7	Vela X-1
133.7143 -31.6969    3.3  34.0  -24.5   1.1604   3.5 ------	UNKNOWN
135.1554  -1.6035    3.0  29.0  -83.4   1.6617   3.8 ------	UNKNOWN
145.1719 -25.0569    2.4  40.0  -42.0   2.1697   4.9 ------	UNKNOWN
150.4771 -33.9376    2.4  47.4  -32.2   2.7769   4.7 ------	UNKNOWN
141.4932 -12.4832    3.0  34.2  -61.5   1.6880   3.9 ------	UNKNOWN
Pre-slew background subtracted image of 15-350 keV band
Time interval of the image:
-0.640000 0.284000

# RAcent  DECcent POSerr Theta    Phi  PeakCts   SNR AngSep     Name
#  [deg]    [deg]    ['] [deg]  [deg]                   [']
 83.4922  22.0262    6.3  38.2  162.3   0.0395   1.8    7.9	Crab
135.4960 -40.6077    5.4  40.9  -14.8   0.0427   2.2    3.5	Vela X-1
 89.0187   6.9049    0.9  23.6  149.2   0.2067  12.8 ------	UNKNOWN
122.4411 -58.5859    1.9  51.4    8.6   0.2353   6.1 ------	UNKNOWN
 88.3929  46.2912    2.4  57.3 -176.3   0.3889   4.8 ------	UNKNOWN
Post-slew image of 15-350 keV band
Time interval of the image:
63.732600 837.132600

# RAcent  DECcent POSerr Theta    Phi  PeakCts   SNR AngSep     Name
#  [deg]    [deg]    ['] [deg]  [deg]                   [']
 83.6281  22.0187    0.3  16.0  166.0  30.8433  44.0    0.4	Crab
Plot creation:
Thu Oct 20 00:50:43 EDT 2022