Estimated redshift from machine learning (Ukwatta et al. 2016) - may take a few minute to calcaulte
Image
Pre-slew 15.0-350.0 keV image (Event data)

#   RAcent    DECcent   POSerr    Theta     Phi              Peak Cts       SNR   Name
  235.7358    -4.6909   0.0171    12.4925   142.7631         0.8429618     11.278 TRIG_00996184

Foreground time interval of the image:
-14.952  10.048 (delta_t =  25.000 [sec])
Background time interval of the image:
-76.851 -14.952 (delta_t =  61.899 [sec])
Lightcurves
Notes:
- 1) The mask-weighted light curves are using the flight position.
- 2) Multiple plots of different time binning/intervals are shown to cover all scenarios of short/long GRBs, rate/image triggers, and real/false positives.
- 3) For all the mask-weighted lightcurves, the y-axis units are counts/sec/det where a det is 0.4 x 0.4 = 0.16 sq cm.
- 4) The verticle lines correspond to following: green dotted lines are T50 interval, black dotted lines are T90 interval, blue solid line(s) is a spacecraft slew start time, and orange solid line(s) is a spacecraft slew end time.
- 5) Time of each bin is in the middle of the bin.
1 s binning
From T0-310 s to T0+310 s
From T100_start - 20 s to T100_end + 30 s

Full time interval
64 ms binning
Full time interval

From T100_start to T100_end
From T0-5 sec to T0+5 sec

16 ms binning
From T100_start-5 s to T100_start+5 s

Blue+Cyan dotted lines: Time interval of the scaled map
From 0.000000 to 4.096000
8 ms binning
From T100_start-3 s to T100_start+3 s
Blue+Cyan dotted lines: Time interval of the scaled map
From 0.000000 to 4.096000
2 ms binning
From T100_start-1 s to T100_start+1 s

Blue+Cyan dotted lines: Time interval of the scaled map
From 0.000000 to 4.096000
SN=5 or 10 sec. binning (whichever binning is satisfied first)
SN=5 or 10 sec. binning (T < 200 sec)
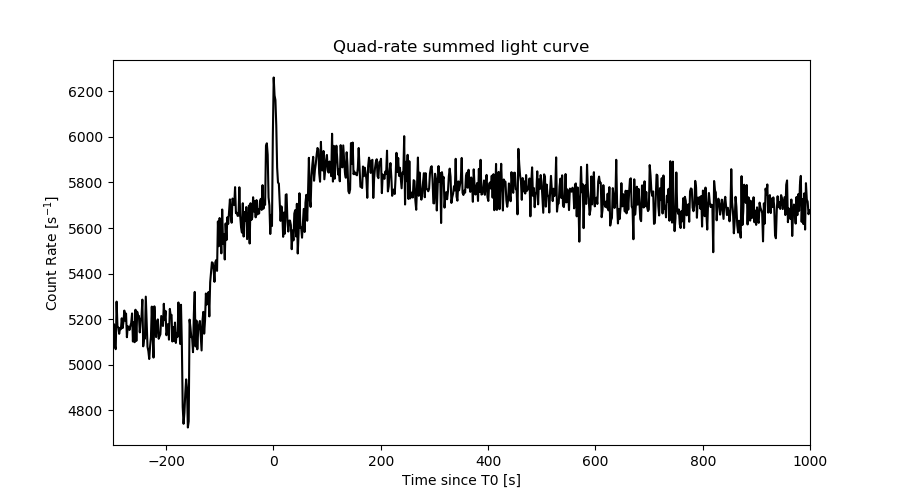
Quad-rate summed light curves (from T0-300s to T0+1000s)
Spectral Evolution

Spectra
Notes:
- 1) The fitting includes the systematic errors.
- 2) When the burst includes telescope slew time periods, the fitting uses an average response file made from multiple 5-s response files through out the slew time plus single time preiod for the non-slew times, and weighted by the total counts in the corresponding time period using addrmf. An average response file is needed becuase a spectral fit using the pre-slew DRM will introduce some errors in both a spectral shape and a normalization if the PHA file contains a lot of the slew/post-slew time interval.
- 3) For fits to more complicated models (e.g. a power-law over a cutoff power-law), the BAT team has decided to require a chi-square improvement of more than 6 for each extra dof.
Time averaged spectrum fit using the average DRM
Power-law model

Time interval is from  -14.952 sec. to   10.048 sec.

Spectral model in power-law:
------------------------------------------------------------
Parameters  : value       lower 90%   higher 90%
Photon index: 2.34029     ( -0.28963   0.319281 )
Norm@50keV  : 1.35040E-03    ( -0.000301326   0.00029765 )
------------------------------------------------------------
#Fit statistic  : Chi-Squared                   36.52     using 59 bins.
 Reduced chi-squared = 0.640702
# Null hypothesis probability of 9.84e-01 with 57 degrees of freedom

Photon flux (15-150 keV)    in 25 sec: 0.241428 ( -0.033316  0.033318 ) ph/cm2/s
Energy fluence (15-150 keV)             : 3.252e-07 ( -5.66037e-08  5.95422e-08 ) ergs/cm2
Cutoff power-law model

Time interval is from  -14.952 sec. to   10.048 sec.
Spectral model in the cutoff power-law:
------------------------------------------------------------
Parameters  : value       lower 90%   higher 90%
Photon index: 1.66055     ( -1.98932   0.340553 )
Epeak [keV] : 17.4564      ( -17.0478 21.9505 )
Norm@50keV  : 3.68445E-03    ( -0.00367896   0.0749882 )
------------------------------------------------------------
#Fit statistic  : Chi-Squared                   35.78     using 59 bins.
 Reduced chi-squared = 0.638929
# Null hypothesis probability of 9.84e-01 with 56 degrees of freedom

Photon flux (15-150 keV)    in 25 sec: 0.235410 ( -0.034801  0.034426 ) ph/cm2/s
Energy fluence (15-150 keV)             : 2.97695e-07 ( -6.4075e-08  7.27383e-08 ) ergs/cm2
Band function

Time interval is from  -14.952 sec. to   10.048 sec.


Spectral model in the Band function:
------------------------------------------------------------
Parameters  : value       lower 90%   higher 90%
alpha       :    (     )
beta        :     (     )
Epeak [keV] :       (   )
Norm@50keV   :     (     )
------------------------------------------------------------

Photon flux (15-150 keV)    in  sec:  (    ) ph/cm2/s
Energy fluence (15-150 keV)             : 0 ( 0  0 ) ergs/cm2
Single BB
Spectral model blackbody:
------------------------------------------------------------
Parameters  : value    Lower 90%  Upper 90%
kT [keV]    : 7.38062  (-1.0638  1.25964)
R^2/D10^2   : 0.362190  (-0.173125   0.329949)
(R is the radius in km and D10 is the distance to the source in units of 10 kpc)
------------------------------------------------------------
#Fit statistic  : Chi-Squared                   41.50     using 59 bins.
 Reduced chi-squared =
# Null hypothesis probability of 9.39e-01 with 57 degrees of freedom

Energy  Fluence     90% Error
[keV]   [erg/cm2]   [erg/cm2]
15- 25  8.344e-08   2.316e-08
25- 50  1.264e-07   3.143e-08
50-150  2.526e-08   1.172e-08
15-150  2.351e-07   5.089e-08
Thermal bremsstrahlung (OTTB)

Spectral model: thermal bremsstrahlung
------------------------------------------------------------
Parameters  : value         Lower 90%    Upper 90%
kT [keV]    : 36.3419       (-11.1337      19.3193)
Norm        : 1.65899       (-0.429339     0.626705)
------------------------------------------------------------
#Fit statistic  : Chi-Squared                   35.88     using 59 bins.
 Reduced chi-squared =
# Null hypothesis probability of 9.87e-01 with 57 degrees of freedom

Energy  Fluence     90% Error
[keV]   [erg/cm2]   [erg/cm2]
15- 25  9.198e-08   1.692e-08
25- 50  1.159e-07   2.307e-08
50-150  8.046e-08   3.687e-08
15-150  2.883e-07   6.471e-08
Double BB
Spectral model: bbodyrad<1> + bbodyrad<2>
------------------------------------------------------------
Parameters  : value         Lower 90%    Upper 90%
kT1 [keV]   : 5.79313        (-3.15087      1.68563)
R1^2/D10^2  : 0.812962        (-0.492978      15.5608)
kT2 [keV]   : 20.2159        (-19.9782      -20.2778)
R2^2/D10^2  : 3.32150E-03    (-0.00327385   0.162038)
------------------------------------------------------------
#Fit statistic  : Chi-Squared                   35.47     using 59 bins.
 Reduced chi-squared =
# Null hypothesis probability of 9.81e-01 with 55 degrees of freedom

Energy  Fluence     90% Error
[keV]   [erg/cm2]   [erg/cm2]
15- 25  9.254e-08   4.921e-08
25- 50  1.121e-07   5.705e-08
50-150  1.054e-07   6.810e-08
15-150  3.101e-07   1.590e-07
Peak spectrum fit
Power-law model

Time interval is from    5.048 sec. to    6.048 sec.

Spectral model in power-law:
------------------------------------------------------------
Parameters  : value       lower 90%   higher 90%
Photon index: 1.84888     ( -0.535578   0.560654 )
Norm@50keV  : 4.08014E-03    ( -0.00143951   0.00138061 )
------------------------------------------------------------
#Fit statistic  : Chi-Squared                   67.13     using 59 bins.
 Reduced chi-squared = 1.17772
# Null hypothesis probability of 1.69e-01 with 57 degrees of freedom

Photon flux (15-150 keV)    in 1 sec: 0.573277 ( -0.164661  0.164742 ) ph/cm2/s
Energy fluence (15-150 keV)             : 3.75232e-08 ( -1.26025e-08  1.35073e-08 ) ergs/cm2
Cutoff power-law model
Time interval is from    5.048 sec. to    6.048 sec.
Spectral model in the cutoff power-law:
------------------------------------------------------------
Parameters  : value       lower 90%   higher 90%
Photon index: -9.88469     (     )
Epeak [keV] : 27.6637      (   )
Norm@50keV  : 1.15251E+06    (     )
------------------------------------------------------------
#Fit statistic  : Chi-Squared                   66.13     using 59 bins.
 Reduced chi-squared = 1.18089
# Null hypothesis probability of 1.67e-01 with 56 degrees of freedom

Photon flux (15-150 keV)    in 1 sec: 0.572980 ( -0.23363  0.125046 ) ph/cm2/s
Energy fluence (15-150 keV)             : 2.08128e-08 ( -6.50608e-09  2.29636e-08 ) ergs/cm2
Band function

Time interval is from    5.048 sec. to    6.048 sec.


Spectral model in the Band function:
------------------------------------------------------------
Parameters  : value       lower 90%   higher 90%
alpha       :    (     )
beta        :     (     )
Epeak [keV] :       (   )
Norm@50keV   :     (     )
------------------------------------------------------------

Photon flux (15-150 keV)    in  sec:  (    ) ph/cm2/s
Energy fluence (15-150 keV)             : 0 ( 0  0 ) ergs/cm2
Single BB

Spectral model blackbody:
------------------------------------------------------------
Parameters  : value    Lower 90%  Upper 90%
kT [keV]    : 7.91776  (-1.87922  2.93983)
R^2/D10^2   : 0.681014  (-0.681078   1.35287)
(R is the radius in km and D10 is the distance to the source in units of 10 kpc)
------------------------------------------------------------
#Fit statistic  : Chi-Squared                   66.89     using 59 bins.
 Reduced chi-squared =
# Null hypothesis probability of 1.74e-01 with 57 degrees of freedom

Energy  Fluence     90% Error
[keV]   [erg/cm2]   [erg/cm2]
15- 25  7.660e-09   4.589e-09
25- 50  1.317e-08   7.995e-09
50-150  3.342e-09   2.696e-09
15-150  2.417e-08   1.482e-08
Thermal bremsstrahlung (OTTB)
Spectral model: thermal bremsstrahlung
------------------------------------------------------------
Parameters  : value         Lower 90%    Upper 90%
kT [keV]    : 69.9503       (-41.7059      -69.9428)
Norm        : 2.82461       (-1.07852     2.09008)
------------------------------------------------------------
#Fit statistic  : Chi-Squared                   67.17     using 59 bins.
 Reduced chi-squared =
# Null hypothesis probability of 1.68e-01 with 57 degrees of freedom

Energy  Fluence     90% Error
[keV]   [erg/cm2]   [erg/cm2]
15- 25  7.246e-09   4.064e-09
25- 50  1.153e-08   7.155e-09
50-150  1.480e-08   1.209e-08
15-150  3.357e-08   2.148e-08
Double BB
Spectral model: bbodyrad<1> + bbodyrad<2>
------------------------------------------------------------
Parameters  : value         Lower 90%    Upper 90%
kT1 [keV]   : 7.04430        (-1.57391      2.58719)
R1^2/D10^2  : 1.00284        (-0.631833      2.02851)
kT2 [keV]   : 199.355        (-0.0905633      -199.363)
R2^2/D10^2  : 8.19193E-05    (-5.41987e-05   0.00227054)
------------------------------------------------------------
#Fit statistic  : Chi-Squared                   61.18     using 59 bins.
 Reduced chi-squared =
# Null hypothesis probability of 2.64e-01 with 55 degrees of freedom

Energy  Fluence     90% Error
[keV]   [erg/cm2]   [erg/cm2]
15- 25  8.171e-09   4.836e-09
25- 50  1.193e-08   7.100e-09
50-150  2.429e-08   1.604e-08
15-150  4.439e-08   2.180e-08
Pre-slew spectrum (Pre-slew PHA with pre-slew DRM)
Power-law model
Spectral model in power-law:
------------------------------------------------------------
Parameters  : value       lower 90%   higher 90%
Photon index: 2.34029     ( -0.28963   0.319281 )
Norm@50keV  : 1.35040E-03    ( -0.000301326   0.00029765 )
------------------------------------------------------------
#Fit statistic  : Chi-Squared                   36.52     using 59 bins.
 Reduced chi-squared =
# Null hypothesis probability of 9.84e-01 with 57 degrees of freedom

Photon flux (15-150 keV)    in 25 sec: 0.241400 ( -0.0333125  0.0333137 ) ph/cm2/s
Energy fluence (15-150 keV)             : 3.2513e-07 ( -5.65242e-08  5.95348e-08 ) ergs/cm2
Cutoff power-law model

Spectral model in the cutoff power-law:
------------------------------------------------------------
Parameters  : value       lower 90%   higher 90%
Photon index: 1.69486     ( -2.01867   0.325311 )
Epeak [keV] : 16.9586      ( -16.4453 29.6768 )
Norm@50keV  : 3.47382E-03    ( -0.00363511   0.0752381 )
------------------------------------------------------------
#Fit statistic  : Chi-Squared                   35.79     using 59 bins.
 Reduced chi-squared =
# Null hypothesis probability of 9.84e-01 with 56 degrees of freedom

Photon flux (15-150 keV)    in 25 sec: 0.235334 ( -0.034778  0.035174 ) ph/cm2/s
Energy fluence (15-150 keV)             : 2.97717e-07 ( -6.40632e-08  7.79e-08 ) ergs/cm2
Band function
Spectral model in the Band function:
------------------------------------------------------------
Parameters  : value       lower 90%   higher 90%
alpha       :    (     )
beta        :     (     )
Epeak [keV] :       (   )
Norm@50keV   :     (     )
------------------------------------------------------------

Photon flux (15-150 keV)    in  sec:  (    ) ph/cm2/s
Energy fluence (15-150 keV)             : 0 ( 0  0 ) ergs/cm2
S(25-50 keV) vs. S(50-100 keV) plot
S(25-50 keV)  = 1.06e-07
S(50-100 keV) = 8.35e-08
T90 vs. Hardness ratio plot
T90                                   = 21 sec.
Hardness ratio (energy fluence ratio) = 0.787736
Color vs. Color plot

Count Ratio  (25-50 keV) / (15-25 keV) = 0.863391
Count Ratio (50-100 keV) / (15-25 keV) = 0.336054
Mask shadow pattern
IMX = -1.763911785378280E-01, IMY = -1.340674952411572E-01
TIME vs. PHA plot around the trigger time
Blue+Cyan dotted lines: Time interval of the scaled map
From 0.000000 to 4.096000
TIME vs. DetID plot around the trigger time

Blue+Cyan dotted lines: Time interval of the scaled map
From 0.000000 to 4.096000
100 us light curve (15-350 keV)
Blue+Cyan dotted lines: Time interval of the scaled map
From 0.000000 to 4.096000
Spacecraft aspect plot

Bright source in the pre-burst/pre-slew/post-slew images
Pre-burst image of 15-350 keV band
Time interval of the image:
-76.851410 -14.952000

# RAcent  DECcent POSerr Theta    Phi  PeakCts   SNR AngSep     Name
#  [deg]    [deg]    ['] [deg]  [deg]                   [']
244.9918 -15.6330    0.4  26.6  148.3   4.7004  31.2    0.8	Sco X-1
254.3858  35.2366    6.1  41.0   47.8   0.5848   1.9    7.3	Her X-1
256.1341 -37.8892    6.2  49.8  161.0  -0.8724  -1.9    7.5	4U 1700-377
256.3502 -36.3886    6.0  48.8  159.5   0.8511   1.9    4.6	GX 349+2
263.0224 -24.6925    8.1  45.5  142.2   0.6253   1.4    3.3	GX 1+4
262.8367 -33.7486    0.0  50.7  152.2   2.5414   4.8    9.2	GX 354-0
266.5266  -1.8856    3.5  40.6  108.9   1.6818   3.3 ------	UNKNOWN
227.3369  40.7716    2.2  37.3   13.2   0.9109   5.2 ------	UNKNOWN
202.8535  37.4857    2.9  40.2  -17.3   0.7142   4.0 ------	UNKNOWN
Pre-slew background subtracted image of 15-350 keV band
Time interval of the image:
-14.952000 10.048000

# RAcent  DECcent POSerr Theta    Phi  PeakCts   SNR AngSep     Name
#  [deg]    [deg]    ['] [deg]  [deg]                   [']
244.8276 -15.5318    8.2  26.4  148.4   0.1335   1.4   10.9	Sco X-1
254.6221  35.3562    5.1  41.3   47.9   0.4325   2.3    8.1	Her X-1
256.1282 -37.8684   29.5  49.8  160.9   0.1078   0.4    6.9	4U 1700-377
256.3523 -36.2948    5.8  48.7  159.4  -0.5169  -2.0    8.7	GX 349+2
263.1381 -24.6947    4.9  45.6  142.2  -0.6376  -2.4    7.7	GX 1+4
262.8915 -33.8482    4.7  50.8  152.2   0.9179   2.5    4.9	GX 354-0
235.7358  -4.6909    1.0  12.5  142.8   0.8430  11.3 ------	UNKNOWN
188.9075  23.5250    2.5  41.3  -45.6   0.6671   4.6 ------	UNKNOWN
Post-slew image of 15-350 keV band
Time interval of the image:
83.948600 962.147400

# RAcent  DECcent POSerr Theta    Phi  PeakCts   SNR AngSep     Name
#  [deg]    [deg]    ['] [deg]  [deg]                   [']
244.9918 -15.6406    0.2  14.2  136.2  71.5038  63.9    0.7	Sco X-1
254.4559  35.3443   83.6  43.7   17.4   0.2720   0.1    0.1	Her X-1
255.9755 -37.9650   18.0  38.0  149.0   1.4666   0.6    7.3	4U 1700-377
256.5004 -36.4173    6.8  37.0  146.9   3.5596   1.7    3.2	GX 349+2
262.8481 -24.8399    6.8  32.9  125.7   3.7056   1.7   10.4	GX 1+4
264.5676 -44.6099    7.1  47.2  147.3  -7.7379  -1.6   12.2	4U 1735-44
268.2172  -1.4992    4.0  32.6   80.6   6.1159   2.9    9.5	SW J1753.5-0127
270.1717 -25.0710    9.6  38.8  120.4   4.4841   1.2    6.1	GX 5-1
270.2399 -25.7854    3.7  39.2  121.4  11.6959   3.1    4.2	GRS 1758-258
273.8530 -14.0077   90.9  38.7  101.8  -0.4412  -0.1    9.1	GX 17+2
262.8692 -33.7834    7.3  38.5  137.7   4.3904   1.6    6.7	GX 354-0
242.9397 -49.8830    2.3  45.6  168.7  13.5071   5.0 ------	UNKNOWN
246.0286  51.2740    3.6  56.6    2.9  16.1833   3.2 ------	UNKNOWN
219.4372   6.4017    3.5  19.7  -60.7   4.2208   3.3 ------	UNKNOWN
Plot creation:
Thu Oct 20 00:49:37 EDT 2022