Estimated redshift from machine learning (Ukwatta et al. 2016) - may take a few minute to calcaulte
Image
Pre-slew 15.0-350.0 keV image (Event data)

#   RAcent    DECcent   POSerr    Theta     Phi              Peak Cts       SNR   Name
  296.9544   -55.1986   0.0035    32.9613     1.6447         5.1864200     55.175 TRIG_00997024

Foreground time interval of the image:
 -1.880  10.833 (delta_t =  12.713 [sec])
Background time interval of the image:
-20.167  -1.880 (delta_t =  18.287 [sec])
Lightcurves
Notes:
- 1) The mask-weighted light curves are using the flight position.
- 2) Multiple plots of different time binning/intervals are shown to cover all scenarios of short/long GRBs, rate/image triggers, and real/false positives.
- 3) For all the mask-weighted lightcurves, the y-axis units are counts/sec/det where a det is 0.4 x 0.4 = 0.16 sq cm.
- 4) The verticle lines correspond to following: green dotted lines are T50 interval, black dotted lines are T90 interval, blue solid line(s) is a spacecraft slew start time, and orange solid line(s) is a spacecraft slew end time.
- 5) Time of each bin is in the middle of the bin.
1 s binning
From T0-310 s to T0+310 s

From T100_start - 20 s to T100_end + 30 s

Full time interval

64 ms binning
Full time interval
From T100_start to T100_end

From T0-5 sec to T0+5 sec
16 ms binning
From T100_start-5 s to T100_start+5 s
Blue+Cyan dotted lines: Time interval of the scaled map
From 0.000000 to 0.064000
8 ms binning
From T100_start-3 s to T100_start+3 s

Blue+Cyan dotted lines: Time interval of the scaled map
From 0.000000 to 0.064000
2 ms binning
From T100_start-1 s to T100_start+1 s
Blue+Cyan dotted lines: Time interval of the scaled map
From 0.000000 to 0.064000
SN=5 or 10 sec. binning (whichever binning is satisfied first)
SN=5 or 10 sec. binning (T < 200 sec)
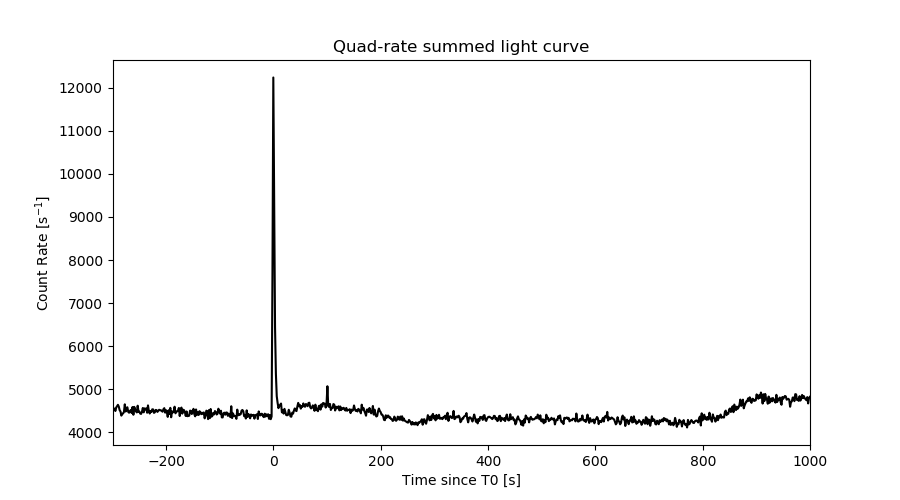
Quad-rate summed light curves (from T0-300s to T0+1000s)
Spectral Evolution

Spectra
Notes:
- 1) The fitting includes the systematic errors.
- 2) When the burst includes telescope slew time periods, the fitting uses an average response file made from multiple 5-s response files through out the slew time plus single time preiod for the non-slew times, and weighted by the total counts in the corresponding time period using addrmf. An average response file is needed becuase a spectral fit using the pre-slew DRM will introduce some errors in both a spectral shape and a normalization if the PHA file contains a lot of the slew/post-slew time interval.
- 3) For fits to more complicated models (e.g. a power-law over a cutoff power-law), the BAT team has decided to require a chi-square improvement of more than 6 for each extra dof.
Time averaged spectrum fit using the average DRM
Power-law model

Time interval is from   -1.880 sec. to   16.224 sec.

Spectral model in power-law:
------------------------------------------------------------
Parameters  : value       lower 90%   higher 90%
Photon index: 2.12451     ( -0.0564127   0.0570624 )
Norm@50keV  : 1.72613E-02    ( -0.000547172   0.000544994 )
------------------------------------------------------------
#Fit statistic  : Chi-Squared                   75.93     using 59 bins.
 Reduced chi-squared = 1.33211
# Null hypothesis probability of 4.76e-02 with 57 degrees of freedom

Photon flux (15-150 keV)    in 18.1 sec: 2.74922 ( -0.08974  0.09016 ) ph/cm2/s
Energy fluence (15-150 keV)             : 2.91064e-06 ( -8.62275e-08  8.63698e-08 ) ergs/cm2
Cutoff power-law model

Time interval is from   -1.880 sec. to   16.224 sec.
Spectral model in the cutoff power-law:
------------------------------------------------------------
Parameters  : value       lower 90%   higher 90%
Photon index: 1.43858     ( -0.267449   0.25202 )
Epeak [keV] : 39.1364      ( -6.90051 4.71449 )
Norm@50keV  : 3.86519E-02    ( -0.00974663   0.0140964 )
------------------------------------------------------------
#Fit statistic  : Chi-Squared                   52.21     using 59 bins.
 Reduced chi-squared = 0.932321
# Null hypothesis probability of 6.19e-01 with 56 degrees of freedom

Photon flux (15-150 keV)    in 18.1 sec: 2.60241 ( -0.10134  0.1021 ) ph/cm2/s
Energy fluence (15-150 keV)             : 2.75384e-06 ( -1.01445e-07  1.01634e-07 ) ergs/cm2
Band function

Time interval is from   -1.880 sec. to   16.224 sec.


Spectral model in the Band function:
------------------------------------------------------------
Parameters  : value       lower 90%   higher 90%
alpha       :    (     )
beta        :     (     )
Epeak [keV] :       (   )
Norm@50keV   :     (     )
------------------------------------------------------------

Photon flux (15-150 keV)    in  sec:  (    ) ph/cm2/s
Energy fluence (15-150 keV)             : 0 ( 0  0 ) ergs/cm2
Single BB

Spectral model blackbody:
------------------------------------------------------------
Parameters  : value    Lower 90%  Upper 90%
kT [keV]    : 11.3063  (  )
R^2/D10^2   : 0.730899  (   )
(R is the radius in km and D10 is the distance to the source in units of 10 kpc)
------------------------------------------------------------
#Fit statistic  : Chi-Squared                  246.23     using 59 bins.
 Reduced chi-squared =
# Null hypothesis probability of 2.32e-25 with 57 degrees of freedom

Energy  Fluence     90% Error
[keV]   [erg/cm2]   [erg/cm2]
15- 25  3.551e-07   1.919e-08
25- 50  1.040e-06   3.349e-08
50-150  7.664e-07   5.330e-08
15-150  2.161e-06   6.788e-08
Thermal bremsstrahlung (OTTB)
Spectral model: thermal bremsstrahlung
------------------------------------------------------------
Parameters  : value         Lower 90%    Upper 90%
kT [keV]    : 64.0181       (-5.11947      5.80562)
Norm        : 13.4615       (-0.727018     0.773834)
------------------------------------------------------------
#Fit statistic  : Chi-Squared                   52.68     using 59 bins.
 Reduced chi-squared =
# Null hypothesis probability of 6.38e-01 with 57 degrees of freedom

Energy  Fluence     90% Error
[keV]   [erg/cm2]   [erg/cm2]
15- 25  6.183e-07   2.724e-08
25- 50  9.595e-07   2.778e-08
50-150  1.151e-06   7.711e-08
15-150  2.729e-06   8.598e-08
Double BB
Spectral model: bbodyrad<1> + bbodyrad<2>
------------------------------------------------------------
Parameters  : value         Lower 90%    Upper 90%
kT1 [keV]   : 6.59254        (-0.730743      0.728177)
R1^2/D10^2  : 4.12534        (-1.24864      2.18349)
kT2 [keV]   : 19.6791        (-2.16007      2.82563)
R2^2/D10^2  : 5.59552E-02    (-0.0247965   0.0384782)
------------------------------------------------------------
#Fit statistic  : Chi-Squared                   59.57     using 59 bins.
 Reduced chi-squared =
# Null hypothesis probability of 3.13e-01 with 55 degrees of freedom

Energy  Fluence     90% Error
[keV]   [erg/cm2]   [erg/cm2]
15- 25  5.639e-07   5.692e-08
25- 50  9.680e-07   7.285e-08
50-150  1.153e-06   1.376e-07
15-150  2.684e-06   2.163e-07
Peak spectrum fit
Power-law model

Time interval is from   -0.460 sec. to    0.540 sec.

Spectral model in power-law:
------------------------------------------------------------
Parameters  : value       lower 90%   higher 90%
Photon index: 1.72946     ( -0.063622   0.0643496 )
Norm@50keV  : 8.45686E-02    ( -0.00330055   0.00329412 )
------------------------------------------------------------
#Fit statistic  : Chi-Squared                   77.38     using 59 bins.
 Reduced chi-squared = 1.35754
# Null hypothesis probability of 3.75e-02 with 57 degrees of freedom

Photon flux (15-150 keV)    in 1 sec: 11.3502 ( -0.4555  0.4564 ) ph/cm2/s
Energy fluence (15-150 keV)             : 7.81448e-07 ( -3.13984e-08  3.14574e-08 ) ergs/cm2
Cutoff power-law model
Time interval is from   -0.460 sec. to    0.540 sec.
Spectral model in the cutoff power-law:
------------------------------------------------------------
Parameters  : value       lower 90%   higher 90%
Photon index: 0.885037     ( -0.303718   0.285529 )
Epeak [keV] : 69.0452      ( -6.72334 10.6835 )
Norm@50keV  : 0.217544    ( -0.0583381   0.086016 )
------------------------------------------------------------
#Fit statistic  : Chi-Squared                   48.98     using 59 bins.
 Reduced chi-squared = 0.874643
# Null hypothesis probability of 7.35e-01 with 56 degrees of freedom

Photon flux (15-150 keV)    in 1 sec: 10.0130 ( -0.62216  0.7288 ) ph/cm2/s
Energy fluence (15-150 keV)             : 7.52991e-07 ( -3.32438e-08  3.32216e-08 ) ergs/cm2
Band function

Time interval is from   -0.460 sec. to    0.540 sec.


Spectral model in the Band function:
------------------------------------------------------------
Parameters  : value       lower 90%   higher 90%
alpha       :    (     )
beta        :     (     )
Epeak [keV] :       (   )
Norm@50keV   :     (     )
------------------------------------------------------------

Photon flux (15-150 keV)    in  sec:  (    ) ph/cm2/s
Energy fluence (15-150 keV)             : 0 ( 0  0 ) ergs/cm2
Single BB

Spectral model blackbody:
------------------------------------------------------------
Parameters  : value    Lower 90%  Upper 90%
kT [keV]    : 14.3154  (  )
R^2/D10^2   : 1.48064  (   )
(R is the radius in km and D10 is the distance to the source in units of 10 kpc)
------------------------------------------------------------
#Fit statistic  : Chi-Squared                  158.05     using 59 bins.
 Reduced chi-squared =
# Null hypothesis probability of 1.95e-11 with 57 degrees of freedom

Energy  Fluence     90% Error
[keV]   [erg/cm2]   [erg/cm2]
15- 25  6.394e-08   4.770e-09
25- 50  2.431e-07   1.110e-08
50-150  3.317e-07   2.430e-08
15-150  6.388e-07   2.620e-08
Thermal bremsstrahlung (OTTB)
Spectral model: thermal bremsstrahlung
------------------------------------------------------------
Parameters  : value         Lower 90%    Upper 90%
kT [keV]    : 131.099       (-18.9442      21.423)
Norm        : 47.5501       (-2.24654     2.60096)
------------------------------------------------------------
#Fit statistic  : Chi-Squared                   54.59     using 59 bins.
 Reduced chi-squared =
# Null hypothesis probability of 5.66e-01 with 57 degrees of freedom

Energy  Fluence     90% Error
[keV]   [erg/cm2]   [erg/cm2]
15- 25  1.208e-07   8.150e-09
25- 50  2.207e-07   1.310e-08
50-150  4.174e-07   1.080e-07
15-150  7.589e-07   1.111e-07
Double BB

Spectral model: bbodyrad<1> + bbodyrad<2>
------------------------------------------------------------
Parameters  : value         Lower 90%    Upper 90%
kT1 [keV]   : 6.51626        (-1.12146      1.25265)
R1^2/D10^2  : 13.6751        (-5.97      13.4815)
kT2 [keV]   : 20.5966        (-2.00448      2.77683)
R2^2/D10^2  : 0.304446    (-0.129102   0.169121)
------------------------------------------------------------
#Fit statistic  : Chi-Squared                   51.71     using 59 bins.
 Reduced chi-squared =
# Null hypothesis probability of 6.01e-01 with 55 degrees of freedom

Energy  Fluence     90% Error
[keV]   [erg/cm2]   [erg/cm2]
15- 25  1.107e-07   1.830e-08
25- 50  2.271e-07   2.425e-08
50-150  4.072e-07   4.940e-08
15-150  7.450e-07   7.130e-08
Pre-slew spectrum (Pre-slew PHA with pre-slew DRM)
Power-law model
Spectral model in power-law:
------------------------------------------------------------
Parameters  : value       lower 90%   higher 90%
Photon index: 2.09193     ( -0.0517878   0.0522901 )
Norm@50keV  : 2.40316E-02    ( -0.000699049   0.000696998 )
------------------------------------------------------------
#Fit statistic  : Chi-Squared                   73.89     using 59 bins.
 Reduced chi-squared =
# Null hypothesis probability of 6.56e-02 with 57 degrees of freedom

Photon flux (15-150 keV)    in 12.71 sec: 3.76581 ( -0.116423  0.116945 ) ph/cm2/s
Energy fluence (15-150 keV)             : 2.8357e-06 ( -7.84203e-08  7.84807e-08 ) ergs/cm2
Cutoff power-law model

Spectral model in the cutoff power-law:
------------------------------------------------------------
Parameters  : value       lower 90%   higher 90%
Photon index: 1.33934     ( -0.248799   0.235671 )
Epeak [keV] : 42.8297      ( -4.89754 3.98023 )
Norm@50keV  : 5.74333E-02    ( -0.0134761   0.0188988 )
------------------------------------------------------------
#Fit statistic  : Chi-Squared                   40.72     using 59 bins.
 Reduced chi-squared =
# Null hypothesis probability of 9.38e-01 with 56 degrees of freedom

Photon flux (15-150 keV)    in 12.71 sec: 3.54465 ( -0.13047  0.13146 ) ph/cm2/s
Energy fluence (15-150 keV)             : 2.6799e-06 ( -9.0724e-08  9.08511e-08 ) ergs/cm2
Band function

Spectral model in the Band function:
------------------------------------------------------------
Parameters  : value       lower 90%   higher 90%
alpha       :    (     )
beta        :     (     )
Epeak [keV] :       (   )
Norm@50keV   :     (     )
------------------------------------------------------------

Photon flux (15-150 keV)    in  sec:  (    ) ph/cm2/s
Energy fluence (15-150 keV)             : 0 ( 0  0 ) ergs/cm2
S(25-50 keV) vs. S(50-100 keV) plot

S(25-50 keV)  = 9.07e-07
S(50-100 keV) = 8.31e-07
T90 vs. Hardness ratio plot
T90                                   = 10.3039999008179 sec.
Hardness ratio (energy fluence ratio) = 0.916207
Color vs. Color plot

Count Ratio  (25-50 keV) / (15-25 keV) = 1.11462
Count Ratio (50-100 keV) / (15-25 keV) = 0.535889
Mask shadow pattern

IMX = 6.481798389224950E-01, IMY = -1.861139071835446E-02
TIME vs. PHA plot around the trigger time

Blue+Cyan dotted lines: Time interval of the scaled map
From 0.000000 to 0.064000
TIME vs. DetID plot around the trigger time
Blue+Cyan dotted lines: Time interval of the scaled map
From 0.000000 to 0.064000
100 us light curve (15-350 keV)

Blue+Cyan dotted lines: Time interval of the scaled map
From 0.000000 to 0.064000
Spacecraft aspect plot
Bright source in the pre-burst/pre-slew/post-slew images
Pre-burst image of 15-350 keV band
Time interval of the image:
-20.167400 -1.880000

# RAcent  DECcent POSerr Theta    Phi  PeakCts   SNR AngSep     Name
#  [deg]    [deg]    ['] [deg]  [deg]                   [']
264.6766 -44.6046    5.8  51.5  -19.2   0.2819   2.0    9.7	4U 1735-44
277.8521 -36.3838    2.2  55.5   -3.9   0.9583   5.2 ------	UNKNOWN
225.8746 -69.2275    2.3  35.8  -59.6   0.4791   5.1 ------	UNKNOWN
Pre-slew background subtracted image of 15-350 keV band
Time interval of the image:
-1.880000 10.832580

# RAcent  DECcent POSerr Theta    Phi  PeakCts   SNR AngSep     Name
#  [deg]    [deg]    ['] [deg]  [deg]                   [']
264.6222 -44.3386    9.8  51.8  -19.1   0.2368   1.2    8.5	4U 1735-44
318.9588 -32.5622    2.8  47.4   38.6   1.1122   4.2 ------	UNKNOWN
296.9544 -55.1986    0.2  33.0    1.6   5.1865  55.2 ------	UNKNOWN
 84.8023 -30.7376    2.2  56.9 -174.0   2.0951   5.1 ------	UNKNOWN
 89.7772 -31.4861    2.2  57.6 -169.0   2.4470   5.1 ------	UNKNOWN
112.8539 -42.3555    2.6  54.0 -143.5   2.0850   4.4 ------	UNKNOWN
Post-slew image of 15-350 keV band
Time interval of the image:
64.832590 261.632590

# RAcent  DECcent POSerr Theta    Phi  PeakCts   SNR AngSep     Name
#  [deg]    [deg]    ['] [deg]  [deg]                   [']
255.9334 -37.7384    7.0  32.5  -52.0   0.5600   1.6    6.8	4U 1700-377
256.3171 -36.3949    6.3  33.3  -49.8  -0.6202  -1.9    6.0	GX 349+2
263.1379 -24.6670   97.4  39.3  -30.1   0.0406   0.1    8.5	GX 1+4
264.9540 -44.3885    8.8  23.0  -52.5   0.3665   1.3    9.8	4U 1735-44
268.3201  -1.3328   19.4  58.7  -11.2  -0.8282  -0.6    7.7	SW J1753.5-0127
270.3670 -25.1871    3.6  35.8  -21.0   0.9194   3.2    7.9	GX 5-1
270.2494 -25.7026    4.1  35.3  -21.5   0.8371   2.9    3.8	GRS 1758-258
273.9382 -14.1882  158.6  44.7   -9.7   0.0268   0.1    9.9	GX 17+2
275.7593 -30.2736    5.0  29.1  -17.0   0.5560   2.3   10.3	H1820-303
284.9321 -24.8599   12.5  31.6    1.8  -0.2419  -0.9    6.7	HT1900.1-2455
262.8363 -33.7392    5.6  31.9  -39.1   0.6155   2.1    9.5	GX 354-0
316.0308 -15.5154    2.4  42.3   50.8   2.9834   4.8 ------	UNKNOWN
288.7594 -51.4056    2.3   6.2  -32.6   1.1577   5.1 ------	UNKNOWN
267.3568  -2.3723    2.8  58.0  -12.7   4.6323   4.1 ------	UNKNOWN
114.6253 -69.9600    2.5  54.8 -158.1   3.8315   4.7 ------	UNKNOWN
258.8109  -7.0088    2.4  56.9  -24.1   5.2890   4.9 ------	UNKNOWN
Plot creation:
Thu Oct 20 00:48:30 EDT 2022