Estimated redshift from machine learning (Ukwatta et al. 2016) - may take a few minute to calcaulte
Image
Pre-slew 15.0-350.0 keV image (Event data)

#   RAcent    DECcent   POSerr    Theta     Phi              Peak Cts       SNR   Name
  246.8977    78.3949   0.0084    29.0599   126.2996         1.5330379     22.990 TRIG_00997453

Foreground time interval of the image:
  0.200  10.381 (delta_t =  10.181 [sec])
Background time interval of the image:
-239.720   0.200 (delta_t = 239.920 [sec])
Lightcurves
Notes:
- 1) The mask-weighted light curves are using the flight position.
- 2) Multiple plots of different time binning/intervals are shown to cover all scenarios of short/long GRBs, rate/image triggers, and real/false positives.
- 3) For all the mask-weighted lightcurves, the y-axis units are counts/sec/det where a det is 0.4 x 0.4 = 0.16 sq cm.
- 4) The verticle lines correspond to following: green dotted lines are T50 interval, black dotted lines are T90 interval, blue solid line(s) is a spacecraft slew start time, and orange solid line(s) is a spacecraft slew end time.
- 5) Time of each bin is in the middle of the bin.
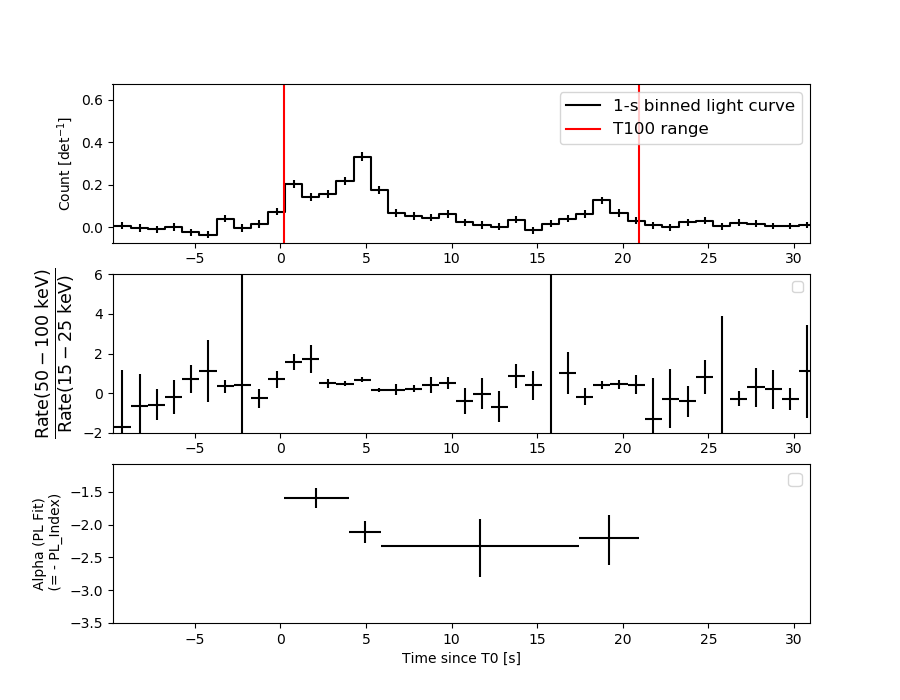
1 s binning
From T0-310 s to T0+310 s

From T100_start - 20 s to T100_end + 30 s
Full time interval
64 ms binning
Full time interval
From T100_start to T100_end
From T0-5 sec to T0+5 sec

16 ms binning
From T100_start-5 s to T100_start+5 s

Blue+Cyan dotted lines: Time interval of the scaled map
From 0.000000 to 1.024000
8 ms binning
From T100_start-3 s to T100_start+3 s
Blue+Cyan dotted lines: Time interval of the scaled map
From 0.000000 to 1.024000
2 ms binning
From T100_start-1 s to T100_start+1 s

Blue+Cyan dotted lines: Time interval of the scaled map
From 0.000000 to 1.024000
SN=5 or 10 sec. binning (whichever binning is satisfied first)

SN=5 or 10 sec. binning (T < 200 sec)

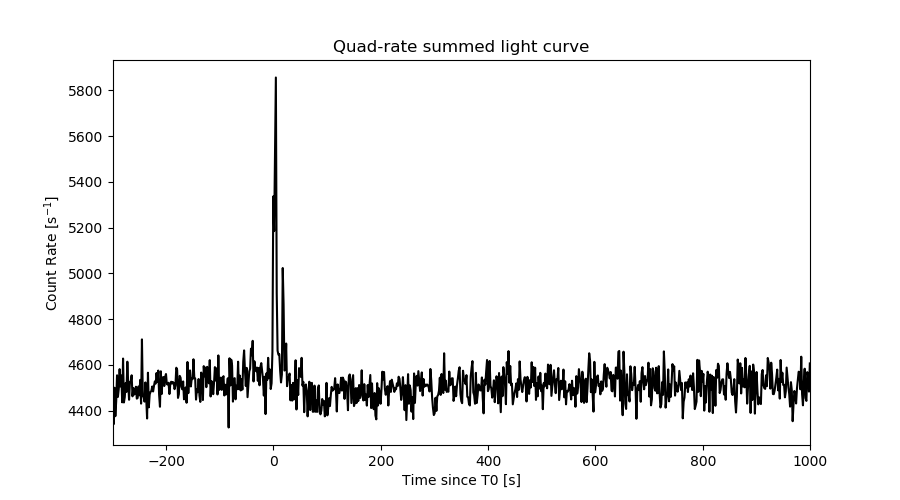
Quad-rate summed light curves (from T0-300s to T0+1000s)
Spectral Evolution
Spectra
Notes:
- 1) The fitting includes the systematic errors.
- 2) When the burst includes telescope slew time periods, the fitting uses an average response file made from multiple 5-s response files through out the slew time plus single time preiod for the non-slew times, and weighted by the total counts in the corresponding time period using addrmf. An average response file is needed becuase a spectral fit using the pre-slew DRM will introduce some errors in both a spectral shape and a normalization if the PHA file contains a lot of the slew/post-slew time interval.
- 3) For fits to more complicated models (e.g. a power-law over a cutoff power-law), the BAT team has decided to require a chi-square improvement of more than 6 for each extra dof.
Time averaged spectrum fit using the average DRM
Power-law model

Time interval is from    0.200 sec. to   20.932 sec.

Spectral model in power-law:
------------------------------------------------------------
Parameters  : value       lower 90%   higher 90%
Photon index: 1.98991     ( -0.135816   0.140577 )
Norm@50keV  : 5.47260E-03    ( -0.000492798   0.000485181 )
------------------------------------------------------------
#Fit statistic  : Chi-Squared                   52.40     using 59 bins.
 Reduced chi-squared = 0.919298
# Null hypothesis probability of 6.48e-01 with 57 degrees of freedom

Photon flux (15-150 keV)    in 20.73 sec: 0.817165 ( -0.059504  0.059539 ) ph/cm2/s
Energy fluence (15-150 keV)             : 1.04585e-06 ( -8.87669e-08  9.00486e-08 ) ergs/cm2
Cutoff power-law model

Time interval is from    0.200 sec. to   20.932 sec.
Spectral model in the cutoff power-law:
------------------------------------------------------------
Parameters  : value       lower 90%   higher 90%
Photon index: 1.46546     ( -0.617606   0.534396 )
Epeak [keV] : 43.0963      ( -31.0091 129.658 )
Norm@50keV  : 1.08968E-02    ( -0.00540433   0.01351 )
------------------------------------------------------------
#Fit statistic  : Chi-Squared                   49.63     using 59 bins.
 Reduced chi-squared = 0.88625
# Null hypothesis probability of 7.13e-01 with 56 degrees of freedom

Photon flux (15-150 keV)    in 20.73 sec: 0.798298 ( -0.062426  0.062455 ) ph/cm2/s
Energy fluence (15-150 keV)             : 0 ( 0  0 ) ergs/cm2
Band function

Time interval is from    0.200 sec. to   20.932 sec.


Spectral model in the Band function:
------------------------------------------------------------
Parameters  : value       lower 90%   higher 90%
alpha       :    (     )
beta        :     (     )
Epeak [keV] :       (   )
Norm@50keV   :     (     )
------------------------------------------------------------

Photon flux (15-150 keV)    in  sec:  (    ) ph/cm2/s
Energy fluence (15-150 keV)             : 0 ( 0  0 ) ergs/cm2
Single BB

Spectral model blackbody:
------------------------------------------------------------
Parameters  : value    Lower 90%  Upper 90%
kT [keV]    : 10.1335  (-0.912181  1.00319)
R^2/D10^2   : 0.353646  (-0.107634   0.155161)
(R is the radius in km and D10 is the distance to the source in units of 10 kpc)
------------------------------------------------------------
#Fit statistic  : Chi-Squared                   88.78     using 59 bins.
 Reduced chi-squared =
# Null hypothesis probability of 4.47e-03 with 57 degrees of freedom

Energy  Fluence     90% Error
[keV]   [erg/cm2]   [erg/cm2]
15- 25  1.540e-07   1.971e-08
25- 50  3.901e-07   3.255e-08
50-150  2.115e-07   4.342e-08
15-150  7.556e-07   6.126e-08
Thermal bremsstrahlung (OTTB)

Spectral model: thermal bremsstrahlung
------------------------------------------------------------
Parameters  : value         Lower 90%    Upper 90%
kT [keV]    : 67.9917       (-14.2152      20.1125)
Norm        : 4.04133       (-0.471723     0.551001)
------------------------------------------------------------
#Fit statistic  : Chi-Squared                   49.79     using 59 bins.
 Reduced chi-squared =
# Null hypothesis probability of 7.40e-01 with 57 degrees of freedom

Energy  Fluence     90% Error
[keV]   [erg/cm2]   [erg/cm2]
15- 25  2.142e-07   2.173e-08
25- 50  3.382e-07   2.446e-08
50-150  4.250e-07   8.126e-08
15-150  9.774e-07   8.541e-08
Double BB

Spectral model: bbodyrad<1> + bbodyrad<2>
------------------------------------------------------------
Parameters  : value         Lower 90%    Upper 90%
kT1 [keV]   : 5.45692        (-1.02125      1.16599)
R1^2/D10^2  : 2.60917        (-1.31373      3.22885)
kT2 [keV]   : 18.1099        (-3.30634      5.30651)
R2^2/D10^2  : 2.78732E-02    (-0.0180017   0.0367028)
------------------------------------------------------------
#Fit statistic  : Chi-Squared                   47.35     using 59 bins.
 Reduced chi-squared =
# Null hypothesis probability of 7.58e-01 with 55 degrees of freedom

Energy  Fluence     90% Error
[keV]   [erg/cm2]   [erg/cm2]
15- 25  2.222e-07   6.870e-08
25- 50  3.244e-07   8.168e-08
50-150  4.285e-07   2.214e-07
15-150  9.751e-07   3.200e-07
Peak spectrum fit
Power-law model
Time interval is from    4.384 sec. to    5.384 sec.

Spectral model in power-law:
------------------------------------------------------------
Parameters  : value       lower 90%   higher 90%
Photon index: 2.01319     ( -0.186908   0.199849 )
Norm@50keV  : 1.95835E-02    ( -0.00267255   0.00260717 )
------------------------------------------------------------
#Fit statistic  : Chi-Squared                   66.05     using 59 bins.
 Reduced chi-squared = 1.15877
# Null hypothesis probability of 1.93e-01 with 57 degrees of freedom

Photon flux (15-150 keV)    in 1 sec: 2.95571 ( -0.31057  0.31059 ) ph/cm2/s
Energy fluence (15-150 keV)             : 1.80759e-07 ( -2.29034e-08  2.33114e-08 ) ergs/cm2
Cutoff power-law model
Time interval is from    4.384 sec. to    5.384 sec.
Spectral model in the cutoff power-law:
------------------------------------------------------------
Parameters  : value       lower 90%   higher 90%
Photon index: 1.38133     ( -0.785325   0.675496 )
Epeak [keV] : 42.7285      ( -40.1301 -42.7358 )
Norm@50keV  : 4.45894E-02    ( -0.0256606   0.0777178 )
------------------------------------------------------------
#Fit statistic  : Chi-Squared                   63.50     using 59 bins.
 Reduced chi-squared = 1.13393
# Null hypothesis probability of 2.29e-01 with 56 degrees of freedom

Photon flux (15-150 keV)    in 1 sec: 2.90743 ( -0.31392  0.31425 ) ph/cm2/s
Energy fluence (15-150 keV)             : 1.73057e-07 ( -2.36366e-08  2.44716e-08 ) ergs/cm2
Band function

Time interval is from    4.384 sec. to    5.384 sec.


Spectral model in the Band function:
------------------------------------------------------------
Parameters  : value       lower 90%   higher 90%
alpha       :    (     )
beta        :     (     )
Epeak [keV] :       (   )
Norm@50keV   :     (     )
------------------------------------------------------------

Photon flux (15-150 keV)    in  sec:  (    ) ph/cm2/s
Energy fluence (15-150 keV)             : 0 ( 0  0 ) ergs/cm2
Single BB

Spectral model blackbody:
------------------------------------------------------------
Parameters  : value    Lower 90%  Upper 90%
kT [keV]    : 10.5936  (-1.46114  1.63755)
R^2/D10^2   : 1.11211  (-0.459778   0.826245)
(R is the radius in km and D10 is the distance to the source in units of 10 kpc)
------------------------------------------------------------
#Fit statistic  : Chi-Squared                   87.73     using 59 bins.
 Reduced chi-squared =
# Null hypothesis probability of 5.54e-03 with 57 degrees of freedom

Energy  Fluence     90% Error
[keV]   [erg/cm2]   [erg/cm2]
15- 25  2.586e-08   4.905e-09
25- 50  6.959e-08   1.006e-08
50-150  4.282e-08   1.115e-08
15-150  1.383e-07   1.750e-08
Thermal bremsstrahlung (OTTB)

Spectral model: thermal bremsstrahlung
------------------------------------------------------------
Parameters  : value         Lower 90%    Upper 90%
kT [keV]    : 67.6244       (-18.2386      28.8338)
Norm        : 14.8321       (-2.2964     2.6602)
------------------------------------------------------------
#Fit statistic  : Chi-Squared                   63.58     using 59 bins.
 Reduced chi-squared =
# Null hypothesis probability of 2.56e-01 with 57 degrees of freedom

Energy  Fluence     90% Error
[keV]   [erg/cm2]   [erg/cm2]
15- 25  3.791e-08   5.265e-09
25- 50  5.974e-08   7.305e-09
50-150  7.477e-08   1.976e-08
15-150  1.724e-07   2.365e-08
Double BB
Spectral model: bbodyrad<1> + bbodyrad<2>
------------------------------------------------------------
Parameters  : value         Lower 90%    Upper 90%
kT1 [keV]   : 4.53443        (-1.01561      1.25097)
R1^2/D10^2  : 19.7754        (-12.4898      42.1167)
kT2 [keV]   : 16.9202        (-2.98846      4.11658)
R2^2/D10^2  : 0.148102    (-0.0868722   0.147558)
------------------------------------------------------------
#Fit statistic  : Chi-Squared                   58.85     using 59 bins.
 Reduced chi-squared =
# Null hypothesis probability of 3.36e-01 with 55 degrees of freedom

Energy  Fluence     90% Error
[keV]   [erg/cm2]   [erg/cm2]
15- 25  4.063e-08   2.002e-08
25- 50  5.440e-08   2.361e-08
50-150  7.819e-08   3.798e-08
15-150  1.732e-07   6.365e-08
Pre-slew spectrum (Pre-slew PHA with pre-slew DRM)
Power-law model

Spectral model in power-law:
------------------------------------------------------------
Parameters  : value       lower 90%   higher 90%
Photon index: 1.93609     ( -0.124188   0.127974 )
Norm@50keV  : 8.89224E-03    ( -0.00072906   0.00071955 )
------------------------------------------------------------
#Fit statistic  : Chi-Squared                   49.32     using 59 bins.
 Reduced chi-squared =
# Null hypothesis probability of 7.55e-01 with 57 degrees of freedom

Photon flux (15-150 keV)    in 10.18 sec: 1.29613 ( -0.0892567  0.0893084 ) ph/cm2/s
Energy fluence (15-150 keV)             : 8.32736e-07 ( -6.60407e-08  6.6798e-08 ) ergs/cm2
Cutoff power-law model

Spectral model in the cutoff power-law:
------------------------------------------------------------
Parameters  : value       lower 90%   higher 90%
Photon index: 1.24947     ( -0.573038   0.507315 )
Epeak [keV] : 47.4408      ( -9.7463 19.5611 )
Norm@50keV  : 2.15627E-02    ( -0.0101776   0.0232859 )
------------------------------------------------------------
#Fit statistic  : Chi-Squared                   43.75     using 59 bins.
 Reduced chi-squared =
# Null hypothesis probability of 8.83e-01 with 56 degrees of freedom

Photon flux (15-150 keV)    in 10.18 sec: 1.25864 ( -0.09301  0.09309 ) ph/cm2/s
Energy fluence (15-150 keV)             : 7.81481e-07 ( -7.30985e-08  7.53615e-08 ) ergs/cm2
Band function

Spectral model in the Band function:
------------------------------------------------------------
Parameters  : value       lower 90%   higher 90%
alpha       :    (     )
beta        :     (     )
Epeak [keV] :       (   )
Norm@50keV   :     (     )
------------------------------------------------------------

Photon flux (15-150 keV)    in  sec:  (    ) ph/cm2/s
Energy fluence (15-150 keV)             : 0 ( 0  0 ) ergs/cm2
S(25-50 keV) vs. S(50-100 keV) plot

S(25-50 keV)  = 3.13e-07
S(50-100 keV) = 3.15e-07
T90 vs. Hardness ratio plot
T90                                   = 18.8039999008179 sec.
Hardness ratio (energy fluence ratio) = 1.00639
Color vs. Color plot

Count Ratio  (25-50 keV) / (15-25 keV) = 1.06364
Count Ratio (50-100 keV) / (15-25 keV) = 0.562379
Mask shadow pattern

IMX = -3.289651009202840E-01, IMY = -4.478379599217988E-01
TIME vs. PHA plot around the trigger time
Blue+Cyan dotted lines: Time interval of the scaled map
From 0.000000 to 1.024000
TIME vs. DetID plot around the trigger time

Blue+Cyan dotted lines: Time interval of the scaled map
From 0.000000 to 1.024000
100 us light curve (15-350 keV)

Blue+Cyan dotted lines: Time interval of the scaled map
From 0.000000 to 1.024000
Spacecraft aspect plot

Bright source in the pre-burst/pre-slew/post-slew images
Pre-burst image of 15-350 keV band
Time interval of the image:
-239.720000 0.200000

# RAcent  DECcent POSerr Theta    Phi  PeakCts   SNR AngSep     Name
#  [deg]    [deg]    ['] [deg]  [deg]                   [']
254.4570  35.3871   24.3  53.3 -176.0  -0.4333  -0.5    2.7	Her X-1
110.7972  31.0174    2.6  52.4   13.0   4.1340   4.3 ------	UNKNOWN
146.9274  45.9607    3.1  22.7   -6.0   0.9905   3.7 ------	UNKNOWN
Pre-slew background subtracted image of 15-350 keV band
Time interval of the image:
0.200000 10.380600

# RAcent  DECcent POSerr Theta    Phi  PeakCts   SNR AngSep     Name
#  [deg]    [deg]    ['] [deg]  [deg]                   [']
254.3121  35.3322    9.2  53.3 -175.8   0.1836   1.3    7.2	Her X-1
246.8977  78.3949    0.5  29.1  126.3   1.5330  23.0 ------	UNKNOWN
204.9508  31.9103    2.6  32.1 -121.8   0.2894   4.5 ------	UNKNOWN
147.2288  13.1872    2.8  51.0  -35.8   0.5672   4.1 ------	UNKNOWN
Post-slew image of 15-350 keV band
Time interval of the image:
62.380630 415.073500
416.280000 962.414900

# RAcent  DECcent POSerr Theta    Phi  PeakCts   SNR AngSep     Name
#  [deg]    [deg]    ['] [deg]  [deg]                   [']
254.2977  35.4051    9.4  43.1 -162.8  -1.8321  -1.2    8.7	Her X-1
299.6745  35.2196    3.9  48.4  145.6  11.3850   2.9    4.3	Cyg X-1
308.1418  40.9318    3.9  44.4  134.8   9.5283   3.0    1.9	Cyg X-3
230.6846  27.9779    3.2  50.9 -135.4  14.0341   3.6 ------	UNKNOWN
Plot creation:
Thu Oct 20 00:47:58 EDT 2022