Estimated redshift from machine learning (Ukwatta et al. 2016) - may take a few minute to calcaulte
Image
Pre-slew 15.0-350.0 keV image (Event data)

#   RAcent    DECcent   POSerr    Theta     Phi              Peak Cts       SNR   Name
  110.0502    -2.2073   0.0152    30.1286    83.9451         1.2338653     12.664 TRIG_00998344

Foreground time interval of the image:
 -4.016  14.288 (delta_t =  18.304 [sec])
Background time interval of the image:
-129.275  -4.016 (delta_t = 125.259 [sec])
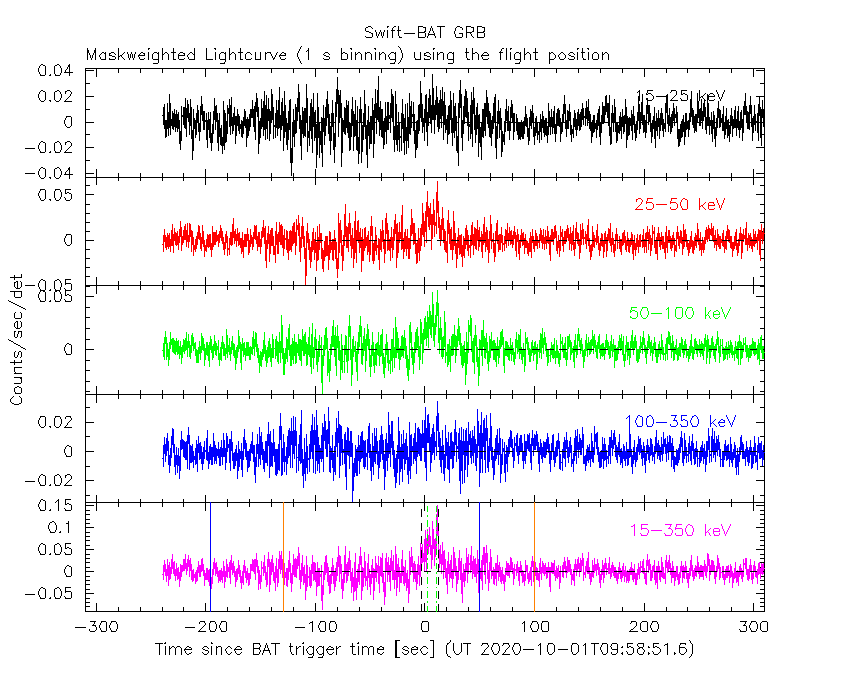
Lightcurves
Notes:
- 1) The mask-weighted light curves are using the flight position.
- 2) Multiple plots of different time binning/intervals are shown to cover all scenarios of short/long GRBs, rate/image triggers, and real/false positives.
- 3) For all the mask-weighted lightcurves, the y-axis units are counts/sec/det where a det is 0.4 x 0.4 = 0.16 sq cm.
- 4) The verticle lines correspond to following: green dotted lines are T50 interval, black dotted lines are T90 interval, blue solid line(s) is a spacecraft slew start time, and orange solid line(s) is a spacecraft slew end time.
- 5) Time of each bin is in the middle of the bin.
1 s binning
From T0-310 s to T0+310 s
From T100_start - 20 s to T100_end + 30 s

Full time interval

64 ms binning
Full time interval

From T100_start to T100_end

From T0-5 sec to T0+5 sec

16 ms binning
From T100_start-5 s to T100_start+5 s

Blue+Cyan dotted lines: Time interval of the scaled map
From 0.000000 to 8.192000
8 ms binning
From T100_start-3 s to T100_start+3 s

Blue+Cyan dotted lines: Time interval of the scaled map
From 0.000000 to 8.192000
2 ms binning
From T100_start-1 s to T100_start+1 s

Blue+Cyan dotted lines: Time interval of the scaled map
From 0.000000 to 8.192000
SN=5 or 10 sec. binning (whichever binning is satisfied first)

SN=5 or 10 sec. binning (T < 200 sec)

Quad-rate summed light curves (from T0-300s to T0+1000s)

Spectral Evolution

Spectra
Notes:
- 1) The fitting includes the systematic errors.
- 2) When the burst includes telescope slew time periods, the fitting uses an average response file made from multiple 5-s response files through out the slew time plus single time preiod for the non-slew times, and weighted by the total counts in the corresponding time period using addrmf. An average response file is needed becuase a spectral fit using the pre-slew DRM will introduce some errors in both a spectral shape and a normalization if the PHA file contains a lot of the slew/post-slew time interval.
- 3) For fits to more complicated models (e.g. a power-law over a cutoff power-law), the BAT team has decided to require a chi-square improvement of more than 6 for each extra dof.
Time averaged spectrum fit using the average DRM
Power-law model

Time interval is from   -4.016 sec. to   14.288 sec.

Spectral model in power-law:
------------------------------------------------------------
Parameters  : value       lower 90%   higher 90%
Photon index: 0.940419     ( -0.230551   0.218375 )
Norm@50keV  : 4.05613E-03    ( -0.000545238   0.000539011 )
------------------------------------------------------------
#Fit statistic  : Chi-Squared                   56.67     using 59 bins.
 Reduced chi-squared = 0.994211
# Null hypothesis probability of 4.87e-01 with 57 degrees of freedom

Photon flux (15-150 keV)    in 18.3 sec: 0.465879 ( -0.062883  0.063273 ) ph/cm2/s
Energy fluence (15-150 keV)             : 8.20373e-07 ( -1.09436e-07  1.09859e-07 ) ergs/cm2
Cutoff power-law model

Time interval is from   -4.016 sec. to   14.288 sec.
Spectral model in the cutoff power-law:
------------------------------------------------------------
Parameters  : value       lower 90%   higher 90%
Photon index: 0.143310     ( -1.20284   0.924723 )
Epeak [keV] : 138.338      ( -51.7272 -138.338 )
Norm@50keV  : 8.87224E-03    ( -0.00887224   0.018083 )
------------------------------------------------------------
#Fit statistic  : Chi-Squared                   54.63     using 59 bins.
 Reduced chi-squared = 0.975536
# Null hypothesis probability of 5.27e-01 with 56 degrees of freedom

Photon flux (15-150 keV)    in 18.3 sec: 0.450376 ( -0.065646  0.06595 ) ph/cm2/s
Energy fluence (15-150 keV)             : 7.93618e-07 ( -1.17969e-07  1.16193e-07 ) ergs/cm2
Band function

Time interval is from   -4.016 sec. to   14.288 sec.


Spectral model in the Band function:
------------------------------------------------------------
Parameters  : value       lower 90%   higher 90%
alpha       :    (     )
beta        :     (     )
Epeak [keV] :       (   )
Norm@50keV   :     (     )
------------------------------------------------------------

Photon flux (15-150 keV)    in  sec:  (    ) ph/cm2/s
Energy fluence (15-150 keV)             : 0 ( 0  0 ) ergs/cm2
Single BB

Spectral model blackbody:
------------------------------------------------------------
Parameters  : value    Lower 90%  Upper 90%
kT [keV]    : 22.9932  (-3.50728  4.57531)
R^2/D10^2   : 1.49139E-02  (-0.00647969   0.0104753)
(R is the radius in km and D10 is the distance to the source in units of 10 kpc)
------------------------------------------------------------
#Fit statistic  : Chi-Squared                   58.84     using 59 bins.
 Reduced chi-squared =
# Null hypothesis probability of 4.08e-01 with 57 degrees of freedom

Energy  Fluence     90% Error
[keV]   [erg/cm2]   [erg/cm2]
15- 25  2.615e-08   6.744e-09
25- 50  1.419e-07   3.079e-08
50-150  5.603e-07   1.217e-07
15-150  7.283e-07   1.524e-07
Thermal bremsstrahlung (OTTB)

Spectral model: thermal bremsstrahlung
------------------------------------------------------------
Parameters  : value         Lower 90%    Upper 90%
kT [keV]    : 200.000       (-26.6935      -200)
Norm        : 1.94172       (-0.263097     0.263097)
------------------------------------------------------------
#Fit statistic  : Chi-Squared                   77.12     using 59 bins.
 Reduced chi-squared =
# Null hypothesis probability of 3.92e-02 with 57 degrees of freedom

Energy  Fluence     90% Error
[keV]   [erg/cm2]   [erg/cm2]
15- 25  8.851e-08   4.993e-08
25- 50  1.703e-07   9.534e-08
50-150  3.734e-07   2.076e-07
15-150  6.322e-07   3.556e-07
Double BB

Spectral model: bbodyrad<1> + bbodyrad<2>
------------------------------------------------------------
Parameters  : value         Lower 90%    Upper 90%
kT1 [keV]   : 11.7530        (-1.43974      3.35431)
R1^2/D10^2  : 6.01166E-02        (-1963.91      1.87759e+10)
kT2 [keV]   : 36.8315        (-37.2675      -37.2677)
R2^2/D10^2  : 2.66700E-03    (-0.00246766   0.0106399)
------------------------------------------------------------
#Fit statistic  : Chi-Squared                   54.16     using 59 bins.
 Reduced chi-squared =
# Null hypothesis probability of 5.07e-01 with 55 degrees of freedom

Energy  Fluence     90% Error
[keV]   [erg/cm2]   [erg/cm2]
15- 25  3.696e-08   9.608e-09
25- 50  1.361e-07   3.213e-08
50-150  5.688e-07   1.297e-07
15-150  7.418e-07   1.439e-07
Peak spectrum fit
Power-law model

Time interval is from   10.788 sec. to   11.788 sec.

Spectral model in power-law:
------------------------------------------------------------
Parameters  : value       lower 90%   higher 90%
Photon index: 1.42759     ( -0.431443   0.445177 )
Norm@50keV  : 7.75943E-03    ( -0.00225183   0.00224027 )
------------------------------------------------------------
#Fit statistic  : Chi-Squared                   57.87     using 59 bins.
 Reduced chi-squared = 1.01526
# Null hypothesis probability of 4.43e-01 with 57 degrees of freedom

Photon flux (15-150 keV)    in 1 sec: 0.950976 ( -0.27603  0.277144 ) ph/cm2/s
Energy fluence (15-150 keV)             : 7.45916e-08 ( -2.30533e-08  2.34951e-08 ) ergs/cm2
Cutoff power-law model

Time interval is from   10.788 sec. to   11.788 sec.
Spectral model in the cutoff power-law:
------------------------------------------------------------
Parameters  : value       lower 90%   higher 90%
Photon index: -3.94952     ( 2.98095   3.46898 )
Epeak [keV] : 54.8536      ( -10.9518 32.0207 )
Norm@50keV  : 3.20078    ( -3.1648   3041.32 )
------------------------------------------------------------
#Fit statistic  : Chi-Squared                   52.26     using 59 bins.
 Reduced chi-squared = 0.933214
# Null hypothesis probability of 6.17e-01 with 56 degrees of freedom

Photon flux (15-150 keV)    in 1 sec: 0.806341 ( -0.282722  0.313539 ) ph/cm2/s
Energy fluence (15-150 keV)             : 6.01381e-08 ( -2.12175e-08  2.63109e-08 ) ergs/cm2
Band function

Time interval is from   10.788 sec. to   11.788 sec.


Spectral model in the Band function:
------------------------------------------------------------
Parameters  : value       lower 90%   higher 90%
alpha       :    (     )
beta        :     (     )
Epeak [keV] :       (   )
Norm@50keV   :     (     )
------------------------------------------------------------

Photon flux (15-150 keV)    in  sec:  (    ) ph/cm2/s
Energy fluence (15-150 keV)             : 0 ( 0  0 ) ergs/cm2
Single BB

Spectral model blackbody:
------------------------------------------------------------
Parameters  : value    Lower 90%  Upper 90%
kT [keV]    : 15.4035  (-3.26352  4.54677)
R^2/D10^2   : 0.114756  (-0.0701818   0.149418)
(R is the radius in km and D10 is the distance to the source in units of 10 kpc)
------------------------------------------------------------
#Fit statistic  : Chi-Squared                   52.71     using 59 bins.
 Reduced chi-squared =
# Null hypothesis probability of 6.37e-01 with 57 degrees of freedom

Energy  Fluence     90% Error
[keV]   [erg/cm2]   [erg/cm2]
15- 25  5.674e-09   3.302e-09
25- 50  2.309e-08   1.159e-08
50-150  3.772e-08   2.008e-08
15-150  6.649e-08   3.289e-08
Thermal bremsstrahlung (OTTB)

Spectral model: thermal bremsstrahlung
------------------------------------------------------------
Parameters  : value         Lower 90%    Upper 90%
kT [keV]    : 199.361       (-121.322      -199.362)
Norm        : 3.99052       (-1.12685     1.12819)
------------------------------------------------------------
#Fit statistic  : Chi-Squared                   57.10     using 59 bins.
 Reduced chi-squared =
# Null hypothesis probability of 4.71e-01 with 57 degrees of freedom

Energy  Fluence     90% Error
[keV]   [erg/cm2]   [erg/cm2]
15- 25  9.937e-09   6.185e-09
25- 50  1.911e-08   1.179e-08
50-150  4.192e-08   2.536e-08
15-150  7.097e-08   4.253e-08
Double BB

Spectral model: bbodyrad<1> + bbodyrad<2>
------------------------------------------------------------
Parameters  : value         Lower 90%    Upper 90%
kT1 [keV]   : 0.962908        (-0.962908      1.7196)
R1^2/D10^2  : 9.36331E+05        (-936345      3.3043e+07)
kT2 [keV]   : 15.9061        (-3.42607      4.91744)
R2^2/D10^2  : 0.100099    (-0.0629178   0.101204)
------------------------------------------------------------
#Fit statistic  : Chi-Squared                   50.89     using 59 bins.
 Reduced chi-squared =
# Null hypothesis probability of 6.32e-01 with 55 degrees of freedom

Energy  Fluence     90% Error
[keV]   [erg/cm2]   [erg/cm2]
15- 25  6.313e-09   3.235e-09
25- 50  2.195e-08   1.324e-08
50-150  3.873e-08   2.358e-08
15-150  6.700e-08   4.076e-08
Pre-slew spectrum (Pre-slew PHA with pre-slew DRM)
Power-law model

Spectral model in power-law:
------------------------------------------------------------
Parameters  : value       lower 90%   higher 90%
Photon index: 0.940419     ( -0.230551   0.218375 )
Norm@50keV  : 4.05613E-03    ( -0.000545238   0.000539011 )
------------------------------------------------------------
#Fit statistic  : Chi-Squared                   56.67     using 59 bins.
 Reduced chi-squared =
# Null hypothesis probability of 4.87e-01 with 57 degrees of freedom

Photon flux (15-150 keV)    in 18.3 sec: 0.465874 ( -0.0628731  0.0632946 ) ph/cm2/s
Energy fluence (15-150 keV)             : 8.20254e-07 ( -1.09381e-07  1.09917e-07 ) ergs/cm2
Cutoff power-law model

Spectral model in the cutoff power-law:
------------------------------------------------------------
Parameters  : value       lower 90%   higher 90%
Photon index: 0.143309     ( -1.20284   0.924725 )
Epeak [keV] : 138.338      ( -51.725 -138.338 )
Norm@50keV  : 8.87225E-03    ( -0.00887225   0.018083 )
------------------------------------------------------------
#Fit statistic  : Chi-Squared                   54.63     using 59 bins.
 Reduced chi-squared =
# Null hypothesis probability of 5.27e-01 with 56 degrees of freedom

Photon flux (15-150 keV)    in 18.3 sec: 0.450371 ( -0.065638  0.065938 ) ph/cm2/s
Energy fluence (15-150 keV)             : 7.93999e-07 ( -1.18026e-07  1.16324e-07 ) ergs/cm2
Band function

Spectral model in the Band function:
------------------------------------------------------------
Parameters  : value       lower 90%   higher 90%
alpha       :    (     )
beta        :     (     )
Epeak [keV] :       (   )
Norm@50keV   :     (     )
------------------------------------------------------------

Photon flux (15-150 keV)    in  sec:  (    ) ph/cm2/s
Energy fluence (15-150 keV)             : 0 ( 0  0 ) ergs/cm2
S(25-50 keV) vs. S(50-100 keV) plot

S(25-50 keV)  = 1.46e-07
S(50-100 keV) = 3.04e-07
T90 vs. Hardness ratio plot

T90                                   = 15.8880000114441 sec.
Hardness ratio (energy fluence ratio) = 2.08219
Color vs. Color plot
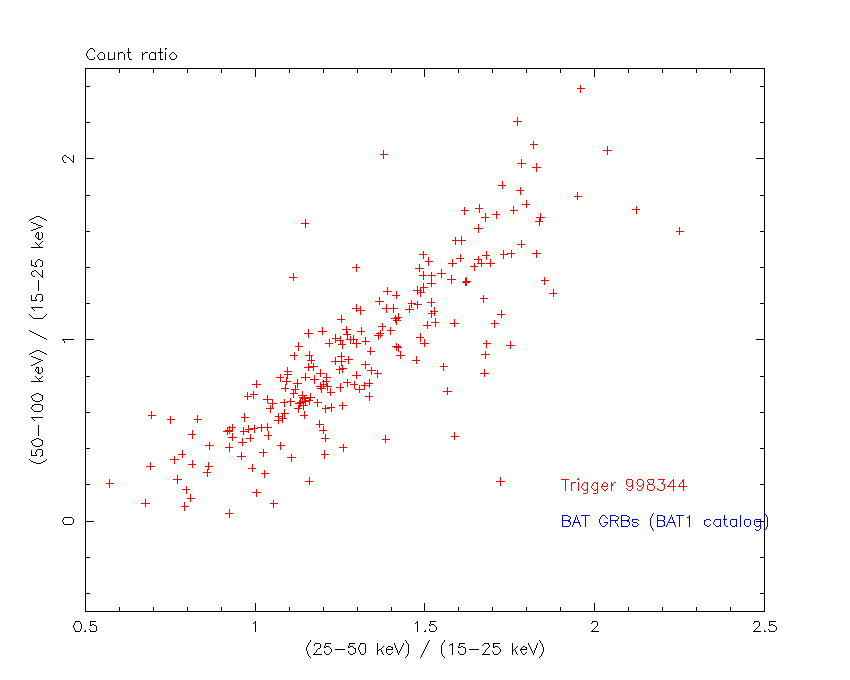
Count Ratio  (25-50 keV) / (15-25 keV) = 2.42876
Count Ratio (50-100 keV) / (15-25 keV) = 2.61694
Mask shadow pattern

IMX = 6.121586613625030E-02, IMY = -5.771094880487742E-01
TIME vs. PHA plot around the trigger time

Blue+Cyan dotted lines: Time interval of the scaled map
From 0.000000 to 8.192000
TIME vs. DetID plot around the trigger time

Blue+Cyan dotted lines: Time interval of the scaled map
From 0.000000 to 8.192000
100 us light curve (15-350 keV)

Blue+Cyan dotted lines: Time interval of the scaled map
From 0.000000 to 8.192000
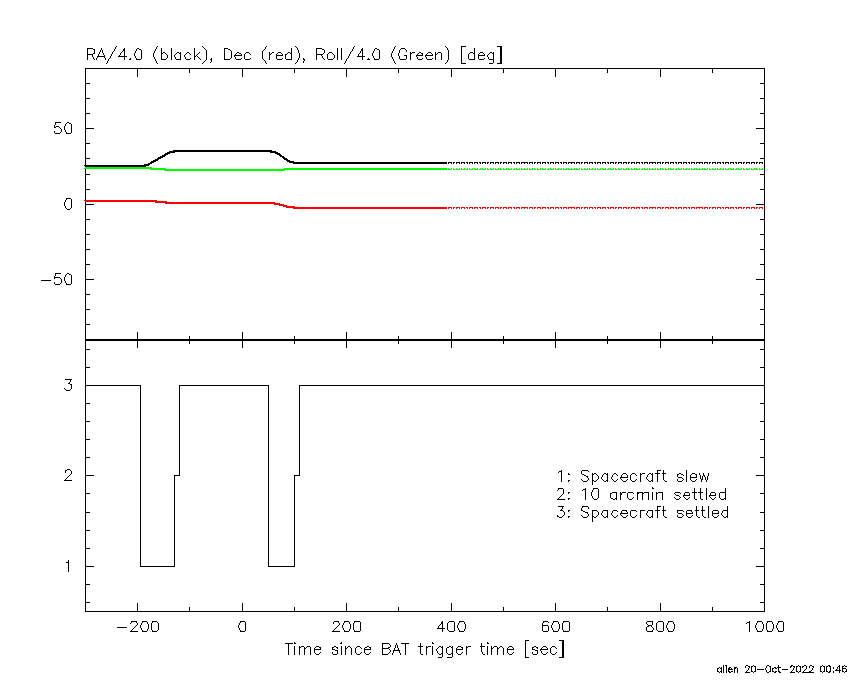
Spacecraft aspect plot
Bright source in the pre-burst/pre-slew/post-slew images
Pre-burst image of 15-350 keV band
Time interval of the image:
-129.275400 -4.016000

# RAcent  DECcent POSerr Theta    Phi  PeakCts   SNR AngSep     Name
#  [deg]    [deg]    ['] [deg]  [deg]                   [']
135.6762 -40.6137   15.4  41.5    4.6   0.2230   0.7    7.6	Vela X-1
104.4826  39.3044    2.9  50.4  143.8   4.0328   4.0 ------	UNKNOWN
108.0417  -2.2523    2.4  32.1   84.2   1.6374   4.8 ------	UNKNOWN
112.7443  44.7971    2.9  50.3  154.5   2.8034   4.0 ------	UNKNOWN
118.1844 -49.5848    2.1  53.7   17.0   4.1925   5.4 ------	UNKNOWN
120.1837 -27.8234    2.4  34.3   31.8   1.2701   4.9 ------	UNKNOWN
Pre-slew background subtracted image of 15-350 keV band
Time interval of the image:
-4.016000 14.288000

# RAcent  DECcent POSerr Theta    Phi  PeakCts   SNR AngSep     Name
#  [deg]    [deg]    ['] [deg]  [deg]                   [']
135.6764 -40.5980    5.8  41.5    4.6   0.1954   2.0    7.2	Vela X-1
106.5972 -16.2876    2.5  37.1   60.8   0.6138   4.7 ------	UNKNOWN
110.0502  -2.2073    0.9  30.1   83.9   1.2339  12.7 ------	UNKNOWN
111.7679  15.8592    1.9  31.7  119.5   0.5989   6.0 ------	UNKNOWN
179.7918  40.5230    2.4  53.7 -143.3   1.3908   4.8 ------	UNKNOWN
Post-slew image of 15-350 keV band
Time interval of the image:
100.324600 962.754000

# RAcent  DECcent POSerr Theta    Phi  PeakCts   SNR AngSep     Name
#  [deg]    [deg]    ['] [deg]  [deg]                   [']
 83.6370  22.0196    0.5  35.4  131.7  34.5225  21.7    0.4	Crab
135.5472 -40.6761    7.3  44.8  -30.4   2.3242   1.6    7.3	Vela X-1
 82.7256  -0.0536    3.3  27.5   91.3   4.3855   3.5 ------	UNKNOWN
112.2224  52.0996    3.0  54.4  178.7  11.6823   3.8 ------	UNKNOWN
127.8768 -56.5862    5.5  56.2  -14.5   6.0759   2.1 ------	UNKNOWN
Plot creation:
Thu Oct 20 00:47:26 EDT 2022