Estimated redshift from machine learning (Ukwatta et al. 2016) - may take a few minute to calcaulte
Image
Pre-slew 15.0-350.0 keV image (Event data)
#   RAcent    DECcent   POSerr    Theta     Phi              Peak Cts       SNR   Name
   61.9103    65.1482   0.0176    31.3518    85.3135         0.2455157     10.930 TRIG_00998907

Foreground time interval of the image:
 -0.008   0.548 (delta_t =   0.556 [sec])
Background time interval of the image:
-65.291  -0.008 (delta_t =  65.283 [sec])
Lightcurves
Notes:
- 1) The mask-weighted light curves are using the flight position.
- 2) Multiple plots of different time binning/intervals are shown to cover all scenarios of short/long GRBs, rate/image triggers, and real/false positives.
- 3) For all the mask-weighted lightcurves, the y-axis units are counts/sec/det where a det is 0.4 x 0.4 = 0.16 sq cm.
- 4) The verticle lines correspond to following: green dotted lines are T50 interval, black dotted lines are T90 interval, blue solid line(s) is a spacecraft slew start time, and orange solid line(s) is a spacecraft slew end time.
- 5) Time of each bin is in the middle of the bin.
1 s binning
From T0-310 s to T0+310 s
From T100_start - 20 s to T100_end + 30 s
Full time interval
64 ms binning
Full time interval
From T100_start to T100_end

From T0-5 sec to T0+5 sec

16 ms binning
From T100_start-5 s to T100_start+5 s

Blue+Cyan dotted lines: Time interval of the scaled map
From 0.000000 to 0.512000
8 ms binning
From T100_start-3 s to T100_start+3 s
Blue+Cyan dotted lines: Time interval of the scaled map
From 0.000000 to 0.512000
2 ms binning
From T100_start-1 s to T100_start+1 s

Blue+Cyan dotted lines: Time interval of the scaled map
From 0.000000 to 0.512000
SN=5 or 10 sec. binning (whichever binning is satisfied first)

SN=5 or 10 sec. binning (T < 200 sec)

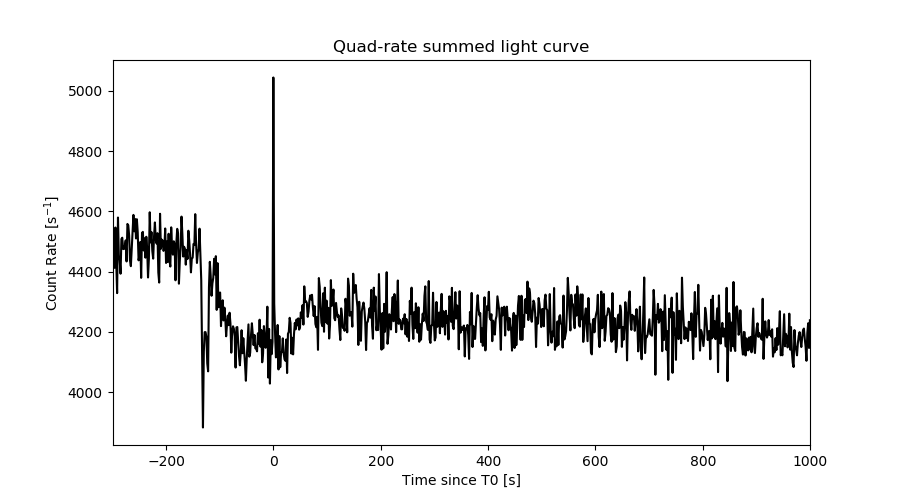
Quad-rate summed light curves (from T0-300s to T0+1000s)
Spectral Evolution

Spectra
Notes:
- 1) The fitting includes the systematic errors.
- 2) When the burst includes telescope slew time periods, the fitting uses an average response file made from multiple 5-s response files through out the slew time plus single time preiod for the non-slew times, and weighted by the total counts in the corresponding time period using addrmf. An average response file is needed becuase a spectral fit using the pre-slew DRM will introduce some errors in both a spectral shape and a normalization if the PHA file contains a lot of the slew/post-slew time interval.
- 3) For fits to more complicated models (e.g. a power-law over a cutoff power-law), the BAT team has decided to require a chi-square improvement of more than 6 for each extra dof.
Time averaged spectrum fit using the average DRM
Power-law model
Time interval is from   -0.008 sec. to    0.548 sec.

Spectral model in power-law:
------------------------------------------------------------
Parameters  : value       lower 90%   higher 90%
Photon index: 1.42397     ( -0.244088   0.244638 )
Norm@50keV  : 2.39932E-02    ( -0.00399338   0.00398172 )
------------------------------------------------------------
#Fit statistic  : Chi-Squared                   64.37     using 59 bins.
 Reduced chi-squared = 1.1293
# Null hypothesis probability of 2.34e-01 with 57 degrees of freedom

Photon flux (15-150 keV)    in 0.556 sec: 2.93831 ( -0.4907  0.49153 ) ph/cm2/s
Energy fluence (15-150 keV)             : 1.28299e-07 ( -2.29055e-08  2.31074e-08 ) ergs/cm2
Cutoff power-law model
Time interval is from   -0.008 sec. to    0.548 sec.
Spectral model in the cutoff power-law:
------------------------------------------------------------
Parameters  : value       lower 90%   higher 90%
Photon index: -0.400334     ( -1.80431   1.28481 )
Epeak [keV] : 62.4757      ( -13.1064 40.669 )
Norm@50keV  : 0.221521    ( -0.221653   1.78347 )
------------------------------------------------------------
#Fit statistic  : Chi-Squared                   57.88     using 59 bins.
 Reduced chi-squared = 1.03357
# Null hypothesis probability of 4.06e-01 with 56 degrees of freedom

Photon flux (15-150 keV)    in 0.556 sec: 2.84932 ( -0.49707  0.4983 ) ph/cm2/s
Energy fluence (15-150 keV)             : 1.15485e-07 ( -2.39226e-08  2.5138e-08 ) ergs/cm2
Band function

Time interval is from   -0.008 sec. to    0.548 sec.


Spectral model in the Band function:
------------------------------------------------------------
Parameters  : value       lower 90%   higher 90%
alpha       :    (     )
beta        :     (     )
Epeak [keV] :       (   )
Norm@50keV   :     (     )
------------------------------------------------------------

Photon flux (15-150 keV)    in  sec:  (    ) ph/cm2/s
Energy fluence (15-150 keV)             : 0 ( 0  0 ) ergs/cm2
Single BB
Spectral model blackbody:
------------------------------------------------------------
Parameters  : value    Lower 90%  Upper 90%
kT [keV]    : 14.4475  (-2.22069  2.74264)
R^2/D10^2   : 0.426232  (-0.198966   0.344651)
(R is the radius in km and D10 is the distance to the source in units of 10 kpc)
------------------------------------------------------------
#Fit statistic  : Chi-Squared                   59.27     using 59 bins.
 Reduced chi-squared =
# Null hypothesis probability of 3.93e-01 with 57 degrees of freedom

Energy  Fluence     90% Error
[keV]   [erg/cm2]   [erg/cm2]
15- 25  1.041e-08   3.481e-09
25- 50  3.994e-08   8.393e-09
50-150  5.576e-08   1.783e-08
15-150  1.061e-07   2.541e-08
Thermal bremsstrahlung (OTTB)

Spectral model: thermal bremsstrahlung
------------------------------------------------------------
Parameters  : value         Lower 90%    Upper 90%
kT [keV]    : 199.362       (-84.3168      -199.363)
Norm        : 12.3124       (-2.00513     2.00787)
------------------------------------------------------------
#Fit statistic  : Chi-Squared                   62.87     using 59 bins.
 Reduced chi-squared =
# Null hypothesis probability of 2.76e-01 with 57 degrees of freedom

Energy  Fluence     90% Error
[keV]   [erg/cm2]   [erg/cm2]
15- 25  1.705e-08   9.891e-09
25- 50  3.279e-08   1.858e-08
50-150  7.192e-08   4.050e-08
15-150  1.218e-07   7.000e-08
Double BB
Spectral model: bbodyrad<1> + bbodyrad<2>
------------------------------------------------------------
Parameters  : value         Lower 90%    Upper 90%
kT1 [keV]   : 12.6759        (-11.9149      3.08577)
R1^2/D10^2  : 0.616650        (-0.31353      4.22822)
kT2 [keV]   : 200.000        (-200      -200)
R2^2/D10^2  : 1.92024E-04    (-0.000188093   0.00231436)
------------------------------------------------------------
#Fit statistic  : Chi-Squared                   56.45     using 59 bins.
 Reduced chi-squared =
# Null hypothesis probability of 4.20e-01 with 55 degrees of freedom

Energy  Fluence     90% Error
[keV]   [erg/cm2]   [erg/cm2]
15- 25  1.191e-08   6.177e-09
25- 50  4.022e-08   1.873e-08
50-150  6.838e-08   3.543e-08
15-150  1.205e-07   5.326e-08
Peak spectrum fit
Power-law model
Time interval is from   -0.230 sec. to    0.770 sec.

Spectral model in power-law:
------------------------------------------------------------
Parameters  : value       lower 90%   higher 90%
Photon index: 1.49865     ( -0.236243   0.240385 )
Norm@50keV  : 1.72052E-02    ( -0.00286471   0.00284735 )
------------------------------------------------------------
#Fit statistic  : Chi-Squared                   72.75     using 59 bins.
 Reduced chi-squared = 1.27632
# Null hypothesis probability of 7.80e-02 with 57 degrees of freedom

Photon flux (15-150 keV)    in 1 sec: 2.14716 ( -0.34649  0.34684 ) ph/cm2/s
Energy fluence (15-150 keV)             : 1.63271e-07 ( -2.9115e-08  2.95392e-08 ) ergs/cm2
Cutoff power-law model

Time interval is from   -0.230 sec. to    0.770 sec.
Spectral model in the cutoff power-law:
------------------------------------------------------------
Parameters  : value       lower 90%   higher 90%
Photon index: -1.37334     ( -2.37601   1.58291 )
Epeak [keV] : 52.9620      ( -7.7439 9.60793 )
Norm@50keV  : 0.610603    ( -0.673718   11.394 )
------------------------------------------------------------
#Fit statistic  : Chi-Squared                   59.98     using 59 bins.
 Reduced chi-squared = 1.07107
# Null hypothesis probability of 3.34e-01 with 56 degrees of freedom

Photon flux (15-150 keV)    in 1 sec: 2.02157 ( -0.34777  0.3512 ) ph/cm2/s
Energy fluence (15-150 keV)             : 1.36842e-07 ( -2.6579e-08  2.99672e-08 ) ergs/cm2
Band function

Time interval is from   -0.230 sec. to    0.770 sec.


Spectral model in the Band function:
------------------------------------------------------------
Parameters  : value       lower 90%   higher 90%
alpha       :    (     )
beta        :     (     )
Epeak [keV] :       (   )
Norm@50keV   :     (     )
------------------------------------------------------------

Photon flux (15-150 keV)    in  sec:  (    ) ph/cm2/s
Energy fluence (15-150 keV)             : 0 ( 0  0 ) ergs/cm2
Single BB
Spectral model blackbody:
------------------------------------------------------------
Parameters  : value    Lower 90%  Upper 90%
kT [keV]    : 13.4830  (-1.80057  2.1503)
R^2/D10^2   : 0.400809  (-0.167998   0.269147)
(R is the radius in km and D10 is the distance to the source in units of 10 kpc)
------------------------------------------------------------
#Fit statistic  : Chi-Squared                   60.06     using 59 bins.
 Reduced chi-squared =
# Null hypothesis probability of 3.65e-01 with 57 degrees of freedom

Energy  Fluence     90% Error
[keV]   [erg/cm2]   [erg/cm2]
15- 25  1.543e-08   4.020e-09
25- 50  5.525e-08   1.162e-08
50-150  6.483e-08   2.177e-08
15-150  1.355e-07   2.629e-08
Thermal bremsstrahlung (OTTB)

Spectral model: thermal bremsstrahlung
------------------------------------------------------------
Parameters  : value         Lower 90%    Upper 90%
kT [keV]    : 179.766       (-85.434      -179.766)
Norm        : 9.00478       (-1.45692     1.6375)
------------------------------------------------------------
#Fit statistic  : Chi-Squared                   69.71     using 59 bins.
 Reduced chi-squared =
# Null hypothesis probability of 1.20e-01 with 57 degrees of freedom

Energy  Fluence     90% Error
[keV]   [erg/cm2]   [erg/cm2]
15- 25  2.271e-08   1.278e-08
25- 50  4.314e-08   2.307e-08
50-150  9.131e-08   5.145e-08
15-150  1.572e-07   8.655e-08
Double BB

Spectral model: bbodyrad<1> + bbodyrad<2>
------------------------------------------------------------
Parameters  : value         Lower 90%    Upper 90%
kT1 [keV]   : 198.780        (-198.784      -198.784)
R1^2/D10^2  : 6.74348E-05        (-6.74307e-05      0.631959)
kT2 [keV]   : 12.8378        (-8.49243      2.48663)
R2^2/D10^2  : 0.458048    (-0.146565   3.44719)
------------------------------------------------------------
#Fit statistic  : Chi-Squared                   59.48     using 59 bins.
 Reduced chi-squared =
# Null hypothesis probability of 3.16e-01 with 55 degrees of freedom

Energy  Fluence     90% Error
[keV]   [erg/cm2]   [erg/cm2]
15- 25  1.579e-08   3.843e-06
25- 50  5.497e-08   3.538e-05
50-150  6.622e-08   8.230e-04
15-150  1.370e-07   8.760e-04
Pre-slew spectrum (Pre-slew PHA with pre-slew DRM)
Power-law model
Spectral model in power-law:
------------------------------------------------------------
Parameters  : value       lower 90%   higher 90%
Photon index: 1.42397     ( -0.244088   0.244638 )
Norm@50keV  : 2.39932E-02    ( -0.00399338   0.00398172 )
------------------------------------------------------------
#Fit statistic  : Chi-Squared                   64.37     using 59 bins.
 Reduced chi-squared =
# Null hypothesis probability of 2.34e-01 with 57 degrees of freedom

Photon flux (15-150 keV)    in 0.556 sec: 2.93825 ( -0.490683  0.491507 ) ph/cm2/s
Energy fluence (15-150 keV)             : 1.28284e-07 ( -2.28995e-08  2.31225e-08 ) ergs/cm2
Cutoff power-law model

Spectral model in the cutoff power-law:
------------------------------------------------------------
Parameters  : value       lower 90%   higher 90%
Photon index: -0.399738     ( -1.8045   1.28462 )
Epeak [keV] : 62.4850      ( -13.1072 40.6726 )
Norm@50keV  : 0.221337    ( -0.221648   1.78354 )
------------------------------------------------------------
#Fit statistic  : Chi-Squared                   57.88     using 59 bins.
 Reduced chi-squared =
# Null hypothesis probability of 4.06e-01 with 56 degrees of freedom

Photon flux (15-150 keV)    in 0.556 sec: 2.84913 ( -0.497  0.49816 ) ph/cm2/s
Energy fluence (15-150 keV)             : 1.15523e-07 ( -2.39347e-08  2.51618e-08 ) ergs/cm2
Band function
Spectral model in the Band function:
------------------------------------------------------------
Parameters  : value       lower 90%   higher 90%
alpha       :    (     )
beta        :     (     )
Epeak [keV] :       (   )
Norm@50keV   :     (     )
------------------------------------------------------------

Photon flux (15-150 keV)    in  sec:  (    ) ph/cm2/s
Energy fluence (15-150 keV)             : 0 ( 0  0 ) ergs/cm2
S(25-50 keV) vs. S(50-100 keV) plot
S(25-50 keV)  = 3.05e-08
S(50-100 keV) = 4.55e-08
T90 vs. Hardness ratio plot

T90                                   = 0.491999864578247 sec.
Hardness ratio (energy fluence ratio) = 1.4918
Color vs. Color plot
Count Ratio  (25-50 keV) / (15-25 keV) = 2.25739
Count Ratio (50-100 keV) / (15-25 keV) = 1.56145
Mask shadow pattern

IMX = 4.977743143023378E-02, IMY = -6.072106334266935E-01
TIME vs. PHA plot around the trigger time

Blue+Cyan dotted lines: Time interval of the scaled map
From 0.000000 to 0.512000
TIME vs. DetID plot around the trigger time
Blue+Cyan dotted lines: Time interval of the scaled map
From 0.000000 to 0.512000
100 us light curve (15-350 keV)
Blue+Cyan dotted lines: Time interval of the scaled map
From 0.000000 to 0.512000
Spacecraft aspect plot

Bright source in the pre-burst/pre-slew/post-slew images
Pre-burst image of 15-350 keV band
Time interval of the image:
-65.291320 -0.008000

# RAcent  DECcent POSerr Theta    Phi  PeakCts   SNR AngSep     Name
#  [deg]    [deg]    ['] [deg]  [deg]                   [']
104.9906  23.7817    2.7  52.4   13.1   1.5217   4.2 ------	UNKNOWN
245.6056  62.1918    2.5  36.1 -168.9   0.6364   4.6 ------	UNKNOWN
250.7487  46.3380    2.4  51.1 -160.5   1.4684   4.8 ------	UNKNOWN
134.4238  11.2332    3.1  58.7  -23.5   2.6169   3.8 ------	UNKNOWN
223.2383  38.0551    3.1  49.1 -132.0   2.0452   3.7 ------	UNKNOWN
Pre-slew background subtracted image of 15-350 keV band
Time interval of the image:
-0.008000 0.548000

# RAcent  DECcent POSerr Theta    Phi  PeakCts   SNR AngSep     Name
#  [deg]    [deg]    ['] [deg]  [deg]                   [']
 61.9104  65.1482    1.1  31.4   85.3   0.2455  10.9 ------	UNKNOWN
206.6489  59.4624    2.9  25.5 -137.6   0.0479   4.0 ------	UNKNOWN
167.0389  26.4521    2.4  43.9  -63.8   0.1830   4.8 ------	UNKNOWN
224.4385  37.8204    3.0  49.8 -133.0   0.1699   3.9 ------	UNKNOWN
Post-slew image of 15-350 keV band
Time interval of the image:
68.308580 718.643400
720.208000 962.285900

# RAcent  DECcent POSerr Theta    Phi  PeakCts   SNR AngSep     Name
#  [deg]    [deg]    ['] [deg]  [deg]                   [']
 83.6155  22.0098    0.4  45.4    7.1  34.6127  27.2    1.0	Crab
 86.0569  12.2190    3.1  55.5    6.9  10.8455   3.7 ------	UNKNOWN
297.0647  57.2654    2.6  50.7 -179.1   9.7784   4.4 ------	UNKNOWN
 93.1301  14.1512    3.0  55.2   -1.8   8.5225   3.9 ------	UNKNOWN
 74.7586  61.5401    3.3   6.8  -27.8   2.9325   3.5 ------	UNKNOWN
121.7474  48.6130    4.2  34.9  -55.5   4.0195   2.7 ------	UNKNOWN
121.1820  29.5813    2.8  50.6  -39.4  11.4508   4.2 ------	UNKNOWN
123.3287  28.3711    3.1  52.5  -40.8  14.4027   3.7 ------	UNKNOWN
Plot creation:
Thu Oct 20 00:46:53 EDT 2022