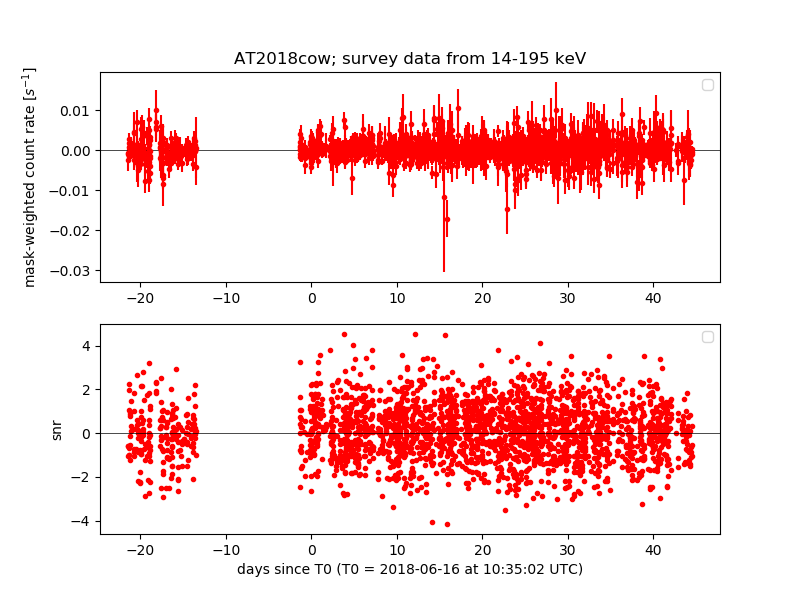
- Light curves in other energy bands:
14-20 keV;
20-24 keV;
24-35 keV;
35-50 keV;
50-75 keV;
75-100 keV;
100-150 keV;
150-195 keV
- Data for the daily light curves:
14-20 keV;
20-24 keV;
24-35 keV;
35-50 keV;
50-75 keV;
75-100 keV;
100-150 keV;
150-195 keV;
14-195 keV
(2) light curve from snapshot observations

- Light curves in other energy bands:
14-20 keV;
20-24 keV;
24-35 keV;
35-50 keV;
50-75 keV;
75-100 keV;
100-150 keV;
150-195 keV
- Data for the snapshot light curves:
FITS file (standard BAT survey output catalog and contains the 8-band data).
Light curve from BAT transient monitor


14-20 keV; 20-24 keV; 24-35 keV; 35-50 keV; 50-75 keV; 75-100 keV; 100-150 keV; 150-195 keV
14-20 keV; 20-24 keV; 24-35 keV; 35-50 keV; 50-75 keV; 75-100 keV; 100-150 keV; 150-195 keV; 14-195 keV

- Light curves in other energy bands:
14-20 keV;
20-24 keV;
24-35 keV;
35-50 keV;
50-75 keV;
75-100 keV;
100-150 keV;
150-195 keV
- Data for the snapshot light curves:
FITS file (standard BAT survey output catalog and contains the 8-band data).
Light curve from BAT transient monitor


14-20 keV; 20-24 keV; 24-35 keV; 35-50 keV; 50-75 keV; 75-100 keV; 100-150 keV; 150-195 keV