Estimated redshift from machine learning (Ukwatta et al. 2016) - may take a few minutes to calcaulte
Image
Pre-slew 15-350 keV image (Event data; bkg subtracted)

#   RAcent  DECcent POSerr  Theta    Phi     Peak Cts     SNR  Name
  163.7743 +22.4606 0.0084   55.2  -10.7       5.2030    23.0  TRIG_00791201
------------------------------------------

Foreground time interval of the image:
-15.528   8.773 (delta_t =  24.301 [sec])
Background time interval of the image:
-239.528 -15.528 (delta_t = 224.000 [sec])
Lightcurves
Notes:
- 1) All plots contain as much data as has been downloaded to date.
- 2) The mask-weighted light curves are using the flight position.
- 3) Multiple plots of different time binning/intervals are shown to cover all scenarios of short/long GRBs, rate/image triggers, and real/false positives.
- 4) For all the mask-weighted lightcurves, the y-axis units are counts/sec/det where a det is 0.4 x 0.4 = 0.16 sq cm.
- 5) The verticle lines correspond to following: green dotted lines are T50 interval, black dotted lines are T90 interval, blue solid line(s) is a spacecraft slew start time, and orange solid line(s) is a spacecraft slew end time.
- 6) Time of each bin is in the middle of the bin.
1 s binning
From T0-310 s to T0+310 s

From T100_start - 20 s to T100_end + 30 s

Full time interval

64 ms binning
Full time interval

From T100_start to T100_end

From T0-5 sec to T0+5 sec

16 ms binning
From T100_start-5 s to T100_start+5 s

Blue+Cyan dotted lines: Time interval of the scaled map
From 0.000000 to 0.256000
8 ms binning
From T100_start-3 s to T100_start+3 s

Blue+Cyan dotted lines: Time interval of the scaled map
From 0.000000 to 0.256000
2 ms binning
From T100_start-1 s to T100_start+1 s

Blue+Cyan dotted lines: Time interval of the scaled map
From 0.000000 to 0.256000
SN=5 or 10 sec. binning (whichever binning is satisfied first)

SN=5 or 10 sec. binning (T < 200 sec)

Spectra
Notes:
- 1) The fitting includes the systematic errors.
- 2) For long bursts, a spectral fit of the pre-slew DRM will introduce some errors in both a spectral shape and a normalization if the PHA file contains a lot of the slew/post-slew time interval.
- 3) For fits to more complicated models (e.g. a power-law over a cutoff power-law), the BAT team has decided to require a chi-square improvement of more than 6 for each extra dof.
- 4) For short bursts (T90<1sec), the specrtum is also fit with Blackbody, OTTB, and Double Blackbody.
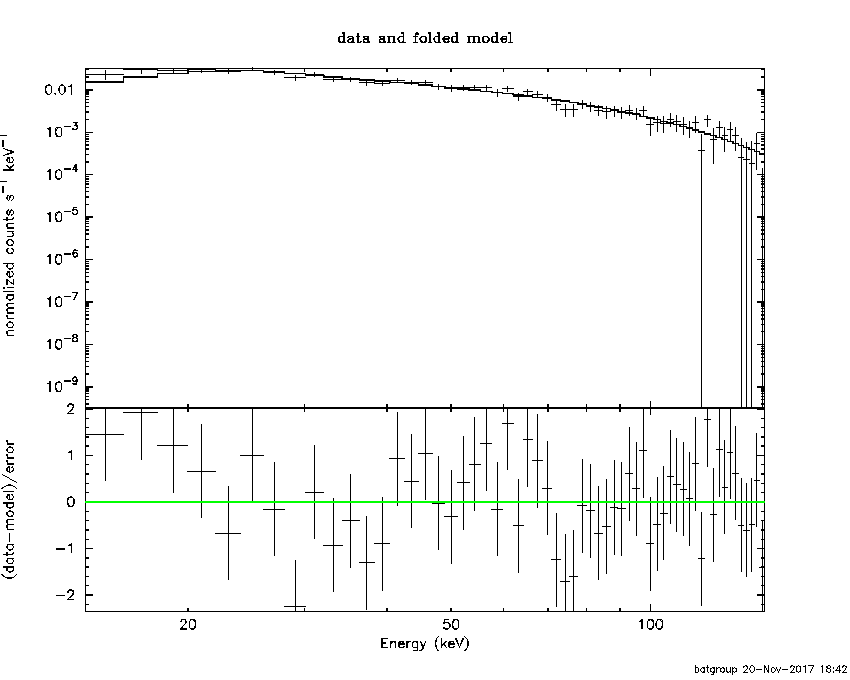
Time averaged spectrum fit using the pre-slew DRM
Power-law model

Time interval is from  -15.528 sec. to   64.472 sec.

Spectral model in power-law:
------------------------------------------------------------
Parameters  : value       lower 90%   higher 90%
Photon index: 1.66545     ( -0.0627465   0.0630636 )
Norm@50keV  : 1.18427E-02    ( -0.000422763   0.000422662 )
------------------------------------------------------------
#Fit statistic : Chi-Squared =          70.86 using 59 PHA bins.
# Reduced chi-squared =          1.243 for     57 degrees of freedom
# Null hypothesis probability =   1.026334e-01

Photon flux (15-150 keV)    in 80 sec: 1.55434 ( -0.0619123  0.062157 ) ph/cm2/s
Energy fluence (15-150 keV)             : 8.79816e-06 ( -3.22411e-07  3.22677e-07 ) ergs/cm2
Cutoff power-law model

Time interval is from  -15.528 sec. to   64.472 sec.
Spectral model in the cutoff power-law:
------------------------------------------------------------
Parameters  : value       lower 90%   higher 90%
Photon index: 1.05949     ( -0.289709   0.273018 )
Epeak [keV] : 85.9748      ( -11.8525 26.0639 )
Norm@50keV  : 2.24322E-02    ( -0.00548333   0.00777071 )
------------------------------------------------------------
#Fit statistic : Chi-Squared =          55.57 using 59 PHA bins.
# Reduced chi-squared =         0.9923 for     56 degrees of freedom
# Null hypothesis probability =   4.910347e-01

Photon flux (15-150 keV)    in 80 sec: 1.49082 ( -0.06678  0.06722 ) ph/cm2/s
Energy fluence (15-150 keV)             : 8.55848e-06 ( -3.4376e-07  3.4288e-07 ) ergs/cm2
Band function

Time interval is from  -15.528 sec. to   64.472 sec.

Spectral model in the Band function:
------------------------------------------------------------
Parameters  : value       lower 90%   higher 90%
alpha       : -1.05960   ( -0.261468   0.307837 )
beta        : -10.0000    ( 10   7.10543e-15 )
Epeak [keV] : 85.9665      ( -11.363 26.0577 )
Norm@50keV   : 2.24276E-02    ( -0.00549062   0.00777641 )
------------------------------------------------------------
#Fit statistic : Chi-Squared =          55.57 using 59 PHA bins.
# Reduced chi-squared =          1.010 for     55 degrees of freedom
# Null hypothesis probability =   4.530793e-01

Photon flux (15-150 keV)    in 80 sec: 1.49008 ( 5.50992  -0.05728 ) ph/cm2/s
Energy fluence (15-150 keV)             : 8.56464e-06 ( -8.56408e-06  -3.5632e-07 ) ergs/cm2
Single BB

Spectral model blackbody:
------------------------------------------------------------
Parameters  : value    Lower 90%  Upper 90%
kT [keV]    : 15.8814  (  )
R^2/D10^2   : 0.137663  (   )
(R is the radius in km and D10 is the distance to the source in units of 10 kpc)
------------------------------------------------------------
#Fit statistic : Chi-Squared =         187.73 using 59 PHA bins.
# Reduced chi-squared =         3.2935 for     57 degrees of freedom
# Null hypothesis probability =   7.381887e-16

Energy  Fluence     90% Error
[keV]   [erg/cm2]   [erg/cm2]
15- 25  5.753e-07   4.220e-08
25- 50  2.405e-06   1.164e-07
50-150  4.228e-06   2.628e-07
15-150  7.209e-06   2.912e-07
Thermal bremsstrahlung (OTTB)

Spectral model: thermal bremsstrahlung
------------------------------------------------------------
Parameters  : value         Lower 90%    Upper 90%
kT [keV]    : 160.526       (-24.1176      31.9469)
Norm        : 6.32211       (-0.279474     0.299267)
------------------------------------------------------------
#Fit statistic : Chi-Squared =          57.45 using 59 PHA bins.
# Reduced chi-squared =          1.008 for     57 degrees of freedom
# Null hypothesis probability =   4.584070e-01

Energy  Fluence     90% Error
[keV]   [erg/cm2]   [erg/cm2]
15- 25  1.287e-06   7.800e-08
25- 50  2.411e-06   1.864e-07
50-150  4.904e-06   1.194e-06
15-150  8.602e-06   1.330e-06
Double BB

Spectral model: bbodyrad<1> + bbodyrad<2>
------------------------------------------------------------
Parameters  : value         Lower 90%    Upper 90%
kT1 [keV]   : 6.44094        (-1.15111      1.29941)
R1^2/D10^2  : 1.96273        (-0.924754      2.24577)
kT2 [keV]   : 22.2165        (-2.08071      2.87778)
R2^2/D10^2  : 3.32108E-02    (-0.0131932   0.0166888)
------------------------------------------------------------
#Fit statistic : Chi-Squared =          60.28 using 59 PHA bins.
# Reduced chi-squared =          1.096 for     55 degrees of freedom
# Null hypothesis probability =   2.905783e-01

Energy  Fluence     90% Error
[keV]   [erg/cm2]   [erg/cm2]
15- 25  1.193e-06   2.060e-07
25- 50  2.388e-06   2.788e-07
50-150  4.873e-06   4.376e-07
15-150  8.454e-06   7.828e-07
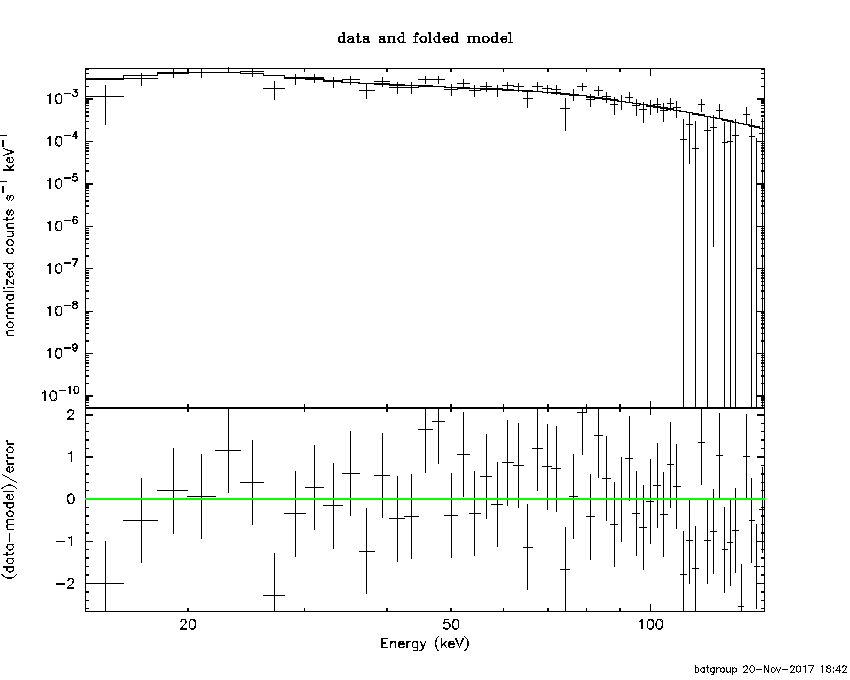
Peak spectrum fit
Power-law model

Time interval is from   39.972 sec. to   40.972 sec.

Spectral model in power-law:
------------------------------------------------------------
Parameters  : value       lower 90%   higher 90%
Photon index: 1.87297     ( -0.0664507   0.0673196 )
Norm@50keV  : 8.02005E-02    ( -0.00327793   0.00327105 )
------------------------------------------------------------
#Fit statistic : Chi-Squared =          70.21 using 59 PHA bins.
# Reduced chi-squared =          1.232 for     57 degrees of freedom
# Null hypothesis probability =   1.123095e-01

Photon flux (15-150 keV)    in 1 sec: 11.3798 ( -0.492316  0.493784 ) ph/cm2/s
Energy fluence (15-150 keV)             : 7.37287e-07 ( -3.0128e-08  3.0154e-08 ) ergs/cm2
Cutoff power-law model

Time interval is from   39.972 sec. to   40.972 sec.
Spectral model in the cutoff power-law:
------------------------------------------------------------
Parameters  : value       lower 90%   higher 90%
Photon index: 0.970515     ( -0.342818   0.318167 )
Epeak [keV] : 59.2365      ( -5.13673 7.23509 )
Norm@50keV  : 0.221365    ( -0.0656053   0.102647 )
------------------------------------------------------------
#Fit statistic : Chi-Squared =          43.85 using 59 PHA bins.
# Reduced chi-squared =         0.7831 for     56 degrees of freedom
# Null hypothesis probability =   8.807854e-01

Photon flux (15-150 keV)    in 1 sec: 10.8348 ( -0.517  0.5199 ) ph/cm2/s
Energy fluence (15-150 keV)             : 7.1069e-07 ( -3.215e-08  3.1965e-08 ) ergs/cm2
Band function

Time interval is from   39.972 sec. to   40.972 sec.

Spectral model in the Band function:
------------------------------------------------------------
Parameters  : value       lower 90%   higher 90%
alpha       : -0.598227   ( -0.487928   0.631061 )
beta        : -2.44152    ( 2.44449   0.251401 )
Epeak [keV] : 52.4234      ( -6.70659 8.28198 )
Norm@50keV   : 0.360786    ( -0.16256   0.464793 )
------------------------------------------------------------
#Fit statistic : Chi-Squared =          41.30 using 59 PHA bins.
# Reduced chi-squared =         0.7510 for     55 degrees of freedom
# Null hypothesis probability =   9.144032e-01

Photon flux (15-150 keV)    in 1 sec: 10.7067 ( -3.7067  -0.5268 ) ph/cm2/s
Energy fluence (15-150 keV)             : 7.08596e-07 ( -7.08589e-07  -3.1424e-08 ) ergs/cm2
Single BB

Spectral model blackbody:
------------------------------------------------------------
Parameters  : value    Lower 90%  Upper 90%
kT [keV]    : 13.3749  (  )
R^2/D10^2   : 1.83990  (   )
(R is the radius in km and D10 is the distance to the source in units of 10 kpc)
------------------------------------------------------------
#Fit statistic : Chi-Squared =         134.77 using 59 PHA bins.
# Reduced chi-squared =         2.3644 for     57 degrees of freedom
# Null hypothesis probability =   3.038440e-08

Energy  Fluence     90% Error
[keV]   [erg/cm2]   [erg/cm2]
15- 25  6.975e-08   5.385e-09
25- 50  2.476e-07   1.170e-08
50-150  2.846e-07   2.280e-08
15-150  6.019e-07   2.685e-08
Thermal bremsstrahlung (OTTB)

Spectral model: thermal bremsstrahlung
------------------------------------------------------------
Parameters  : value         Lower 90%    Upper 90%
kT [keV]    : 98.3935       (-11.6141      14.2196)
Norm        : 50.2260       (-2.92965     3.12105)
------------------------------------------------------------
#Fit statistic : Chi-Squared =          46.67 using 59 PHA bins.
# Reduced chi-squared =         0.8188 for     57 degrees of freedom
# Null hypothesis probability =   8.337623e-01

Energy  Fluence     90% Error
[keV]   [erg/cm2]   [erg/cm2]
15- 25  1.313e-07   1.045e-08
25- 50  2.262e-07   1.140e-08
50-150  3.632e-07   9.090e-08
15-150  7.208e-07   9.375e-08
Double BB
Spectral model: bbodyrad<1> + bbodyrad<2>
------------------------------------------------------------
Parameters  : value         Lower 90%    Upper 90%
kT1 [keV]   : 8.69573        (-1.51346      1.29775)
R1^2/D10^2  : 6.24315        (-2.01901      4.59722)
kT2 [keV]   : 25.1568        (-5.00186      8.31716)
R2^2/D10^2  : 0.100413    (-0.0667515   0.166674)
------------------------------------------------------------
#Fit statistic : Chi-Squared =          50.71 using 59 PHA bins.
# Reduced chi-squared =         0.9220 for     55 degrees of freedom
# Null hypothesis probability =   6.391987e-01

Energy  Fluence     90% Error
[keV]   [erg/cm2]   [erg/cm2]
15- 25  1.012e-07   1.325e-08
25- 50  2.441e-07   2.845e-08
50-150  3.559e-07   1.041e-07
15-150  7.012e-07   1.180e-07
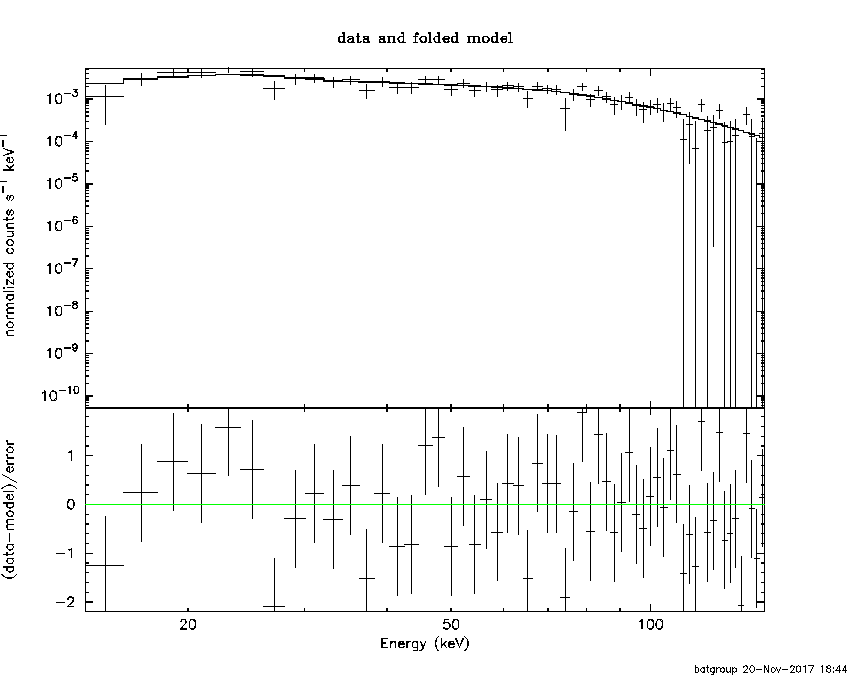
Pre-slew spectrum (Pre-slew PHA with pre-slew DRM)
Power-law model
Spectral model in power-law:
------------------------------------------------------------
Parameters  : value       lower 90%   higher 90%
Photon index: 1.35018     ( -0.111364   0.110444 )
Norm@50keV  : 1.48316E-02    ( -0.000998854   0.000998088 )
------------------------------------------------------------
#Fit statistic : Chi-Squared =          64.04 using 59 PHA bins.
# Reduced chi-squared =          1.123 for     57 degrees of freedom
# Null hypothesis probability =   2.433427e-01

Photon flux (15-150 keV)    in 24.3 sec: 1.78684 ( -0.130895  0.131478 ) ph/cm2/s
Energy fluence (15-150 keV)             : 3.51986e-06 ( -2.43058e-07  2.4335e-07 ) ergs/cm2
Cutoff power-law model

Spectral model in the cutoff power-law:
------------------------------------------------------------
Parameters  : value       lower 90%   higher 90%
Photon index: 0.524064     ( -0.549402   0.487407 )
Epeak [keV] : 103.981      ( -20.3518 64.0868 )
Norm@50keV  : 3.42449E-02    ( -0.0130605   0.0238652 )
------------------------------------------------------------
#Fit statistic : Chi-Squared =          55.06 using 59 PHA bins.
# Reduced chi-squared =         0.9832 for     56 degrees of freedom
# Null hypothesis probability =   5.104807e-01

Photon flux (15-150 keV)    in 24.3 sec: 1.71745 ( -0.13642  0.13703 ) ph/cm2/s
Energy fluence (15-150 keV)             : 3.44139e-06 ( -2.52015e-07  2.51262e-07 ) ergs/cm2
Band function
Spectral model in the Band function:
------------------------------------------------------------
Parameters  : value       lower 90%   higher 90%
alpha       : -0.523989   ( -0.356674   0.766852 )
beta        : -10.0000    ( 10   3.55271e-15 )
Epeak [keV] : 103.961      ( -16.0825 63.7374 )
Norm@50keV   : 3.42477E-02    ( -0.0130488   0.0238995 )
------------------------------------------------------------
#Fit statistic : Chi-Squared =          55.06 using 59 PHA bins.
# Reduced chi-squared =          1.001 for     55 degrees of freedom
# Null hypothesis probability =   4.723878e-01

Photon flux (15-150 keV)    in 24.3 sec: 1.73157 (    ) ph/cm2/s
Energy fluence (15-150 keV)             : 3.44268e-06 ( 0  0 ) ergs/cm2
S(25-50 keV) vs. S(50-100 keV) plot

S(25-50 keV)  = 2.35e-06
S(50-100 keV) = 2.96e-06
T90 vs. Hardness ratio plot

T90                                   = 64 sec.
Hardness ratio (energy fluence ratio) = 1.25957
Color vs. Color plot

Count Ratio  (25-50 keV) / (15-25 keV) = 1.5277
Count Ratio (50-100 keV) / (15-25 keV) = 1.23784
Mask shadow pattern

IMX = 1.412443566695675E+00, IMY = 2.658009751184113E-01
TIME vs. PHA plot around the trigger time

Blue+Cyan dotted lines: Time interval of the scaled map
From 0.000000 to 0.256000
TIME vs. DetID plot around the trigger time

Blue+Cyan dotted lines: Time interval of the scaled map
From 0.000000 to 0.256000
100 us light curve (15-350 keV)

Blue+Cyan dotted lines: Time interval of the scaled map
From 0.000000 to 0.256000
Spacecraft aspect plot

Bright source in the pre-burst/pre-slew/post-slew images
Pre-burst image of 15-350 keV band
Time interval of the image:
-239.528000 -15.528000

# RAcent  DECcent POSerr Theta    Phi  PeakCts   SNR AngSep     Name
#  [deg]    [deg]    ['] [deg]  [deg]                   [']
254.2860  35.3398   10.1  39.5 -126.4  -0.5620  -1.1    8.4	Her X-1
299.5224  35.1340    7.5  55.8 -171.9   1.5591   1.5    5.2	Cyg X-1
308.1026  40.7979    6.5  53.8  177.6   1.6178   1.9    9.3	Cyg X-3
236.0430  30.1646    3.9  39.9 -101.0   2.9032   3.0 ------	UNKNOWN
212.9095  25.5453    3.1  42.5  -69.2   3.8311   3.8 ------	UNKNOWN
205.9653  23.6280    3.1  44.8  -60.2   4.5322   3.7 ------	UNKNOWN
Pre-slew background subtracted image of 15-350 keV band
Time interval of the image:
-15.528000 8.772600

# RAcent  DECcent POSerr Theta    Phi  PeakCts   SNR AngSep     Name
#  [deg]    [deg]    ['] [deg]  [deg]                   [']
254.3958  35.4489    4.8  39.4 -126.6  -0.3245  -2.4    7.1	Her X-1
299.6946  35.2347   19.4  55.8 -172.1  -0.1524  -0.6    5.5	Cyg X-1
308.0133  40.8979    5.8  53.7  177.6   0.4805   2.0    5.5	Cyg X-3
  9.4896  68.4986    2.5  42.3  121.7   1.0700   4.7 ------	UNKNOWN
163.7743  22.4606    0.5  55.2  -10.7   5.2030  23.0 ------	UNKNOWN
208.6700  31.5647    2.3  36.7  -63.0   0.6600   5.0 ------	UNKNOWN
252.2394  29.3485    2.0  44.5 -120.8   1.6516   5.8 ------	UNKNOWN
Post-slew image of 15-350 keV band
Time interval of the image:
77.472600 714.772590

# RAcent  DECcent POSerr Theta    Phi  PeakCts   SNR AngSep     Name
#  [deg]    [deg]    ['] [deg]  [deg]                   [']
123.8430  19.4810    3.3  37.3   68.1   3.6480   3.5 ------	UNKNOWN
137.6263  68.3022    4.0  48.6  142.4   5.8547   2.9 ------	UNKNOWN
225.0061  61.6276    2.7  56.8 -175.2  10.0667   4.3 ------	UNKNOWN
219.8589  54.0530    2.9  52.3 -167.0   5.4170   4.0 ------	UNKNOWN
192.6050  29.7125    3.0  26.8 -136.9   1.7012   3.8 ------	UNKNOWN
Plot creation:
Mon Nov 20 18:46:54 EST 2017