Transient Analysis Summary
Summary of the Input Information
- T0: 587683356.453999996 [MET] (2019-08-16T21:22:13.027 UTC)
- Search time window: T0 +/- 100.0 s
- Input source: RA=0.0, DEC=0.0 (source location is randomly seleected, since the true location is unknown.)
- Input image: /local/data/bat2/batusers/batgroup/BAT_GW/results/GBM-190816/GBM-190816-with-LV-v1.fits.gz
FOV Check
- The input source is out of the BAT FOV
- The input image does not overlaps with the BAT FOV
- The integrated LIGO localization probability that are in BAT FOV (with pcode > 10%): 0.22463381278725683
- The integrated LIGO localization probability that are outside of the BAT FOV (with pcode > 10%) but above the Earth's limb: 0.6284702970351163
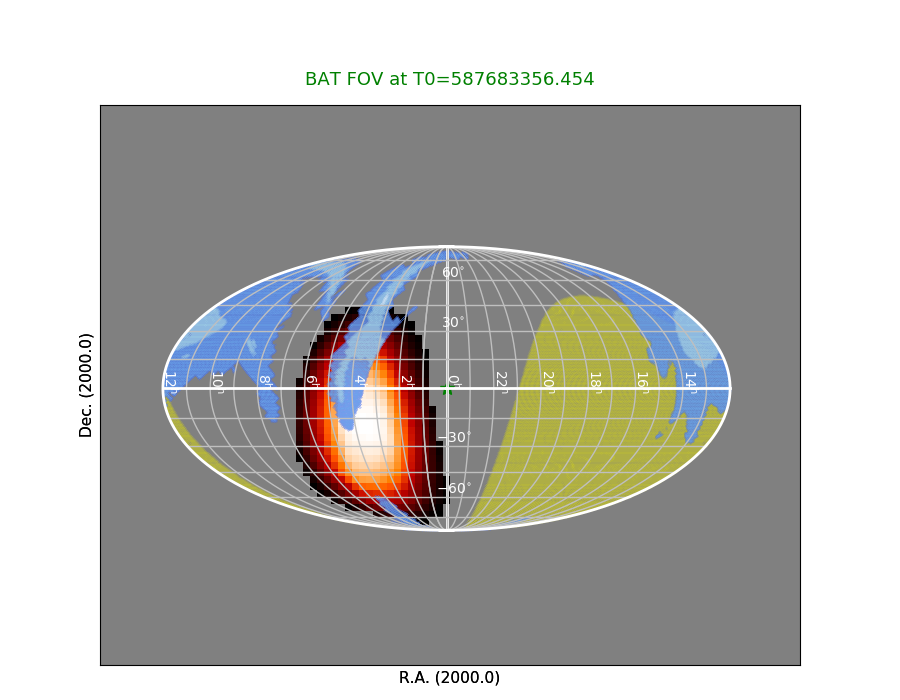
BAT FOV 10s ago
BAT FOV 10s after
RED: BAT FOV (the brighter/whiter color refers to higher partial coding fraction).
YELLOW: Earth
BLUE: LIGO probability map
GREEN STAR: Input source (location is randomly seleected unless the true source location is available.)
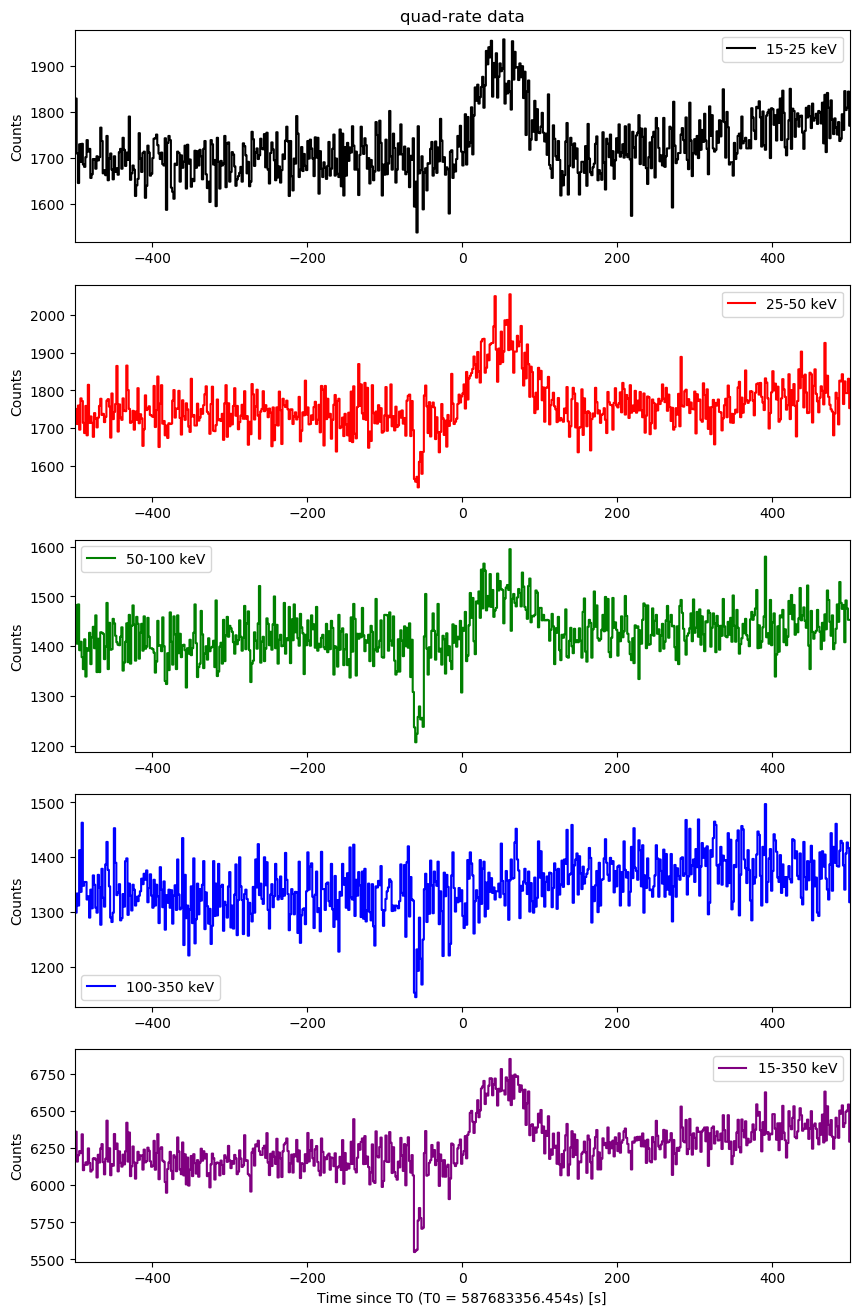
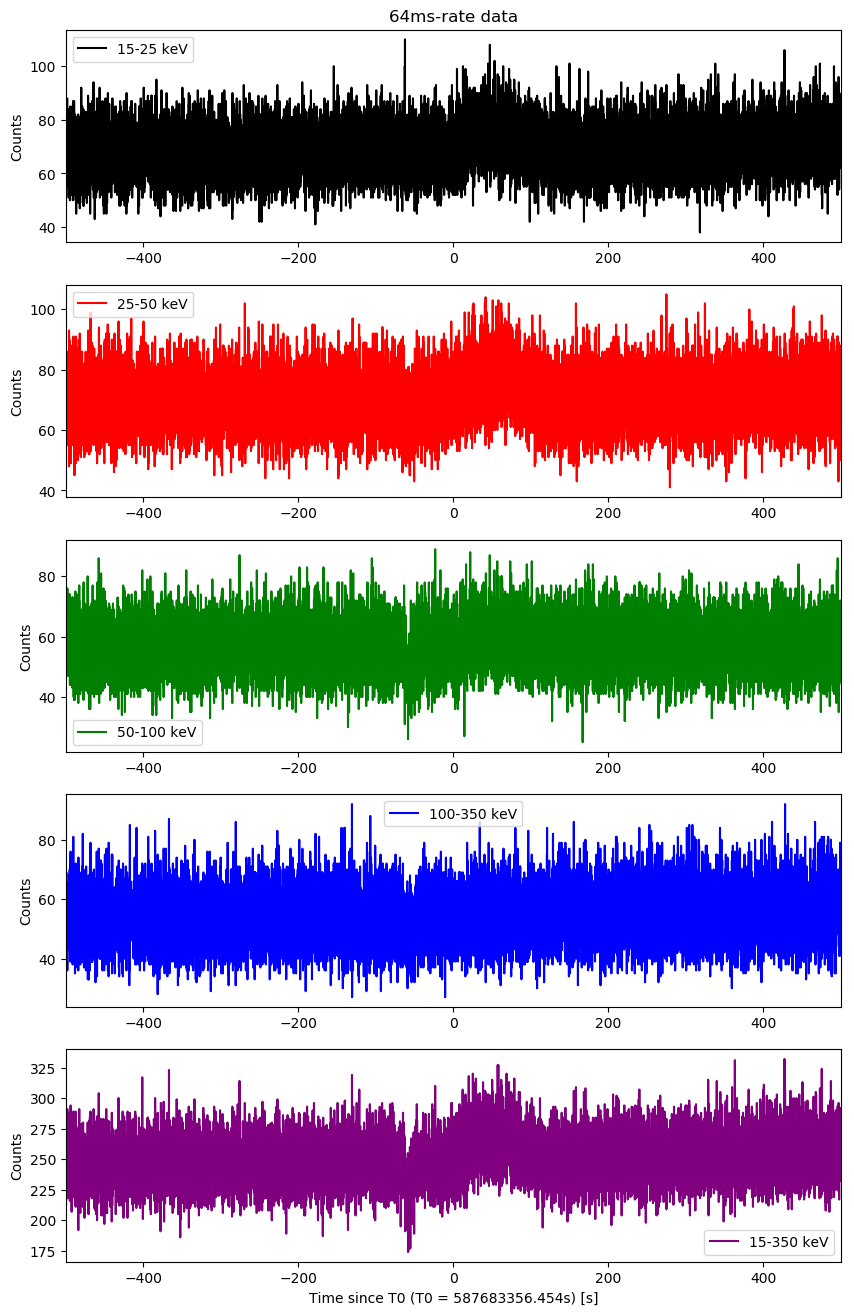
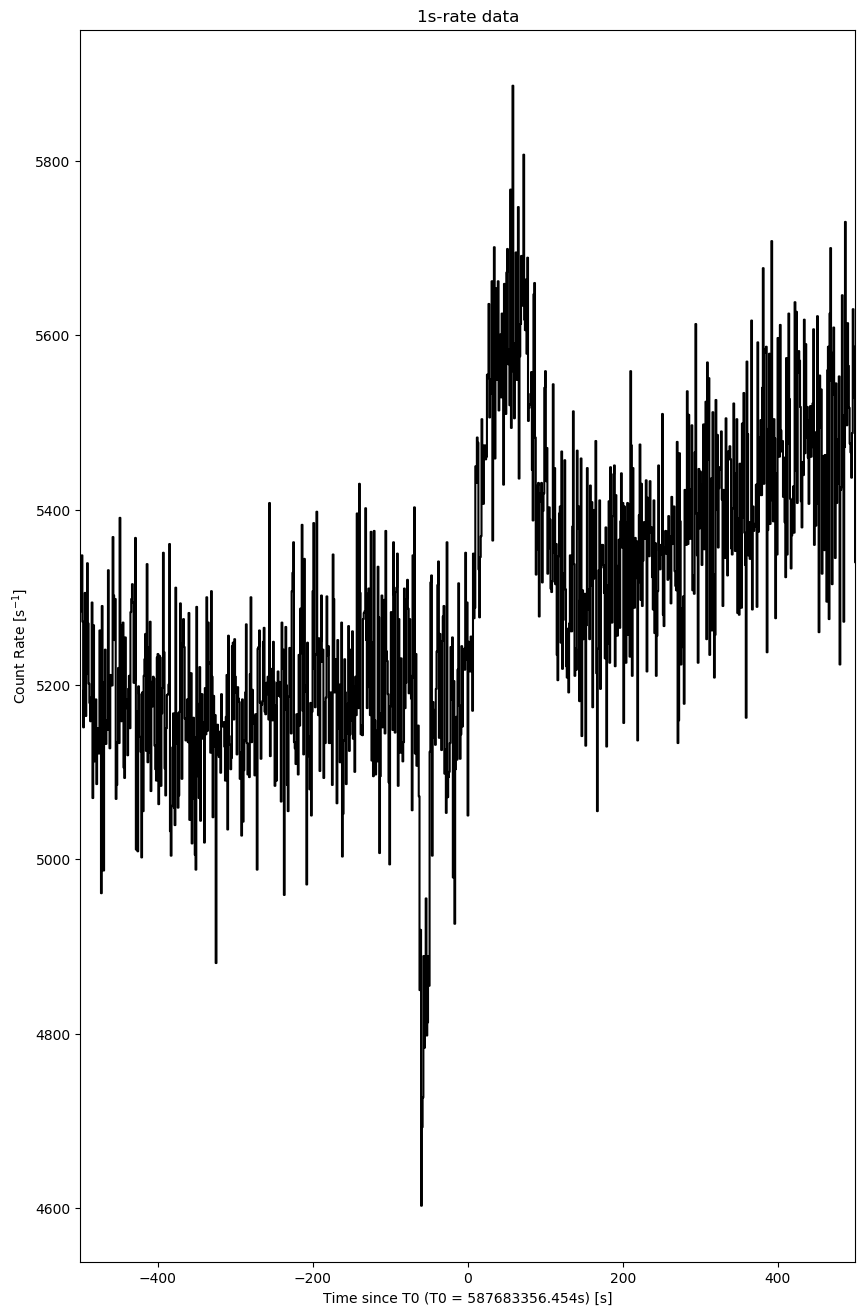
Raw Light Curves
Quad-rate light curves (with 1.6 s time bin)
64-ms light curves
1-s light curves
Event data image search
Slew event data found from T0-65.454 to T0+38.656 and from T0+39.546 to T0+150.361 (obsid=03109780004). The analysis results are listing below.


## list of detected sources for 03109780004

########################################

########################################
## tstart_since_T0: 0.0
## tstop_since_T0: 0.1

                 TIME                           NAME     RA_OBJ    DEC_OBJ        SNR
                    s                                       deg        deg
  1  587683356.454000 Crab                              83.6332    22.0145      0.504
########################################

#########################################
## Fermi-GBM signal duration
## tstart_since_T0: 1.536
## tstop_since_T0: 1.636
  SCRIPT DSPCLEAN SRC_TYPE MERIT THRESHOLD ORIG_RA ORIG_DEC
#   RAcent  DECcent POSerr  Theta    Phi     Peak Cts     SNR  Name
   83.6332 +22.0145 0.0000   47.9 -139.8       0.0031     0.4  Crab
   96.1865 -42.1308 0.0384   41.2  -39.8       0.0272     5.0  UNKNOWN
#########################################

#########################################
## MOSAIC IMAGE (Note that results are reported in GLON and GLAT)
## tstart_since_T0: -2.0
## tstop_since_T0: 2.0
# GLONcent GLATcent POSerr  Theta    Phi     Peak Cts     SNR  Name
  250.4053 -41.1880 0.0139   37.3  111.0       0.0504     4.9  UNKNOWN
  229.9522  -9.0291 0.0174   34.9  166.1       0.2421     3.8  UNKNOWN
  239.4596 -22.0461 0.0200   32.4  141.4       0.0482     3.3  UNKNOWN
  255.2351 -60.5752 0.0124   26.9  165.2       0.0592     5.3  UNKNOWN
  250.4055 -41.1898 0.0136   39.6  160.4       0.0508     4.9  UNKNOWN
#########################################
Last update:
Tue Aug 20 11:03:57 EDT 2019