Transient Analysis Summary
Summary of the Input Information
- T0: 577873107.815000057 [MET] (2019-04-25T08:18:05 UTC)
- Search time window: T0 +/- 100.0 s
- Input source: RA=0.0, DEC=0.0 (source location is randomly seleected, since the true location is unknown.)
- Input image: /local/data/bat2/batusers/batgroup/BAT_GW/results/S190425z/bayestar.fits.gz
FOV Check
- The input source is out of the BAT FOV
- The input image does not overlaps with the BAT FOV
- Max probability in LIGO map: 6.890843958619067e-05
- Sum of (BAT pcode)*(LIGO probability) of the entire LIGO map: 0.043567522567647655
- The integrated LIGO localization probability that are in BAT FOV (with pcode > 10%): 0.11796449303062892
- The integrated probability of Phil's convolved map that are in BAT FOV (with pcode > 10%): 0.08397780370412392
- The integrated LIGO localization probability that are outside of the BAT FOV (with pcode > 10%) but above the Earth's limb: 0.6215180977247479
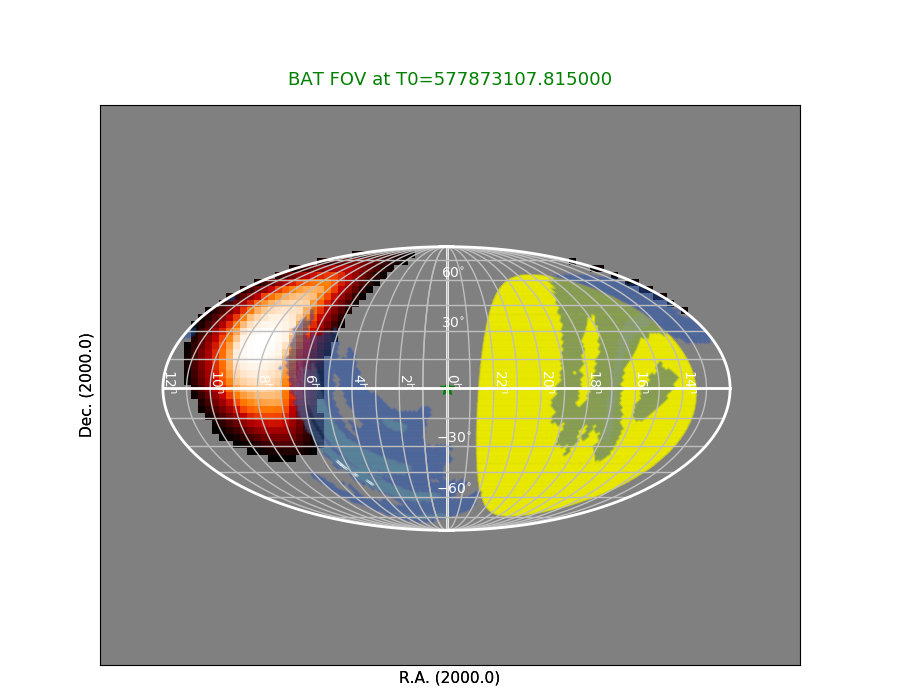 RED: BAT FOV (the brighter/whiter color refers to higher partial coding fraction).
YELLOW: Earth
BLUE: LIGO probability map
GREEN STAR: Input source (location is randomly seleected unless the true source location is available.)
RED: BAT FOV (the brighter/whiter color refers to higher partial coding fraction).
YELLOW: Earth
BLUE: LIGO probability map
GREEN STAR: Input source (location is randomly seleected unless the true source location is available.)
Click here for the BAT GCN circular template
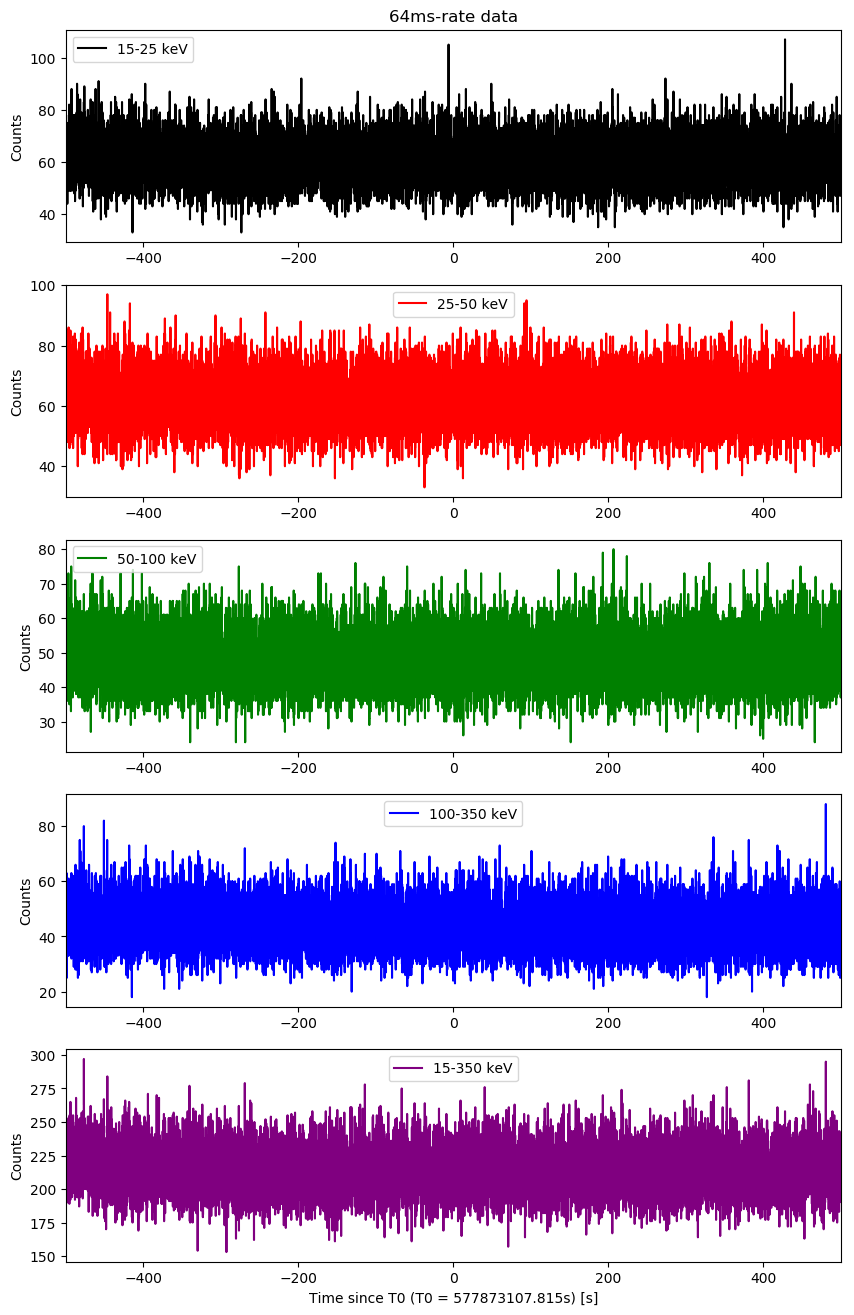
Raw Light Curves
Quad-rate light curves (with 1.6 s time bin)

64-ms light curves
1-s light curves

Event data image search
Event data found. The analysis results are listing below.


## list of detected sources for 00900473000

########################################

########################################
## tstart_since_T0: 0.0
## tstop_since_T0: 0.1
event data don't cover the request time
## tstart_since_T0: -2.0
## tstop_since_T0: 8.0
event data don't cover the request time
########################################

########################################
## tstart_since_T0: -6.815
## tstop_since_T0: -3.6535

                 TIME                           NAME     RA_OBJ    DEC_OBJ        SNR
                    s                                       deg        deg
  1  577873101.000000 Crab                              83.6332    22.0145      5.502
  2  577873101.000000 UNKNOWN                          152.3397    12.9499      4.660
  3  577873101.000000 UNKNOWN                          178.2684    70.0694      3.973
  4  577873101.000000 UNKNOWN                          135.0322    44.0016      4.492
  5  577873101.000000 UNKNOWN                          120.0222    25.4313      4.685
  6  577873101.000000 UNKNOWN                           78.3975    12.7380      4.226
########################################
Last update:
Fri Apr 26 11:45:30 EDT 2019